
There are many different indicators available for Forex trading these days. And it seems that every few months, a new trading indicator appears. But in many cases, these new indicators are just a few variations on the classic versions. Today we will discuss one of the most reliable trading indicators that have stood the test of time. This is a Bollinger Bands indicator. We will discuss this indicator’s main elements and introduce you to various profitable Bollinger Bands trading strategies.
- Read More The Best Forex Strategy for You in 2020
Analysis of Bollinger Bands in Forex
The Bollinger band is well described as an indicator of volatility on a chart. It consists of an upper and lower band that reacts to changes in volatility. Two bands span the price action at the upper and lower extremes. When the volatility of a given trade pair is high, the distance between the two bands increases. When the volatility of a given trade pair is low, the two bands begin to shrink together. The indicator includes a standard 20-time period simple moving averagec-gloss-tip" data-slug="moving-average" tabindex="0">moving average that can be used to establish entry and exit points for trades.
Bollinger bands calculation
As we have already pointed out, the Bollinger Bands’ trading instrument consists of three lines: upper, lower, and middle.
The middle line is a 20-time period simple moving average. It is calculated by adding the closing prices of the last 20 periods and then dividing the result by 20.
The top line is calculated using the 20-period SMA of the price action and its standard deviation. The lower band is calculated in the same way using the 20-period SMA and its standard deviation. The standard deviation used by default is 2. Therefore, the Bollinger Band setting is usually expressed as Bollinger Bands (20, 2).
How to use Bollinger bands
Although it is primarily an indicator of volatility, Bollinger Bands are quite useful for identifying support and resistance areas. The indicator consists of three lines, each of which can display support/resistance functions. However, the double Bollinger bands, including the upper and lower bands, are usually better for this purpose than the centerline.
Several signals can be generated using Bollinger Bands signals. These signals react to different price relationships on the chart. Let’s analyze each of these signals by exploring their potential.
- Checkout This Awesome EA Pegasus Pro EA – [Cost $5000] – For FREE
Bollinger band compression
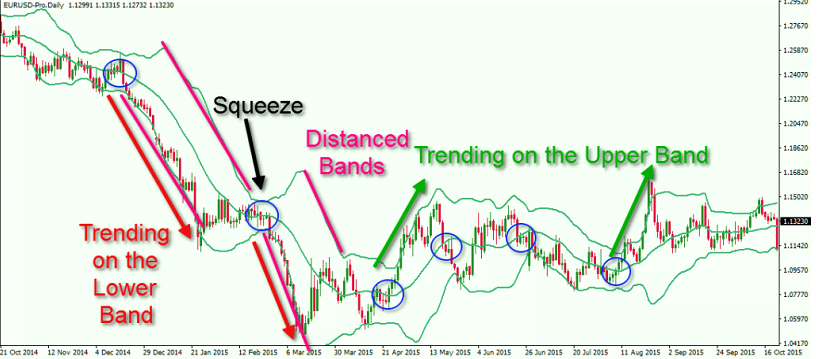
When the Bollinger Bands are near each other, the trading indicator tells us that the Forex pair’s volatility is relatively low. Therefore, the trading volumes are usually low, and the pair is considered to be consolidating, or in a range rather than trending. This is what we call the Bollinger Bands squeeze because the bands are “squeezed” hard. In most cases, we should avoid trading in very narrow price ranges because they provide significantly less profitable opportunities than during trending phases. The image below shows a classic Bollinger Bands’ squeeze.
An important concept to understand in Forex trading is that prices tend to move from periods of low volatility to high volatility periods and vice versa.
As you can see, after the contraction, the price breaks down and goes into a constant downtrend.
A breakout of the compression of the Bollinger Band provides a good prerequisite for entering the market when price moves out of one of the bands. This will support the limited range market coming to an end and the probability that the price will enter a new trend phase.
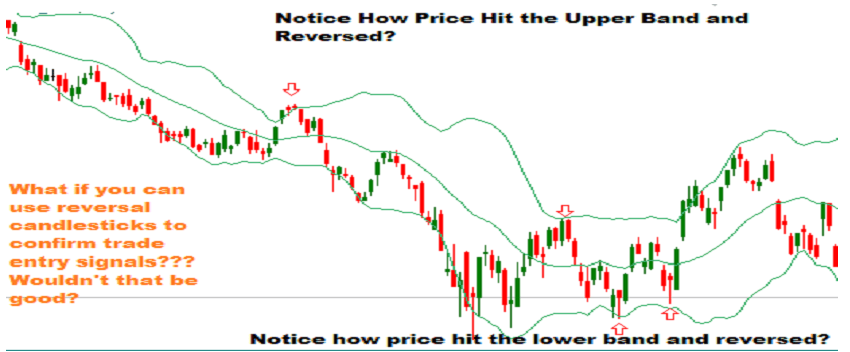
Price touches the lower band.
This is a standard Bollinger Bands signal and indicates that the price is relatively low / oversold in terms of volatility. As an effect, a bullish bounce could occur, creating an opportunity for a long trade. Think of it as a hidden support level based on extreme volatility readings.
However, if instead the price starts to fall rapidly in the lower band and the distance between the two bands continues to increase, then we must be careful when entering a long trade. When the bands widen, and we see strong price momentum below the lower band, this indicates that bearish sentiment should still hold.
Price touches the upper band.
The scenario is the same but in the opposite direction. We view the upper band as a hidden resistance level based on extreme volatility readings. However, if the bands widen and the price begins to close candle after candle above the upper band, then we expect further bullish expansion.
Breakout of the moving average Bollinger band
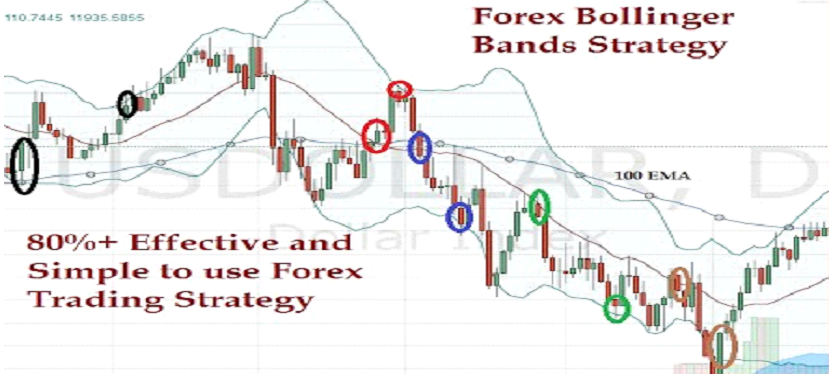
A breakout of the Bollinger bands’ moving average is a confirmation signal that usually occurs after the price interacts with the bands. If the price bounces off the upper band and then breaks the 20-period SMA in a bearish direction, we get a strong short signal. If the price spring off the lower band and breaks the 20 SMA up, we get a strong long signal.
Therefore, the 20-period SMA breakout can be used to establish exit points after entering a trade with the Bollinger Bands.
The Bollinger Bands chart above summarizes the signals we have discussed. Blue circles indicate major breakouts through the 20-period simple moving average. The black arrow indicates the compression of the Bollinger Bands. The red arrow shows the trend of price changes when the lower Bollinger band breaks, and the green arrow shows the trends of the upper Bollinger band.
- Read More 8 Reasons FOREX Traders Lose Money
Bollinger trading bands
Now that we are familiar with the structure and signals of Bollinger Bands, it is time to change our approach a bit and take a look at a couple of trading strategies that can be used with Bollinger Bands.
Bollinger bands with candlestick patterns
One of the Bollinger Band’s reliable trading methodologies is a combination of Bollinger Bands and candlestick analysis. It could go long after the price hits the lower Bollinger band and then closes with an inverted candlestick pattern. On the other hand, you can sell the Forex pair when the price reaches the upper band and then forms a reversal candle.
For this setup, you need to place your stop loss behind the reversal candle. I prefer to close half of the trade when the price reaches the moving average of the Bollinger Bands. This is because candlestick patterns generally do not lead to massive price reversals, but they typically lead to shorter price movements. We can stay in the trade until the second half of the position to take advantage of any extended price movements. And so in this case, if the price continues to move in our direction, we can use the breakout of the moving average of the Bollinger Bands as an exit signal. However, keep in thought that if you receive an earlier confirmation of another reversal pattern, you should not wait for the SMA to break out. Instead, close your trade now.
Let’s now see how this strategy works.
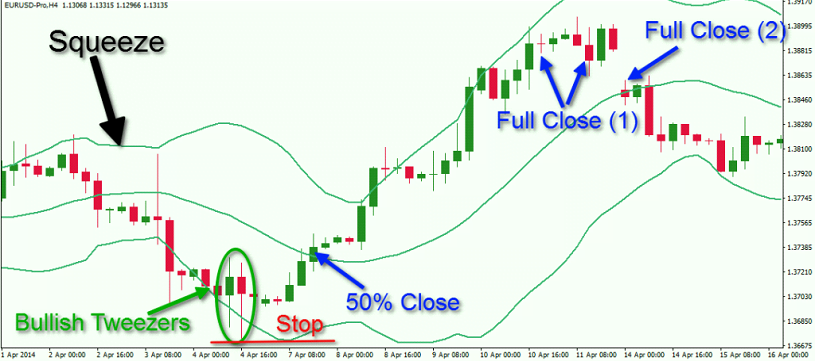
This is a 4-hour chart of the EUR / USD pair from April 1 to April 16, 2014. This chart illustrates a long position initiated by an inverted candlestick pattern.
The large black arrow on the chart shows the compression of the Bollinger band. The bands are located relatively close to each other, tightening the price action and the indicator. After that, the price starts to go down. Suddenly, the bands begin to widen rapidly during the recession. In short, we see the price action creating a bullish caliper reversal candlestick pattern, shown in the green circle in the image. This is a strong long signal emerging in the lower band, creating a good buying opportunity for the EUR / USD. The stop loss (SL) must be placed below the lowest point of the caliper chart pattern, as shown in the image.
Then the price starts to rise. Six periods later, EUR / USD breaks above the 20-period simple moving average Bollinger band. This is when you can close 50% of the deal. The price keeps going up. On the way up, we see several reversal candlestick patterns. However, they are not confirmed, and we do not consider them as a possible exit point for the transaction. At the end of the price rally, we see a Doji reversal candle followed by two larger bearish candles. The second bearish candle’s close can be seen as the first exit of the trade (full close 1). If you decide that this signal is not convincing enough, you can expect the 20-period SMA breakout, which occurs three periods later.
I prefer to use a Doji reversal, followed by two bearish candles as an exit point. Even if you think the signal is not convincing enough, it comes 8 hours before the weekly market close.
Therefore, it is the best option to exit the trade. In this way, you are protected from the weekend’s risk and large gaps with Monday’s opening. If you choose to wait, you would be the victim of a 30 pip gap.
- Read More one-minute forex scalping strategy