

Elliott Waves Theory describes markets as a rhythm of five-wave impulses (with trend) followed by three-wave corrections (against trend). That rhythm can be seen on any timeframe. The challenge in real trading is counting consistently and acting on high-probability parts of the pattern without drowning in subjectivity.
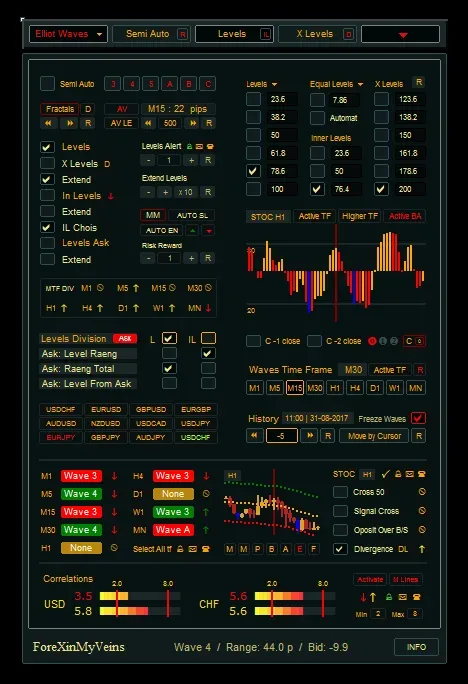
That’s where Auto Elliott Waves for MT4 is practical. It can auto-plot waves from fractal structure or semi-assist while enforcing basic rules; it offers an MTF dashboard, divergence on multiple oscillators, Fibonacci/trading levels, Average Price Movement, and correlation strength so you evaluate quality quickly and set realistic targets.
In these Forex trading strategies based on Elliott Waves, we’ll exploit the two parts of the cycle that tend to offer the cleanest reward-to-risk:
- Wave-3 Breakout: the engine of the trend, often the most impulsive leg.
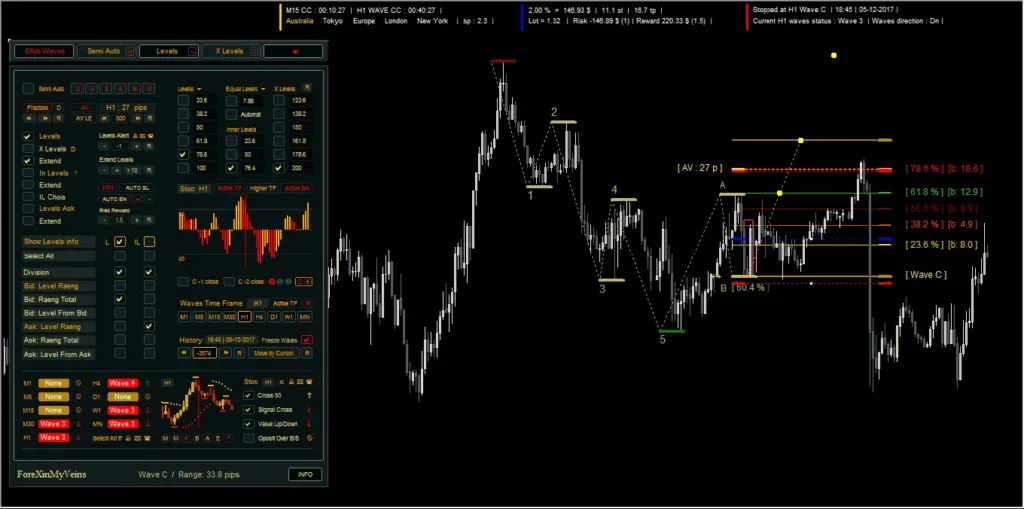
- Wave-5 Reversal → ABC: momentum fades into the last impulse; divergence often appears; an ABC pullback frequently follows a complete five-wave move.
Table of Contents
Before Trading Elliott Waves

Before you place any trade based on Elliott waves, there are three golden rules you must respect. Think of these as non-negotiable sanity checks that keep your wave counts valid and your trades safe:
- Wave-2 cannot retrace more than 100% of Wave-1.
- If price falls back all the way below the start of Wave-1, the entire pattern is invalid. This rule also defines your stop-loss for Wave-3 setups (below Wave-2).
- Wave-3 cannot be the shortest among Waves 1, 3, and 5.
- Wave-3 is typically the strongest leg of an impulse. If it turns out shorter than both Wave-1 and Wave-5, the count is incorrect and you should exit.
- Wave-4 must not overlap Wave-1 price territory.
- In a standard impulse (except rare diagonal patterns), Wave-4 should stay above Wave-1 in an uptrend or below Wave-1 in a downtrend. If overlap happens, your count is broken.
The Auto Elliott Waves indicator helps enforce these automatically when plotting counts, but it’s important to check them yourself. These rules not only confirm that the pattern is valid, they also naturally define your stop locations and trade invalidation points, giving you a built-in risk framework.
Best Timeframes, Currency Pairs, and Trading Sessions

Choosing the right chart settings and market conditions makes a huge difference when applying the Auto Elliott Waves indicator. Here’s a simple breakdown:
- Trend Map (Structure) – Use the H1 or H4 timeframe to identify the broader wave pattern and overall trend.
- Execution Chart – For day traders, the best entry charts are M15 or M30. If you prefer swing trading, the H1 chart works better for spotting entries.
- Currency Pairs – Stick to major Forex pairs and high-liquidity crosses like EUR/USD, GBP/USD, USD/JPY, and EUR/JPY. These pairs provide cleaner waves and tighter spreads.
- Trading Sessions – The most reliable signals come during the London session and the early New York session, when volatility is high and wave impulses are cleaner.
To make scanning easier, use the indicator’s multi-timeframe (MTF) and multi-pair dashboard with alerts. This feature helps you quickly spot new Wave-1/2 formations or potential Wave-5 divergences during active market hours, so you never miss a quality setup.
Auto Elliott Waves Indicator Setup
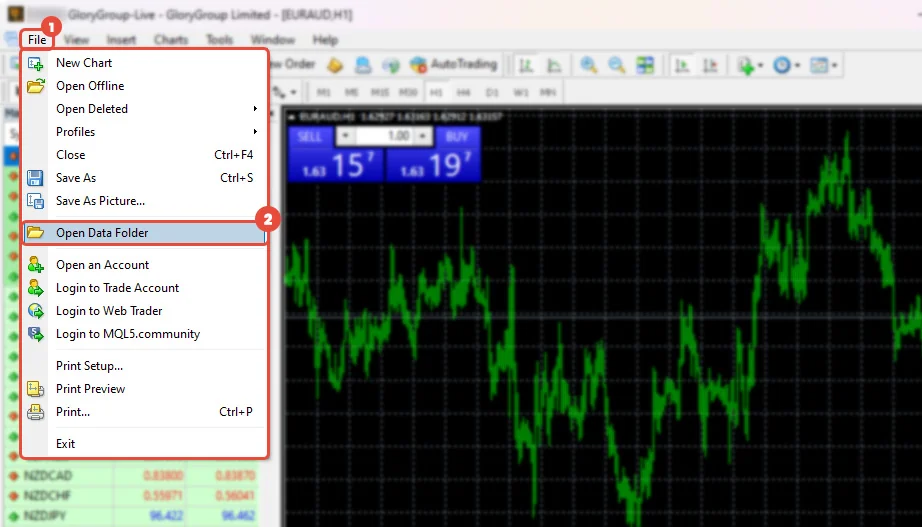
- Install the indicator into MT4 → File → Open Data Folder → MQL4 → Indicators. Restart MT4.
- Attach it to your charts and enable the MTF dashboard and alerts.
- Pick your divergence oscillator (RSI or MACD is a solid start).
Tip: Start in Fully Automatic mode to scan and learn; switch to Semi-Automatic if you want to adjust labels while staying inside the core rules.
Elliott Waves Strategy 1: Wave-3 Breakout (Trend-Following)
The Trading Logic (why this works)
In a valid impulse, Wave-3 is never the shortest and is frequently the strongest leg. That makes breakout over the Wave-1 high/low (after a Wave-2 pullback) a high-quality trigger. Fib projections make target-setting straightforward: a common objective is 100% (equality) and 1.618× of Wave-1 measured from Wave-2.
Setup Quality Checklist
- Fresh Wave-1 & Wave-2 are labeled on your execution TF (e.g., M15/M30).
- Wave-2 retracement ideally 38.2–61.8% of Wave-1 (not mandatory, but healthy).
- MTF alignment: higher TF (H1/H4) is trending the same way.
- No major news moments away.
- No strong opposite divergence into the Wave-2 end.
- Correlation check: avoid stacking multiple similar pairs.
Long Trade Rules (mirror everything for shorts)
- Detect 1–2: Let the indicator mark a Wave-1 up and Wave-2 down.
- Entry trigger:
- Place a buy stop just above the Wave-1 high (classical “price confirms the count” entry).
- Conservative traders can wait for a full candle close beyond the Wave-1 high.
- Invalidation/Stop:
- Primary stop a few pips below the Wave-2 low (because Wave-2 can’t retrace all of Wave-1 if it does, your premise is invalid).
- Optional: add ATR-based cushion (e.g., SL = Wave-2 low − 1.0×ATR(14)) on fast pairs.
- Targets:
- TP1 = 1.0× Wave-1 projection from Wave-2 (book partial, move SL to breakeven).
- TP2 = 1.618× Wave-1 projection; trail the rest (see below).
- If the indicator’s Average Price Movement suggests the symbol rarely stretches to your TP2 before mean-reverting, tighten expectations or bank earlier.
- Trail/Exit options:
- ATR(14) trailing stop: 1.5–2.0× ATR under swing lows/swing highs.
- Or PSAR/Bollinger mini-chart cues available inside the tool.
- What can go wrong (and what to do):
- If the subsequent wave structure violates hard rules (e.g., Wave-4 overlaps Wave-1 in a non-diagonal, or Wave-3 ends up the shortest), exit your count degraded.
Execution Example (mental picture)
- M15 shows Wave-1 up, Wave-2 pullback to ~50%.
- H1 trend is also up; dashboard confirms.
- Place buy stop above Wave-1 high; SL below Wave-2 (with a small ATR cushion).
- Price breaks, momentum expands (no bearish divergence) you scale at TP1, let a runner trail to 1.618× and beyond.


Download a Collection of Indicators, Courses, and EA for FREE
Elliott Waves Strategy 2: Wave-5 Reversal → ABC (Counter-Trend After a Climax)
The Trading Logic (why this works)
When a five-wave impulse is maturing, Wave-5 can extend on price but not on momentum your RSI or MACD often prints bearish divergence (in an uptrend) or bullish divergence (in a downtrend). That momentum “non-confirmation” warns of a fade and the start of a three-wave correction (A-B-C).
Note: Divergence is not a guarantee; it’s context. You still need a trigger and proper risk controls.
Short Trade Rules at a Bullish Fifth (mirror for longs at a bearish fifth)
- Spot the 5th: The indicator tags Wave-5 up close to an extension or channel top; oscillator (RSI/MACD) shows bearish divergence (higher price high, lower oscillator high).
- Trigger:
- Draw a micro trendline from the Wave-5 push. Enter on a decisive break/close below it, or on a bearish engulfing that snaps back inside the prior channel.
- Stop:
- A few pips above the Wave-5 high (+ ATR cushion if volatility is high).
- Targets / Managing the ABC:
- TP1: The Wave-4 price zone (frequently the first magnet).
- TP2+: Ride the A-B-C: after the first drop (A) and a counter-pullback (B), aim for C ≈ A or extensions (1.272–1.618× A) when momentum persists.
- MTF confirmation (optional but strong):
- If the higher timeframe is stretched (e.g., H1/H4 overextended into resistance), the reversal odds improve.
- What can go wrong (and what to do):
- No follow-through after the trendline break? Cut quickly; a running fifth (extended Wave-5) is still possible.
- Divergence resolves sideways (not down): consider time stop if price stalls beyond your plan, exit flat or tightened.
Using the Indicator’s Feature Set Like a Pro
- Fully Automatic vs Semi-Automatic: Elliott Waves Indicator Auto mode is great for scanning and learning; semi-auto lets you nudge labels while the tool enforces core constraints best of both worlds when counts get nuanced.
- MTF/Multi-Pair Dashboard + Alerts: Track where fresh 1-2s or 5th-wave divergences are forming across pairs catch setups early.
- Divergence Engine: Pick RSI or MACD (or AO/Stoch) for divergence highlights on multiple timeframes to support the Wave-5 fade idea.
- Fibonacci & Trading Levels: Project equality (1.0×) and 1.618× of Wave-1 for Wave-3 targets; for ABC, measure A to project C.
- Average Price Movement: A unique helper estimates typical swing ranges between fractal highs/lows (up to 1000 bars). Use it to set realistic TPs and avoid over-stretching.
- Correlation Strength: Don’t double risk by taking EURUSD + GBPUSD in the same direction if they’re strongly correlated. One excellent setup beats three overlapping bets.
- Mini-Charts (ATR/PSAR/BB/MAs): Keep your main chart clean while still seeing volatility, trend, and stop cues.
Execution Details That Protect Your Edge
Entries
- Wave-3 Breakout: buy stop above Wave-1 high (or sell-stop below Wave-1 low); the break itself confirms the count.
- Wave-5 Reversal: use a price action trigger (micro trend line break, engulfing, break of structure back inside channel) rather than divergence alone.
Stops
- Structural stops at the invalidating level (below Wave-2 for Wave-3 longs; above Wave-5 for reversal shorts).
- Add ATR padding when spreads widen or volatility spikes; ATR is a volatility gauge, not a trend signal but perfect to size buffers and trails.
Targets & Trails
- Wave-3: partial at 1.0× Wave-1, runner toward 1.618×.
- Wave-5 reversal: partial at Wave-4 zone, trail for A-B-C completion (C ≈ A is a common expectation).
- Trailing options: classic ATR trailing or PSAR. If momentum dries, bank profits don’t let a green trade turn red.
Session & News Filters
- Prefer London and early NY.
- Stand aside into high-impact macro releases; impulse structure can morph violently and spoil edge.
Risk Management Rules for Elliott Waves Forex Trading

Even the best Elliott Waves trading strategies can fail without proper risk management. These simple rules are designed to be practical and easy to follow:
- Risk per trade: Keep your exposure conservative. A good baseline is around 1% of your account per trade. Only stretch up to 2% if the setup is high quality with strong MTF alignment and confirmation.
- One idea, one cluster: Don’t double or triple your risk by trading multiple correlated pairs (like EUR/USD, GBP/USD, and AUD/USD all long at the same time). Pick the single best setup across the cluster and stick with it.
- Position sizing formula: Always calculate position size properly:
Position Size = (Account Risk in Currency) ÷ (Stop Distance in Pips × Pip Value)This ensures your risk stays consistent no matter the pair or stop size. - Maximum exposure: Limit the number of trades you run at once. Only take as many positions as you can comfortably monitor and manage without stress. Quality is more important than quantity.
By following these rules, you keep losses small, avoid account blow-ups, and make sure that when the market gives you a clean Elliott Wave setup, you’re ready to capitalize with confidence.
Backtesting and Journaling Your Forex Trading Strategies

To make these Forex Trading Strategies truly your own, you need to backtest it and keep a trading journal. This is where theory turns into measurable results.
1. Choose your testing ground
- Start with one timeframe and a small set of pairs (e.g., M15 entries mapped to H1 on EUR/USD, GBP/USD, or USD/JPY).
- Don’t spread yourself too thin focus on one market setup at a time.
2. Build a sample size
- Collect at least 50–100 trades using only one play first (either Wave-3 breakouts or Wave-5 reversals).
- This helps you see consistent patterns without mixing strategies.
3. Log every detail
For each trade, record:
- Setup type (W3 or W5)
- Was MTF alignment present?
- Was divergence present?
- Entry trigger used
- Stop distance (pips + ATR multiple)
- Target plan (1.0× / 1.618× or ABC)
- R-multiple achieved
- Notes on whether the wave structure stayed valid
4. Analyze your data
- Compare ATR trailing stops vs fixed Fibonacci targets.
- Test strict vs relaxed news filters.
- See if RSI divergence works better for you than MACD divergence.
5. Keep what works, drop what doesn’t
- Promote the setups that show the highest positive expectancy and the least stress.
- The goal is not just profitability, but also emotional comfort a strategy you can follow without second-guessing yourself.
Common Elliott Waves Trading Mistakes and How to Avoid Them

Even with a powerful tool like the Auto Elliott Waves indicator, traders can fall into common traps. Here are the main pitfalls to watch out for and the simple fixes that keep your Forex trading strategies on track:
1. Over-counting waves
When your chart looks like a bowl of spaghetti, it’s a sign you’re forcing labels. If you can’t clearly see a fresh Wave-1 and Wave-2, step back. Use the multi-timeframe (MTF) view to re-anchor your analysis, or wait for the next clean setup.
2. Ignoring the core rules
Never compromise on Elliott’s hard rules: Wave-2 can’t retrace more than 100% of Wave-1, and Wave-4 shouldn’t overlap Wave-1 (except in rare diagonals). If these are violated, your count is invalid close the trade and reassess.
3. Using divergence as a trigger by itself
Divergence is context, not a complete signal. Always combine it with a break of structure or a trendline break to confirm momentum is truly shifting.
4. Chasing every pair
It’s tempting to jump on multiple correlated pairs showing similar setups, but this only increases risk without increasing edge. Use the indicator’s correlation panel and stick to one clean vehicle for the idea.
5. Setting unrealistic targets
Don’t expect every move to stretch endlessly. The Average Price Movement tool helps you set targets that reflect how far a pair typically travels, keeping take-profits grounded in reality.
Frequently Asked Questions
Q: Does Auto Elliott Waves repaint?
A: Automatic wave labeling can re-assign as new highs/lows form (that’s part of wave discovery), but the tool enforces core rules and gives you semi-auto control if you want to anchor counts yourself. Use hard invalidations and triggers, not labels alone.
Q: Best timeframe to learn on?
A: For day traders, start with H1/H4 for structure and M15/M30 for entries; for swing, H4/D1. The indicator is timeframe-agnostic, so pick what matches your lifestyle.
Q: RSI or MACD for divergence?
A: Both work. MACD highlights momentum shifts well; RSI gives clean divergence visuals and overbought/oversold context. The indicator supports RSI/MACD/AO/Stoch choose one and be consistent.
Q: How do I place stops?
A: Combine structure (below Wave-2 / above Wave-5) with an ATR buffer to avoid noise-outs in volatile phases, then trail with ATR/PSAR as price trends.
Q: Why 1.0× and 1.618× targets?
A: They’re standard Fibonacci projections widely used by Elliott traders for impulse targets and by many technical traders for extensions.
Conclusion
The Elliott Waves Forex Trading Strategies keeps trading simple and structured. By combining automated wave counts, divergence signals, and Fibonacci levels with disciplined management, you can capture two high probability setups: the Wave-3 breakout and the Wave-5 reversal into an ABC correction.
Success comes not from spotting every wave but from applying rules, invalidations, and risk discipline. With patience, selective trading, and consistent journaling, a few quality setups each week are enough to build steady results.