

Most traders don’t lose money because they can’t read charts they lose because they enter too late.
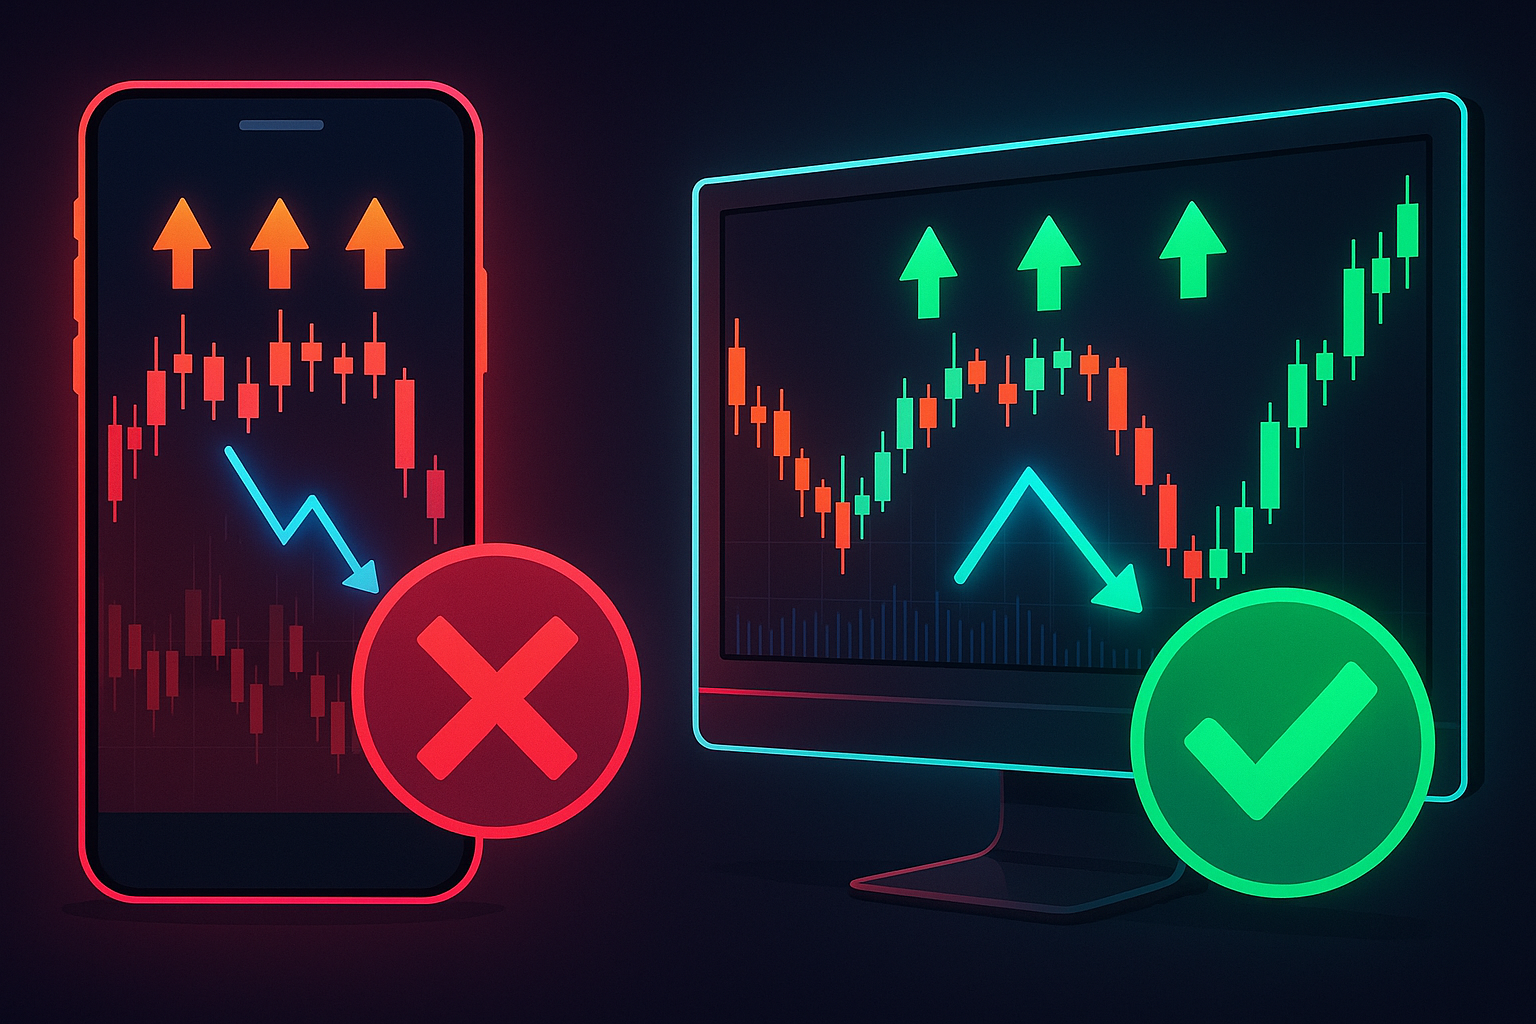
Markets rarely reverse out of nowhere. More often, they give clear warnings. One of the most reliable is the Triple Top and Bottom pattern, where price tests the same key level three times:
- At resistance, price forms a triple top and fails to break higher
- At support, price forms a triple bottom and fails to push lower
This repeated failure signals market exhaustion. It’s like the market saying: “I’ve tried… and I’m done.”
But here’s the problem: most traders either ignore the pattern, chase the move after it’s already started, or hesitate and miss the entry entirely. By the time they take action, the reversal is over and they’re caught on the wrong side.
That ends now.
In this guide, you’ll learn:
- A simple, proven price-action strategy using the Triple Top and Bottom pattern
- Exactly how to enter, where to place your stop-loss, and how to set smart profit targets
- How to automate pattern detection with a free, non-repainting MT4 indicator so you never miss a setup
This is a practical system that works across pairs, timeframes, and skill levels even if you’re new to trading.
Triple Top & Triple Bottom Explained
Let’s break down one of the most powerful (and overlooked) price action patterns in trading: the triple top and triple bottom.
What’s a Triple Top?
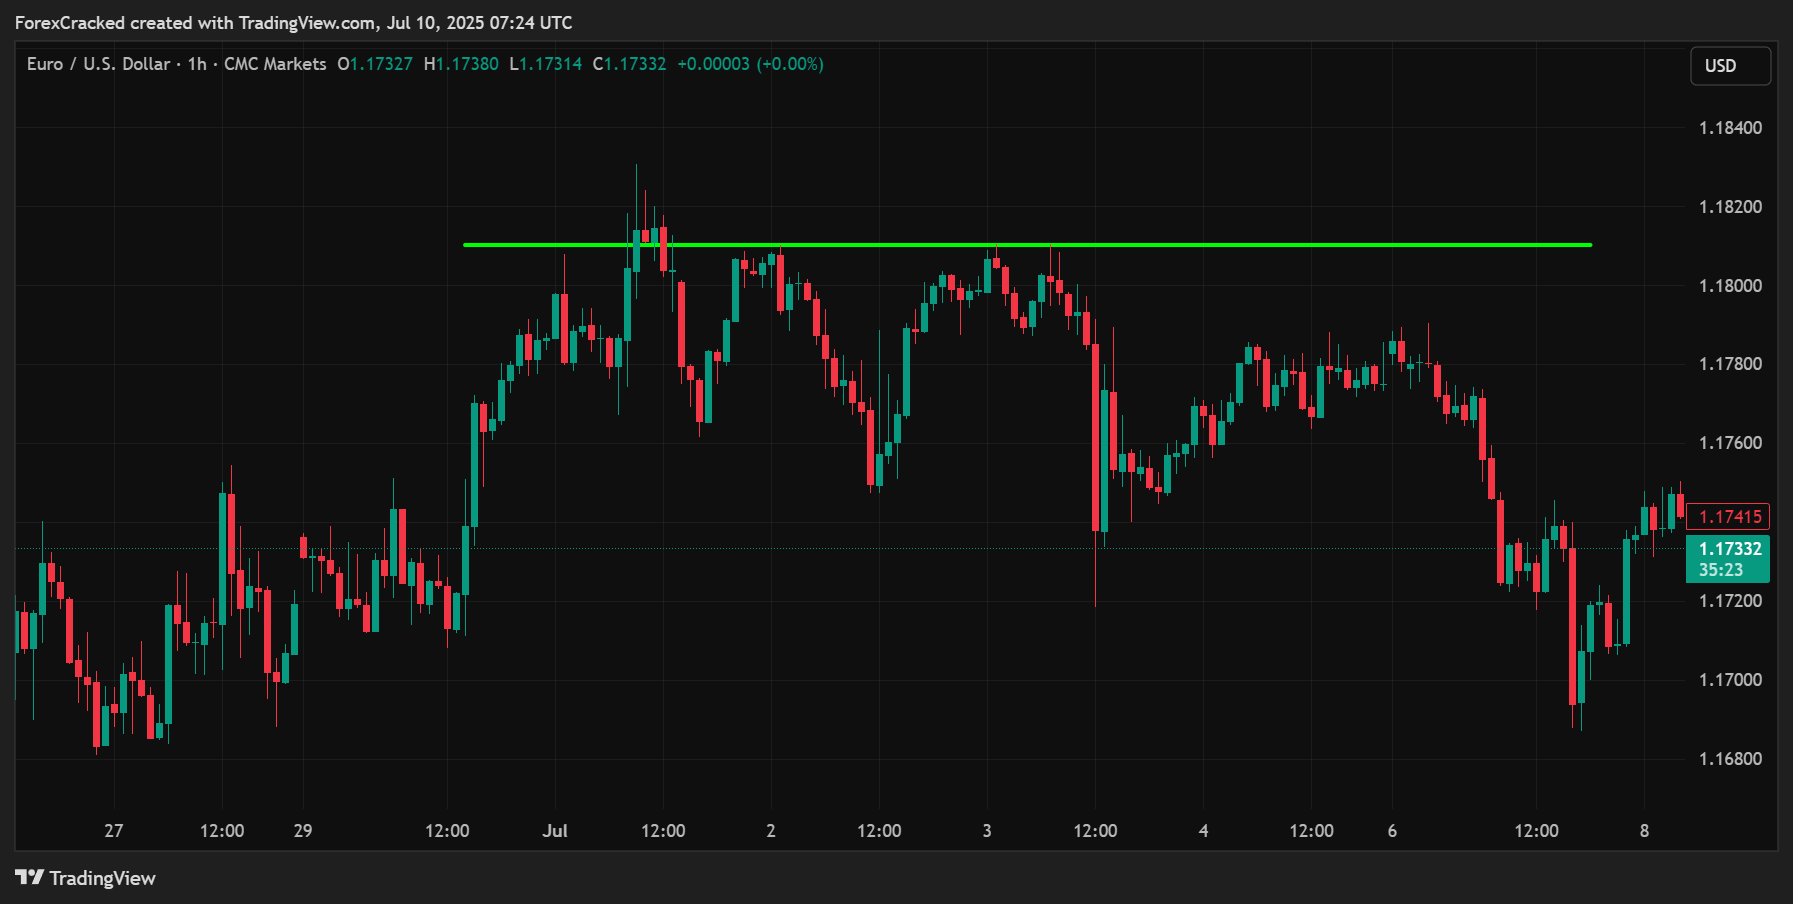
A triple top forms when price rises to the same resistance level three separate times but fails to break through each attempt.
Think of it like the market banging its head on a ceiling over and over until it gives up and turns around.
This usually signals that buyers are losing steam, and a bearish reversal is likely to follow.
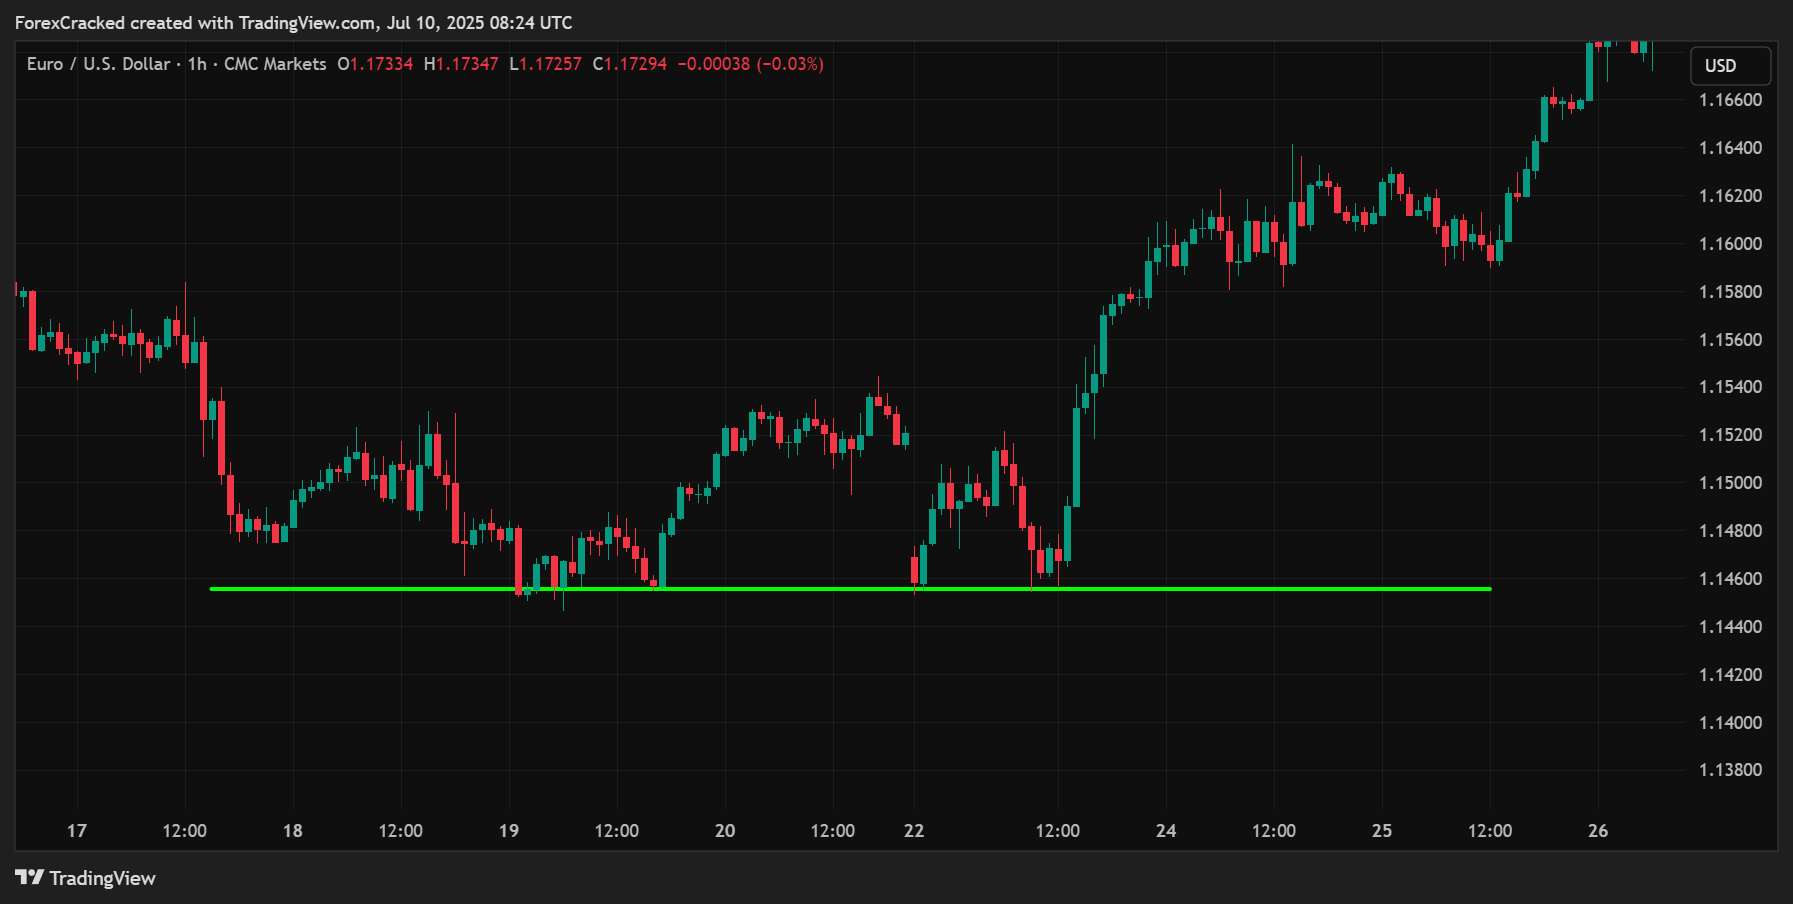
What’s a Triple Bottom?
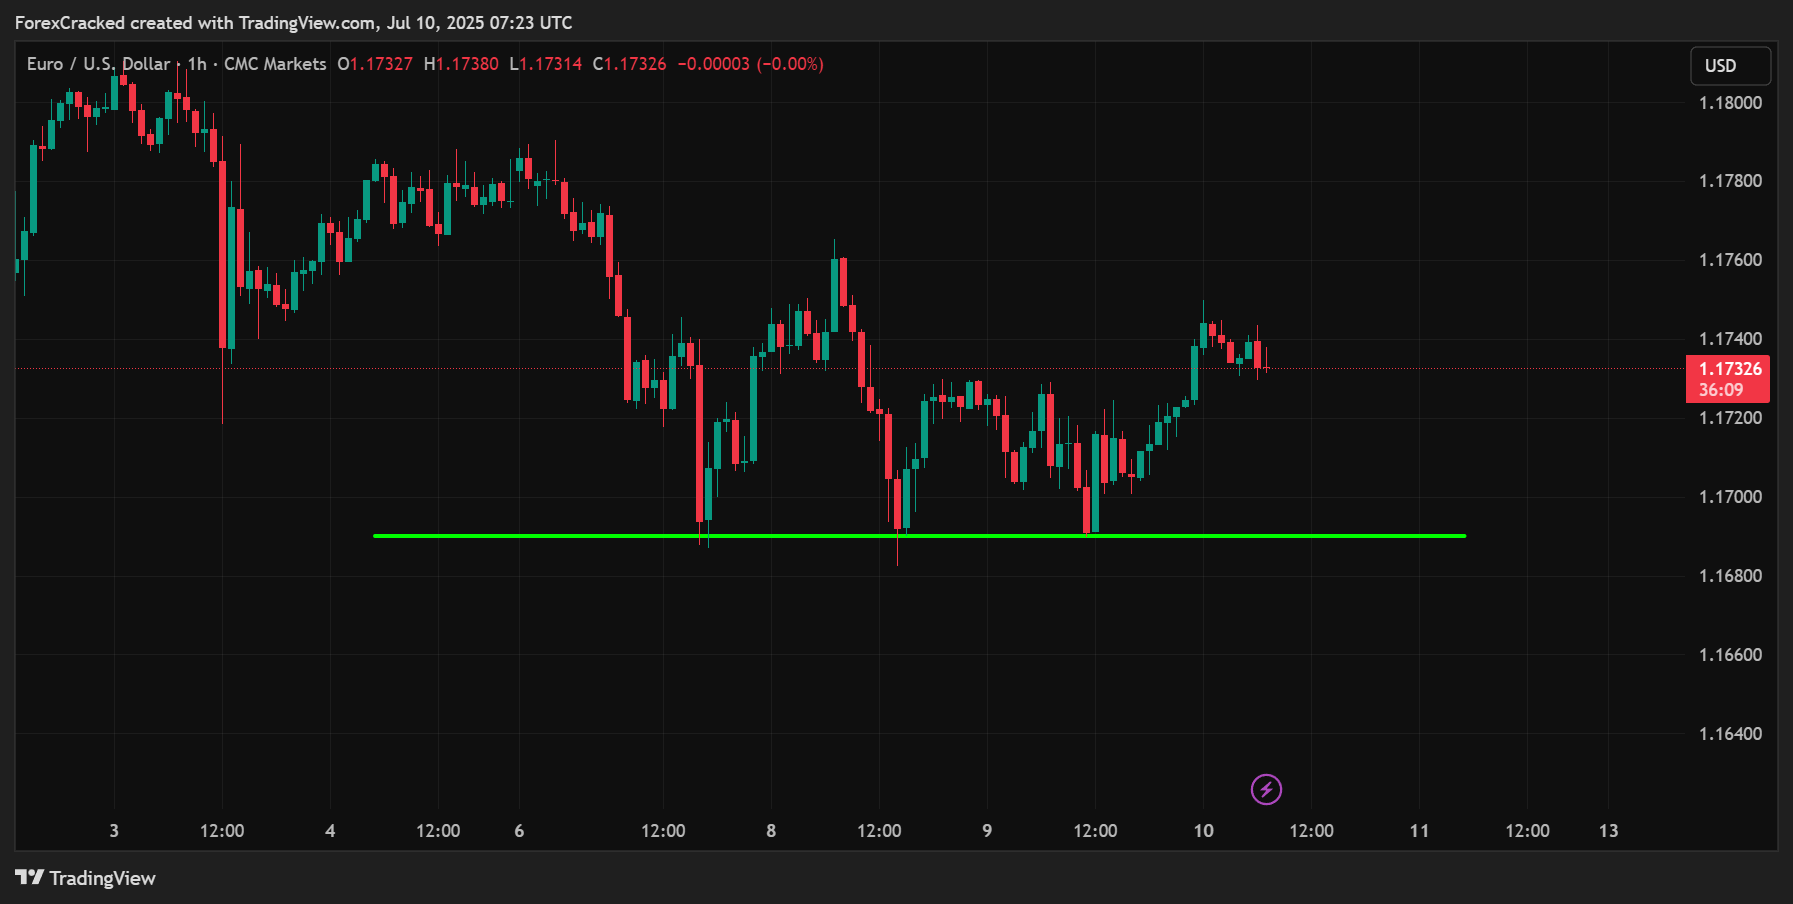
A triple bottom is just the opposite. Price drops to the same support level three times but fails to break lower.
It’s like the market hitting a floor repeatedly but refusing to fall through.
That’s a strong clue that sellers are running out of momentum, and a bullish reversal could be on the way.
These patterns are especially powerful when they appear after a strong trend because they often mark the beginning of a new direction.
Why Most Traders Miss Them
The problem? Spotting these patterns live on a chart especially during fast-moving markets isn’t easy. The price action may look messy, or the pattern might not be obvious until it’s too late.
That’s why, in a later section, we’ll introduce a free, non-repaint MT4 indicator that automatically detects confirmed triple tops and bottoms for you. It highlights the exact moment the pattern completes so you don’t have to guess or stare at charts all day.
Understanding this pattern is the first step. Automating it is how you start trading it with confidence.
How to Trade Triple Top & Bottom Patterns: A Step-by-Step Forex Strategy
The triple top and triple bottom strategy is not about guessing market tops or bottoms it’s about patiently waiting for clear, repeatable price behavior and using a structured system to act on it.
Let’s break down the entire process into 8 simple but powerful steps you can use on any chart, in any market.
Step 1: Choose Your Timeframe

The first step is deciding what type of trader you are, and which timeframes suit you best.
- Scalpers (short-term): Use M5 to M15 timeframes for quick in-and-out setups.
- Swing traders (medium-term): Focus on H1, H4, or Daily charts for bigger, more stable moves.
The logic of this strategy applies to all timeframes the only difference is how often setups appear and how long trades run.
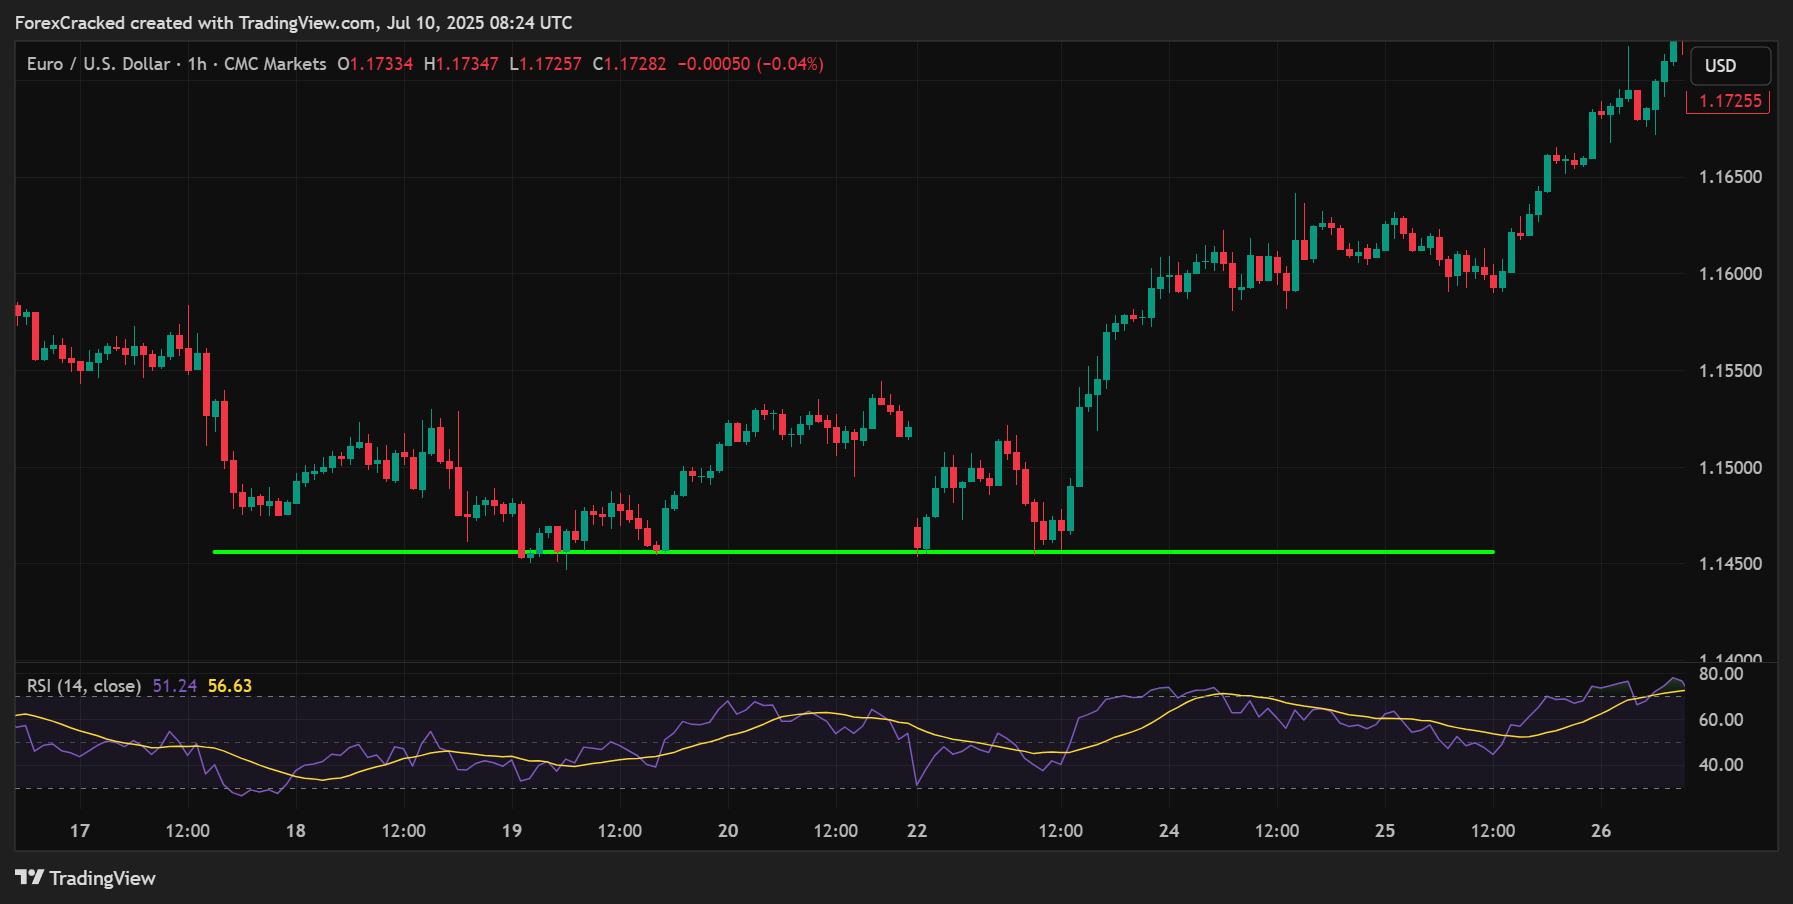
Step 2: Mark Key Horizontal Zones
Look at your chart and identify areas where price has touched the same level at least twice in the past.
These are your potential triple top or bottom zones places where the market might struggle again.
The cleaner the touches and the stronger the reaction each time, the more significant the level.
Tip: Use horizontal lines or rectangles to mark these zones clearly.
Step 3: Add One Momentum Tool
To increase the accuracy of this strategy, combine it with a simple momentum indicator.
The goal is to confirm that momentum is fading as price returns to the zone for a third time.
Choose one:
- RSI (14): Look for divergence (e.g. price makes a new high, but RSI makes a lower high).
- MACD: Watch for histogram divergence or crossover patterns.
You don’t need a complicated setup just enough to tell you whether momentum is backing up the reversal.
Step 4: Wait for the Third Touch
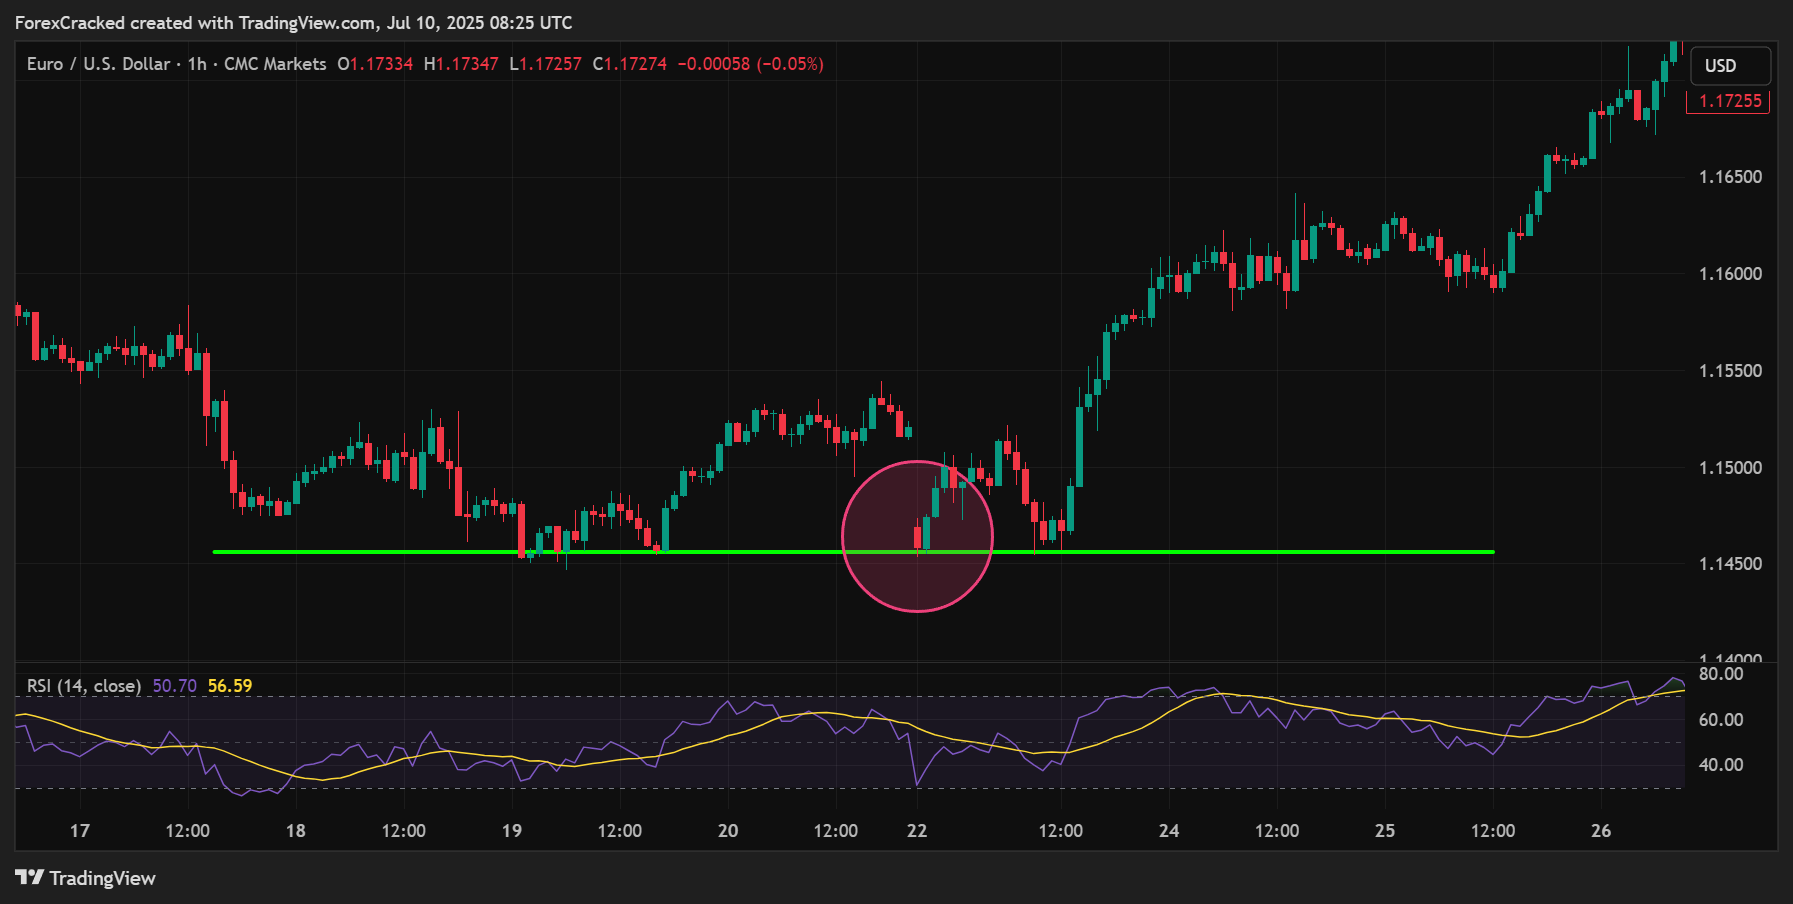
This is where discipline pays off.
Many traders jump in on the second touch, expecting a bounce. But that’s not confirmation it’s just hope.
You want to wait until the third clear reaction from the same level. That’s when the triple pattern becomes valid.
If you’re using the free MT4 indicator (we’ll introduce it later), it does this part for you by printing a signal only after the third touch confirms.
Step 5: Confirmation Checklist

Before you pull the trigger on any trade, go through this simple 3-point checklist:
✔ Pattern Complete – triple top or bottom confirmed
✔ Momentum Divergence – RSI or MACD shows weakening trend pressure
✔ No Red-Flag News – nothing major on the calendar in the next 15 minutes
Trade only if at least 2 out of 3 boxes are checked.
This filter alone can eliminate a huge percentage of false signals.
Step 6: Execute the Trade
Now you’re ready to enter.
For Triple Top (Bearish Setup):
- Sell at the close of the confirmation candle after the third touch
- Place your stop-loss a few pips above the highest peak
- Target the nearest support zone or structure
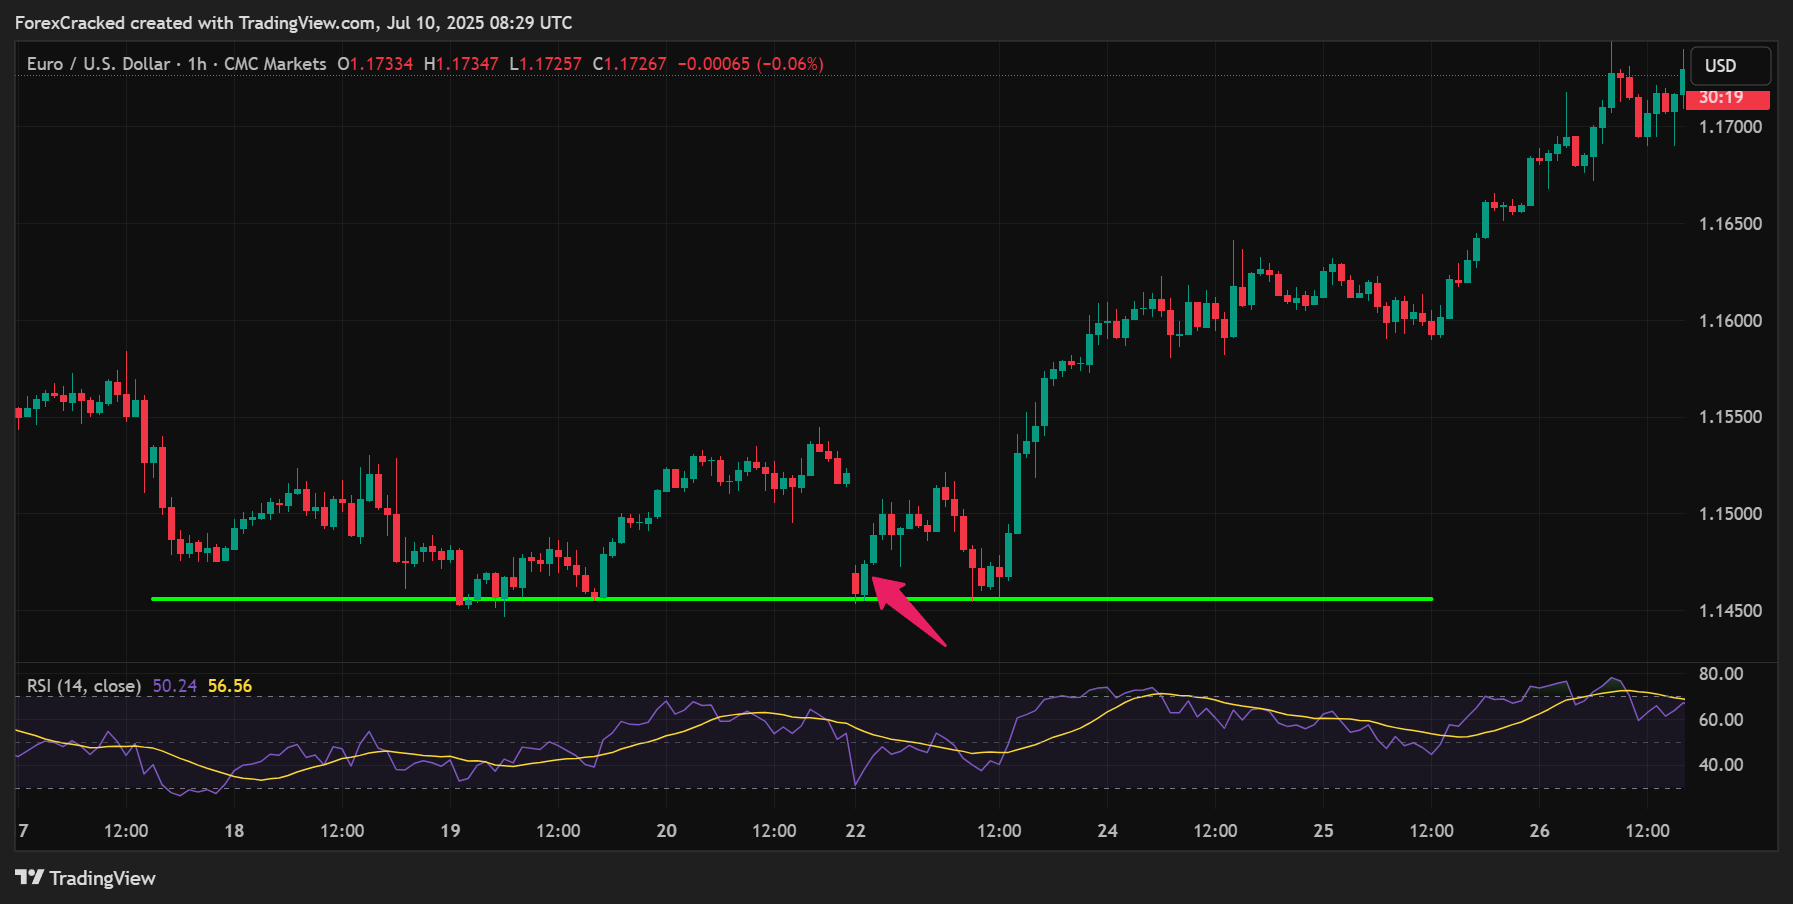
For Triple Bottom (Bullish Setup):
- Buy at the close of the confirmation candle after the third touch
- Place your stop-loss a few pips below the lowest trough
- Target the nearest resistance zone or structure
Keep your setup clean and simple your edge comes from repetition, not complexity.
Step 7: Plan Your Targets
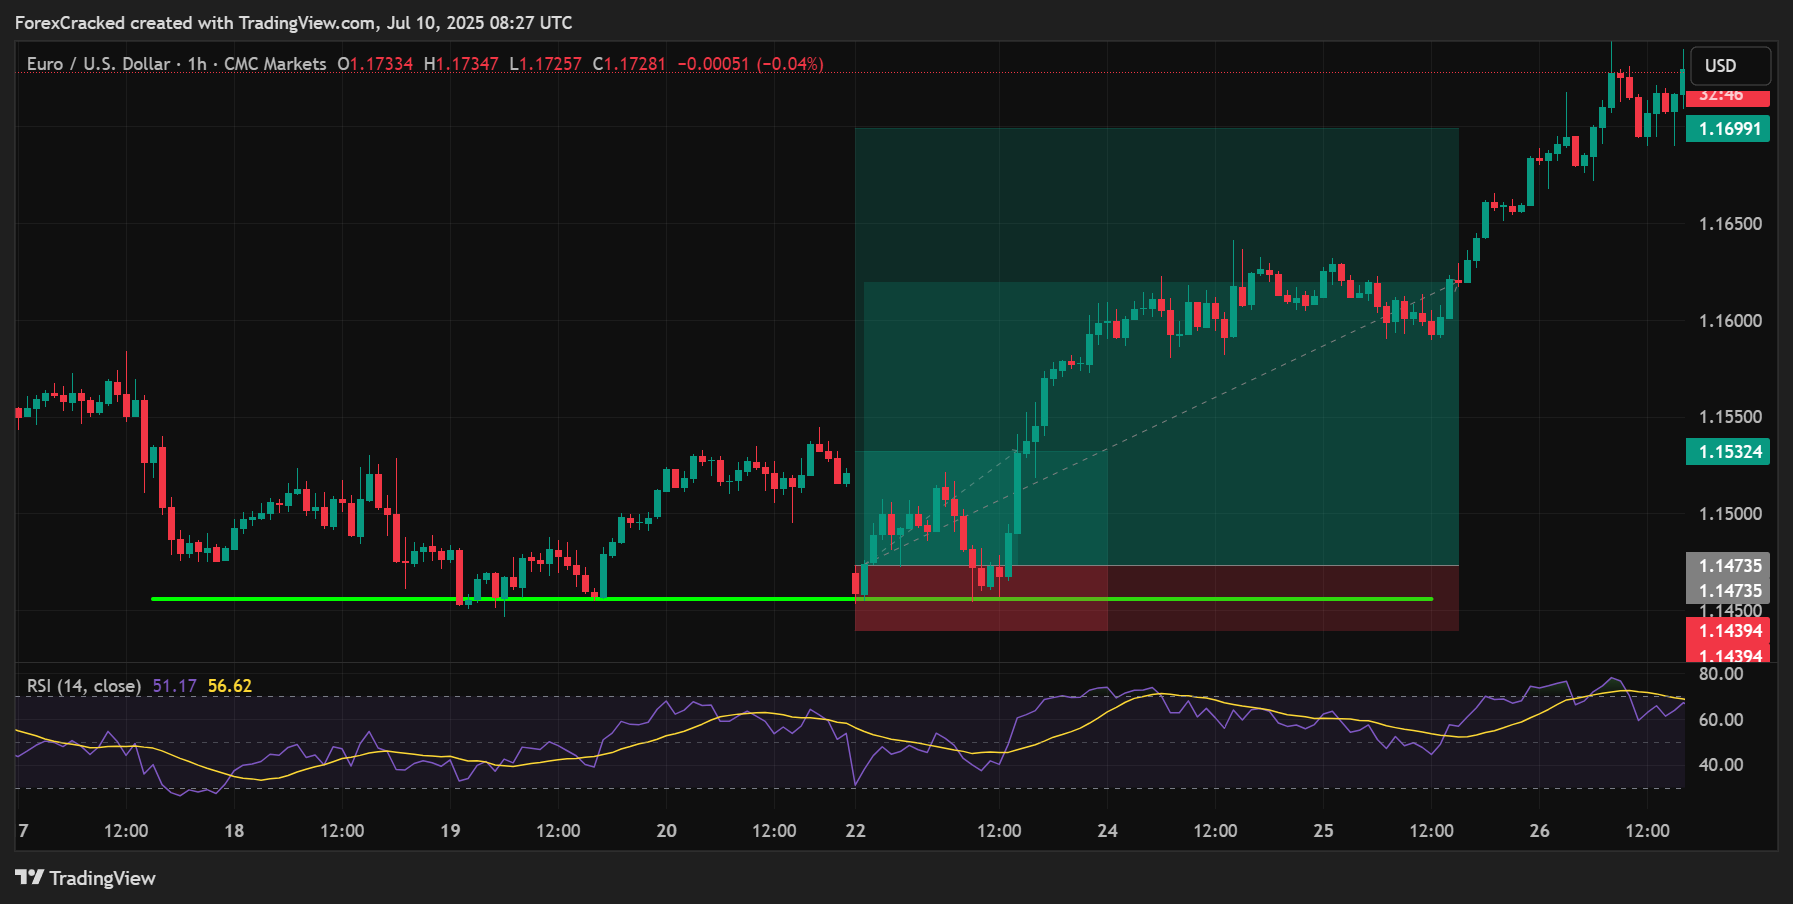
Use a 2-stage take-profit system:
- First target (TP1) = 1× your risk (for example, if SL = 30 pips, TP1 = 30 pips)
- Runner target = next structure level, or trail your stop behind swing highs/lows
This approach locks in profit and leaves room for bigger wins when the market keeps running.


Download a Collection of Indicators, Courses, and EA for FREE
Step 8: Stick to Strong Money Management

Even the best strategy needs smart risk control. Here’s how to manage yours:
- Risk no more than 1% of your account per trade
- Always aim for at least a 2:1 reward-to-risk ratio
- Avoid overloading: max two open positions per pair to limit exposure and correlation risk
Trading is a long game. Survive the losses, protect your capital, and let your edge play out over time.
Final Thoughts on the Strategy
This 8-step process gives you a complete trading plan you can start using today:
✅ It’s clean
✅ It’s logical
✅ It works across any chart or pair
By following this structure and avoiding emotional, impulsive trades you’ll place yourself in the top 10% of retail traders who actually follow a tested, rules-based approach.
Stick around we’re about to show you how to make it even easier using a free MT4 indicator that scans for you automatically.
Common Pitfalls & Easy Fixes When Trading Triple Tops & Bottoms
Even with a solid strategy, small mistakes can cost you trades or worse, your confidence.
Let’s look at the most common errors traders make when using the triple top and bottom strategy and how to avoid them with simple fixes.
❌ Mistake #1: Jumping in Too Early (Second Touch Trap)
Many traders get excited when price hits the same support or resistance level twice and immediately place a trade expecting a reversal.
The problem?
Two touches don’t confirm a triple top or bottom. It’s just a double top/bottom and these often fail.
The fix:
✅ Wait for the third touch. That’s what confirms the pattern and triggers our edge.
✅ Better yet, let the MT4 indicator do the waiting for you it prints a signal only after the third point is validated, removing the guesswork.
❌ Mistake #2: Ignoring the Bigger Picture
Spotting a triple bottom on the 15-minute chart might look like a great long setup but if the higher timeframes (like the daily or 4H) show a strong downtrend, you could be trading against the market’s momentum.
The fix:
✅ Always zoom out before entering.
Check the higher timeframe trend (1–2 levels above your chart) to see if your trade aligns with the bigger market direction.
✅ Ideally, your setup should be part of a broader trend shift or at least a clean pullback within a larger range.
❌ Mistake #3: Setting Stops Too Tight (The “Hope Stop”)
New traders often place stop-losses at round numbers or too close to their entry, hoping to avoid loss.
But this usually leads to getting stopped out by normal market noise, only to watch the trade go in your direction afterward.
The fix:
✅ Place your stop-loss beyond the extreme point of the pattern either above the triple top or below the triple bottom.
✅ Use structure, not emotion, to decide your stop your stop is a safety net, not a hope zone.
❌ Mistake #4: Trading Around News
Even if a triple top/bottom looks perfect, entering just before a major news release (like NFP or FOMC) can ruin your trade. Spikes can smash your stop or blow past your entry in seconds.
The fix:
✅ Always check the economic calendar before entering a trade.
✅ Avoid trading setups within 15–30 minutes of high-impact news especially on USD, EUR, or JPY pairs.
❌ Mistake #5: Overtrading the Pattern
Once traders learn to spot triple tops and bottoms, they start seeing them everywhere even in weak or messy price action.
The fix:
✅ Be selective. Only trade the cleanest setups with:
- Clear levels
- Confirmed touches
- Strong confluence (like RSI or MACD divergence)
Quality over quantity is what leads to long-term profitability.
Final Tip
Even the best setups will lose sometimes.
But by avoiding these simple mistakes, you’ll dramatically increase your accuracy, protect your capital, and build confidence in the strategy.
Why This Strategy Works (And Keeps Working)
Let’s break down why the triple top and triple bottom strategy works so well, especially when combined with smart risk management and confirmation tools.
This isn’t just another chart pattern it’s a strategy rooted in market psychology, tested price behavior, and solid trade logic. Here’s why it consistently delivers results:
🧠 1. It Rides a Psychological Tipping Point
At the heart of this setup is human behavior.
When price tests the same resistance or support level three times without breaking through, it sends a strong signal:
“This level is too strong.”
- For a triple top, buyers try to break resistance once… then again… and finally a third time.
By the third attempt, they’re often exhausted, and sellers take over. - For a triple bottom, it’s the sellers who run out of steam after multiple failed breakdowns.
Buyers step in with confidence creating a clear, tradable reversal.
This repeat failure at the same level reflects real supply and demand shifts, making it more than just a visual pattern it’s a psychological turning point.
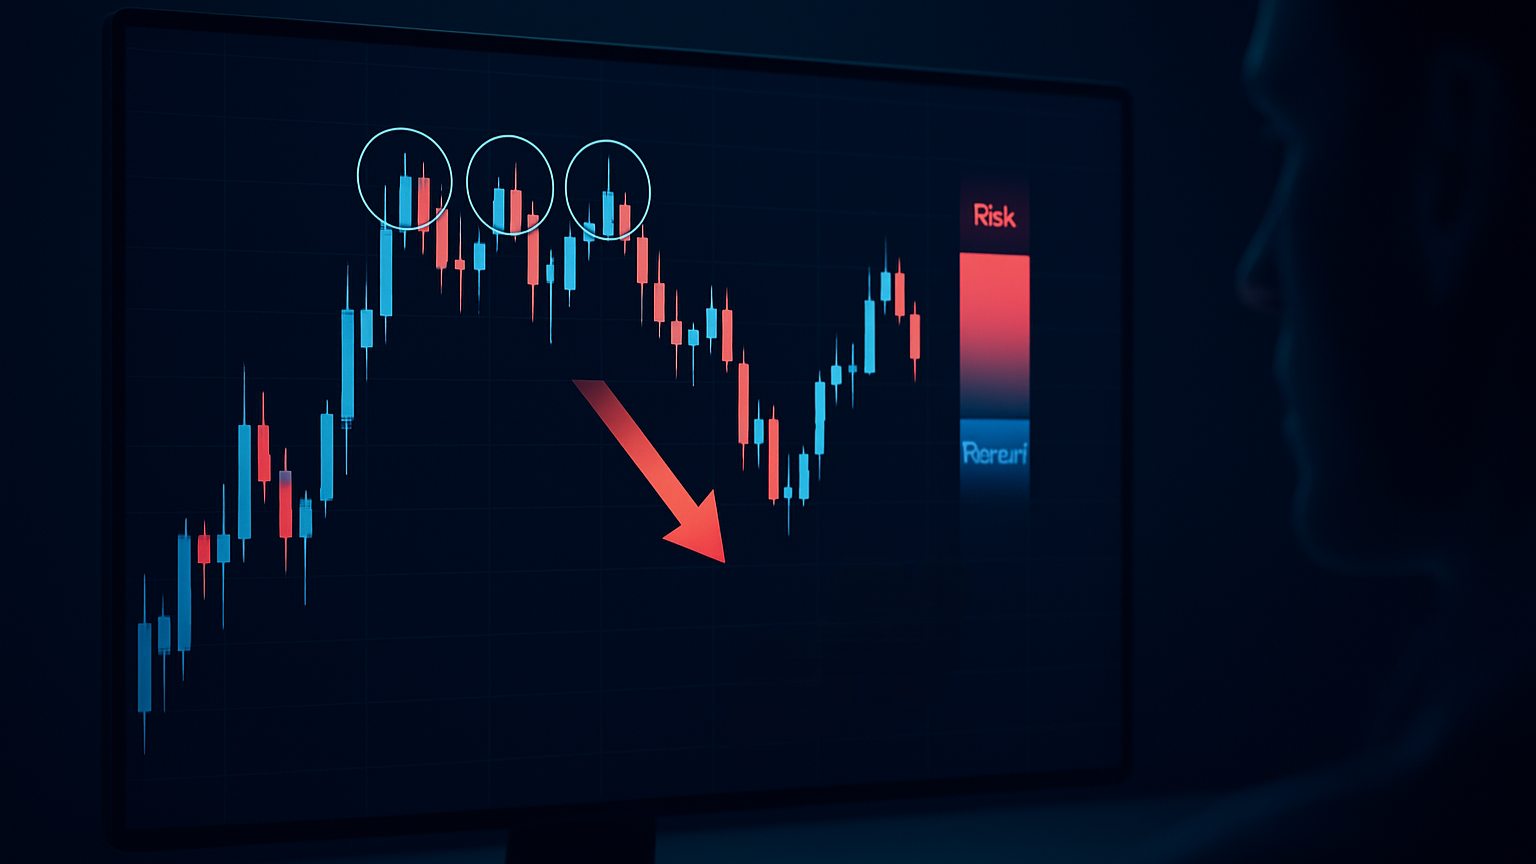
🎯 2. It Uses a Built-In Risk-Reward Edge
The strategy enforces a minimum 1:2 reward-to-risk ratio. That means:
- If you risk 30 pips, you aim for at least 60 pips in return.
- Even if you win only 40% of the time, you’re still profitable.
This approach protects your capital and lets winners run, which is essential in any successful trading system.
You’re not relying on being right all the time you’re using math and risk management to your advantage.
✅ 3. It Filters Out 80% of Weak Setups
A big reason traders fail with chart patterns is they trade every single one they think they see.
This strategy is different. You apply a simple, 3-part confirmation checklist before every trade:
- Is the pattern complete (third touch confirmed)?
- Is there momentum divergence (RSI or MACD)?
- Is there no high-impact news coming soon?
Only trading when 2 out of 3 boxes are checked helps you avoid:
- Fakeouts
- Rushed entries
- News-based volatility
This extra layer of discipline filters out most of the noise while still catching the best, high-probability setups.
🧩 4. It’s Built for Simplicity and Repetition
There are no complex indicators. No black-box logic. Just clean structure, a few rules, and real price behavior.
It’s a system you can:
- Learn once
- Apply every day
- Improve over time with experience and journaling
It also fits into any trading style scalping, day trading, or swing trading because it focuses on price structure and confirmation, not time-based signals.
Final Word
This strategy works because it’s grounded in real market dynamics not just theory. It respects price action, uses smart confirmation, and protects your capital with disciplined risk rules.
Combine that with the free MT4 indicator coming up next, and you have a system that’s not only powerful but easy to follow and repeat.
Triple Top/Bottom Patterns Indicator for MT4 (Free Download)
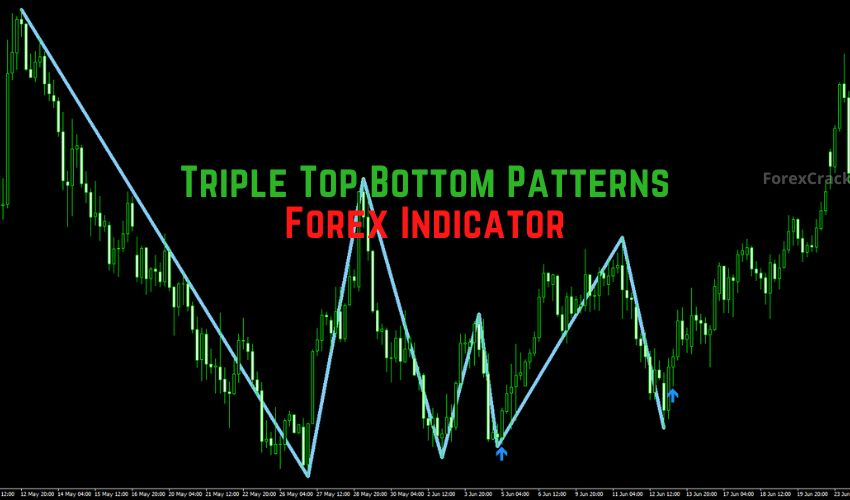
Want to simplify the entire strategy? This free MT4 indicator does the heavy lifting for you. It automatically scans your charts and marks confirmed triple tops and bottoms so you don’t have to spot them manually.
Key Details
- File:
TripleTopBottomPatterns.ex4 - Signals:
- Green ↑ = triple bottom (buy)
- Red ↓ = triple top (sell)
- Timeframes/Pairs: Works on all pairs and any timeframe
- Repainting? No—signals stay once confirmed
- Cost: 100% free (from ForexCracked)
Why Use It
- No guesswork – Signals appear only after full pattern confirmation
- Non-repaint – Great for back-testing and live trades
- Perfect learning tool – Helps train your eye to spot clean setups
- Works for all traders – Scalping, day trading, or swing
How to Install
- Download the ZIP (links below)
- MT4 → File → Open Data Folder → MQL4 → Indicators
- Drop in the
.ex4file - Restart MT4 or refresh Navigator
- Drag the indicator onto your chart
💡 Want alerts? Wrap it in a simple EA using
SendNotification()to get trade signals on your phone.
Simple. Powerful. Free. This tool takes the triple top/bottom strategy to the next level especially when used alongside the steps you’ve already learned.
Frequently Asked Questions (FAQs)
1. Does this strategy work on gold, crypto, or indices?
Yes. Triple top and bottom patterns are based on price behavior, not the asset type. Just adjust your stop-loss size to match the volatility of instruments like gold or Bitcoin.
2. How many trades can I expect per week?
On a pair like EUR/USD using the H1 chart, you can expect 4–8 clean setups per week. Scalpers using M5–M15 and multi-pair watchers can see more.
3. Can I automate the entire strategy?
Yes. The indicator can be integrated into a custom Expert Advisor (EA) that automates entries, SL, TP, and risk per trade.
4. Is this strategy beginner-friendly?
Absolutely. It’s based on simple price action, clear structure, and minimal indicators. The free MT4 tool makes it even easier by visually marking patterns after confirmation.
5. Does the indicator repaint or change signals after the fact?
No. Once a signal appears, it stays locked. It only prints after the third touch is confirmed, so it’s fully back-testable and reliable.
6. What’s the best timeframe to trade this on?
It works on all timeframes.
- Scalpers do best on M5–M15
- Swing traders will prefer H1, H4, or Daily
Use the timeframe that fits your trading style and availability.
Quick Recap & What to Do Next
To wrap things up, here’s a quick checklist to help you start using this strategy effectively:
- ✅ Spot a clear triple top or bottom or let the free MT4 indicator identify it for you
- ✅ Confirm the setup with momentum divergence and check for upcoming news events
- ✅ Execute with a proper stop-loss, at least a 2:1 reward-to-risk ratio, and 1% risk per trade
- ✅ Track your performance by journaling at least 50 trades your own stats will be your best teacher
Now it’s your turn.
Download the indicator, load it on your charts, and test the strategy on a demo account this week. See how it performs. Refine it. Build your confidence.
And when you’re ready, join the conversation follow ForexCracked on Telegram for weekly trading blueprints, new tools, and real-time insights.