
Never Again Will You Have To Spend Hours Manually Drawing and Deleting Fibonacci Levels on Your Charts. The Problem is that Very Few know How to Draw Fibonacci Lines the right away – Fibonacci Golden Zone Indicator will Stop this Madness Once and For All!!
Have you ever tried to throw on Fibonacci lines on your charts but just had no idea what you were doing?
Or worst yet, you have no idea what Fibonacci line you need to analyze to make a trade? Trust us, our team struggled with these sorts of things for a long time years ago when we first started to trade the markets…
We heard all these great things about Fibonacci and how all of the big traders are constantly analyzing these zones and moving the markets with over 80% accuracy at these zones but we just had no idea where to start.
We saw people now for many years giving bad information, bad strategy advice, and awful fibo analysis because they just do not understand the true power of the Fibonacci Retracement.
Many, many traders continue to struggle using the Fibonacci Drawing tool and know exactly what this means.
Our system is now completed to help every market trader put an end to struggling with knowing where to place fibos, how to place them, and most importantly the best Fibonacci Strategy Backed behind this winning system.
- Visit Official Website For More Info About Indicator – HERE
The Fibonacci Golden Zone are some things that only a few traders know anything about…In fact, the 38.2, 50, 61.8 lines have all been proven to be the simplest retracement lines to use with the Fibonacci Indicator.
And Better yet…Most professional traders / Big Bank Traders use Fibonacci as their primary tool to analyze price reversal and retracement zones. Most of you have already read or had in possession of this Fibonacci Golden Zone Strategy we offer completely free for all traders!
This indicator covers all of the untold power of the Fibonacci sequence in the strategy like, what each fibo line represents, what to do if there is no retracement of the trend, and where your fibo lines should be going, and so much more. We Highly Recommend you to read and study the strategy.
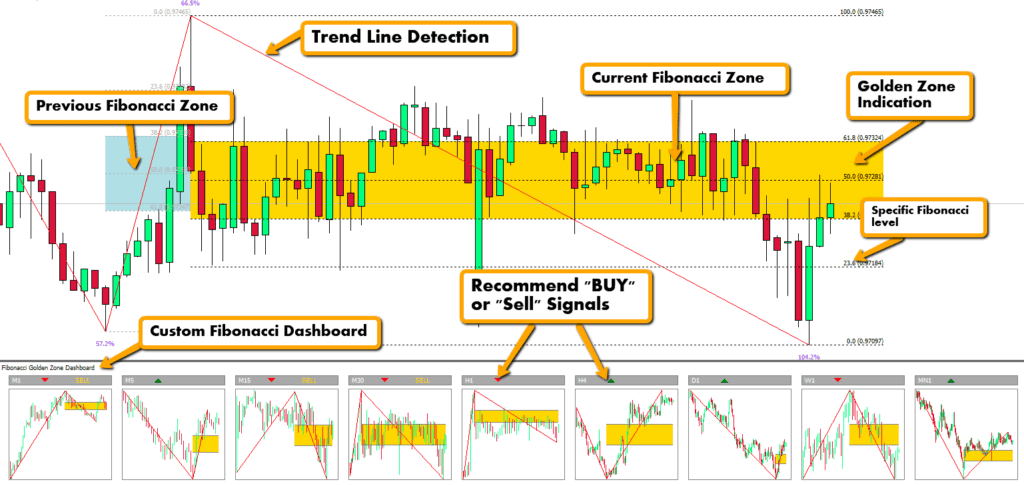
Trend Lines
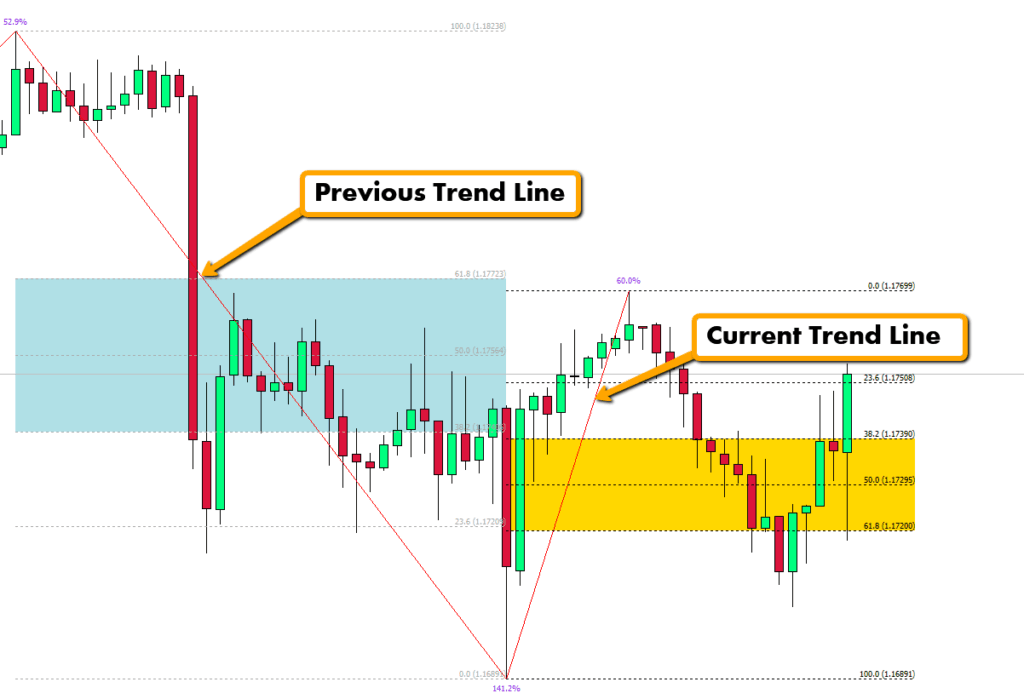
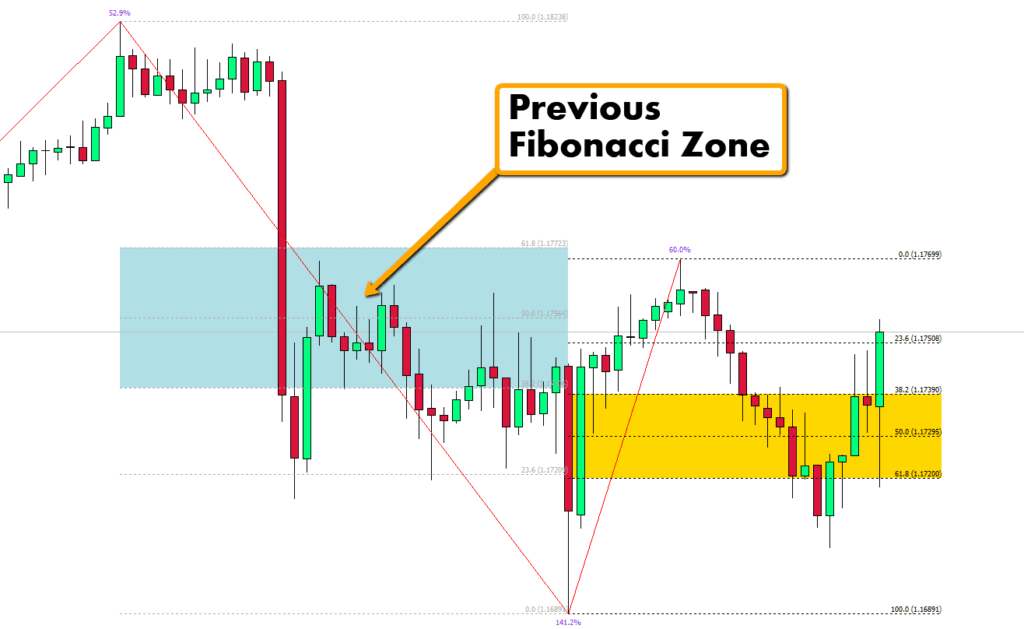
The Fibonacci Golden Zone Indicator also shows you the previous Fibonacci Zone because these lines are still valid.
All other Fibonacci Indicators will not show you this, but we know how important it was based on the strategy which is why we added this feature into this indicator.
Previous Fibonacci Zone
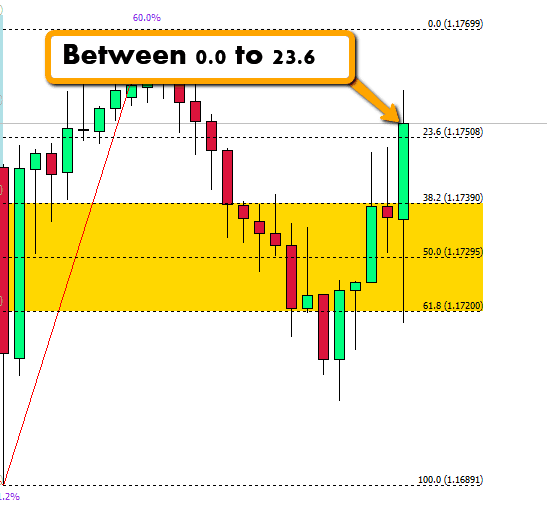
You will also see the exact Fibonacci Level the current price action is located.
Current Fibonacci Level
The above features are great, but One of the most powerful tools that is implemented into this system is the Fibonacci Custom Dashboard.
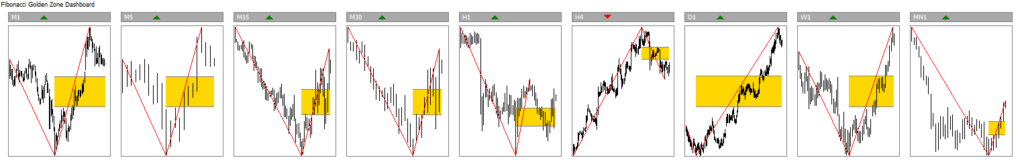
You can see a small chart image for each time frame with this dashboard with the Fibonacci Indicator attached…
So that means you can see where the exact price action is from an M1 time chart all the way up to a Monthly chart. That can be the difference between a winning trade and a losing trade since you know exactly where the price action is on all of these time frames!
Multiple time frame analysis is very important to analyze with every trade, so this custom dashboard makes it that much easier to do than ever before!
You just heard all of the unique features but we want to break it down even further and show you why having an automated Fibonacci Indicator is better than manually implementing Fibonacci lines on your charts.
Not working.. Has anyone tried to upload this to MT4?
i tried and it does’t work neither.
Admin can you please fix it? I have touched some parameters, but it still comes out blank. the template works, but the indicator doesn’t appear.
Thanks for your hard work.
Its work like charm.. but little bit confusing to use this..
It works. Thanks.
Wao this works like magic i use the 1H time frame and the indicator actually predicts where price is going to. wao thanks ADMIN for this.
Guy this thing actually works
not working
can you plz tell me how you made it working ?
The indicator is not attached to the template – no idea why they provide templates that include the indicator attached.
Just manually attached the 2 indicators to your chart and save over the current template. Or use this template.
Fibonacci Golden Zone Strategy
Thanks for sharing this great indicator!
On MT5, it’s only the “Fibonacci Golden Zone DashBoard” that works, the seconde one doesn’t work.
Not working on MT5.
Probably one of the best indicators i have seen on this forum, thanks for sharing.
working perfectly on MT4
Does not work on MT5 . Any ideas ?
In mt5 only dashboard works. Please fix.