

If you want clearer momentum signals and less noise in your trades, this guide will help you unlock the real power of the Double Stochastic RSI Strategy. This indicator goes beyond a standard Stoch RSI, giving you cleaner reversal signals, stronger confirmation, and better timing during both trends and pullbacks. In this strategy breakdown, you will learn how it works, how to filter out weak setups, and how to combine it with price structure and trend bias for high quality entries.
Table of Contents
What Is the Double Stochastic RSI?
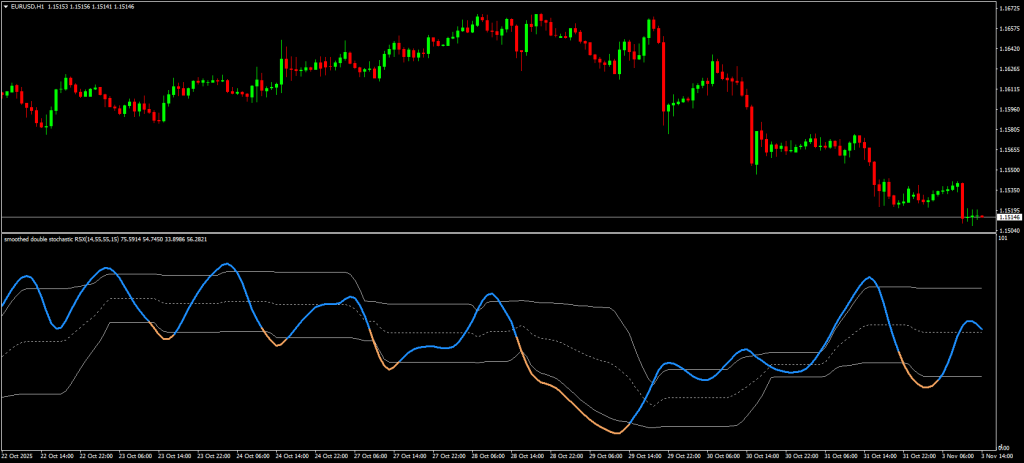
The Double Stochastic RSI combines the strength of RSI trend reading with the sensitivity of the Stochastic oscillator. Instead of reacting to every tiny price move, it smooths the momentum data and highlights true overbought and oversold zones. This makes it easier to spot where price is likely to reverse or pull back.
Why Traders Use It
Compared to a regular StochRSI, the double layer logic filters more noise and provides cleaner signals. On MT4, the ForexCracked version locks signals after candle close, which helps reduce false alerts and keeps entries more reliable chart analysis.
Key Idea Behind It
Standard StochRSI measures momentum using RSI values and typically reacts around the 0.80 / 0.20 zones. The double version builds on that concept by refining those signals, giving traders sharper timing and better confirmation when momentum shifts.
Best Settings and Market Conditions

Where This Indicator Performs Best
The Double Stochastic RSI Indicator works across Forex, indices, and crypto, making it a versatile tool for most traders. It performs well in both trending and ranging markets as long as price structure is respected. The key idea is simple: use the indicator to spot momentum shifts, and use price levels to confirm those shifts are meaningful.
Optimal Timeframes for Cleaner Signals
For consistent, reliable signals, stick to the H1, H4, and Daily charts. These higher timeframes smooth out market noise and make reversal signals clearer.
Lower timeframes like M5 or M15 are still possible, but expect more noise and false moves meaning patience and discipline become far more important.
Best Tools to Pair With It
This indicator becomes stronger when combined with simple market logic rather than heavy indicator stacks. Useful companions include:
- Support and resistance zones (to confirm real turning points)
- EMA 100/200 (to understand the trend bias)
- Volume or strong candle signals (to see real market participation)
Keeping things simple improves clarity and avoids overthinking a setup.
Signal Stability and Repainting
The MT4 build available locks signals after the candle closes, so what you see after confirmation remains consistent. Always wait for candle close confirmation this helps avoid impulsive entries and ensures you’re trading a validated signal, not a temporary spike.
Core Trading Rules: Confirm These 3 Signals Before Entering
1. Momentum Shift From Extremes
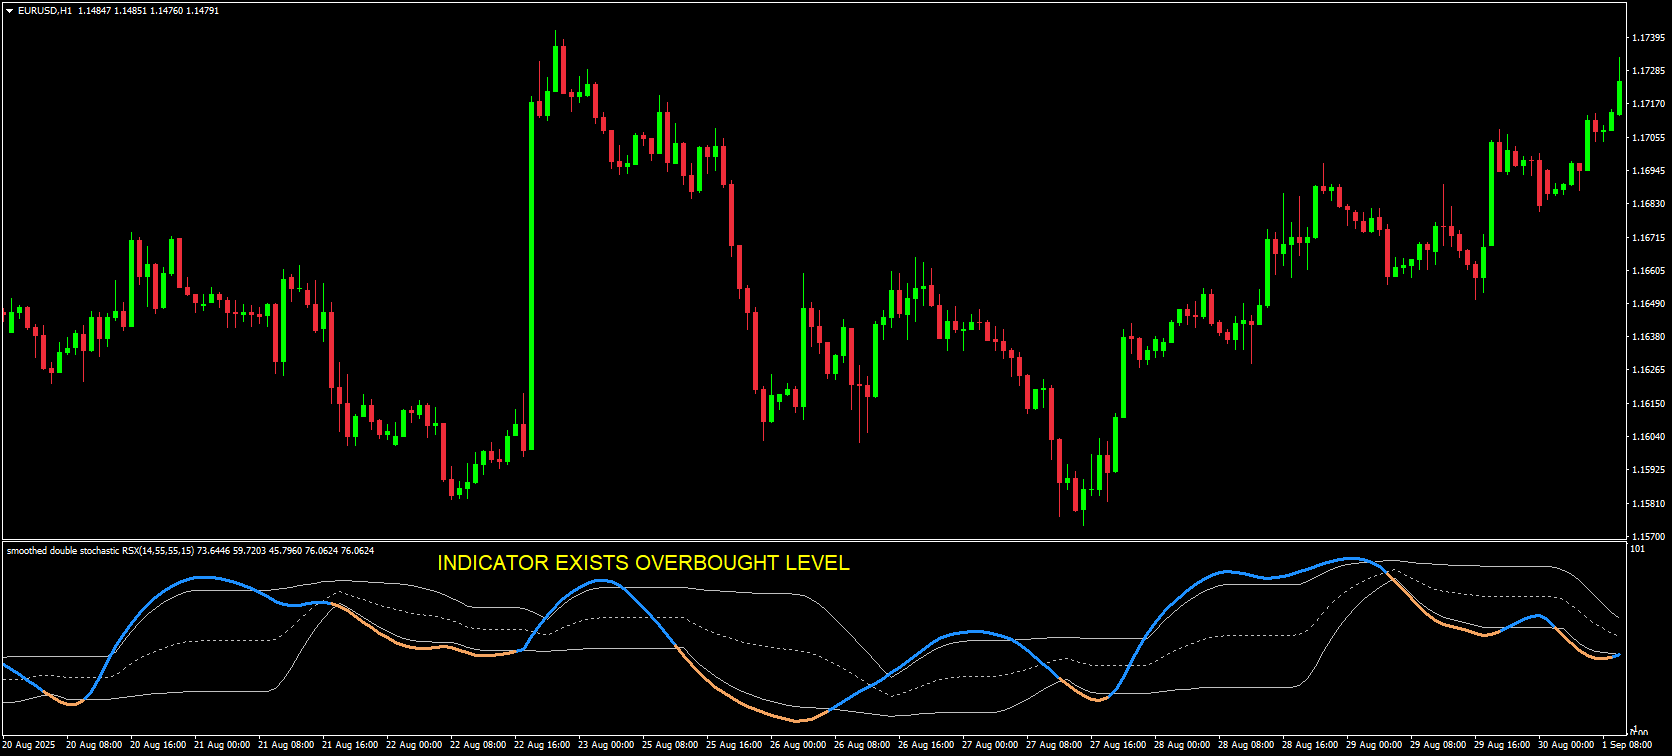
You only want to enter when momentum truly turns – not just when the line touches an extreme.
- Buy signal: Indicator exits oversold and slopes upward
- Sell signal: Indicator exits overbought and curves downward
This confirms buyers or sellers are stepping in, reducing the chance of catching a fake bounce. Think of it as waiting for the market to show you the turn instead of guessing it.
2. Price Structure Alignment
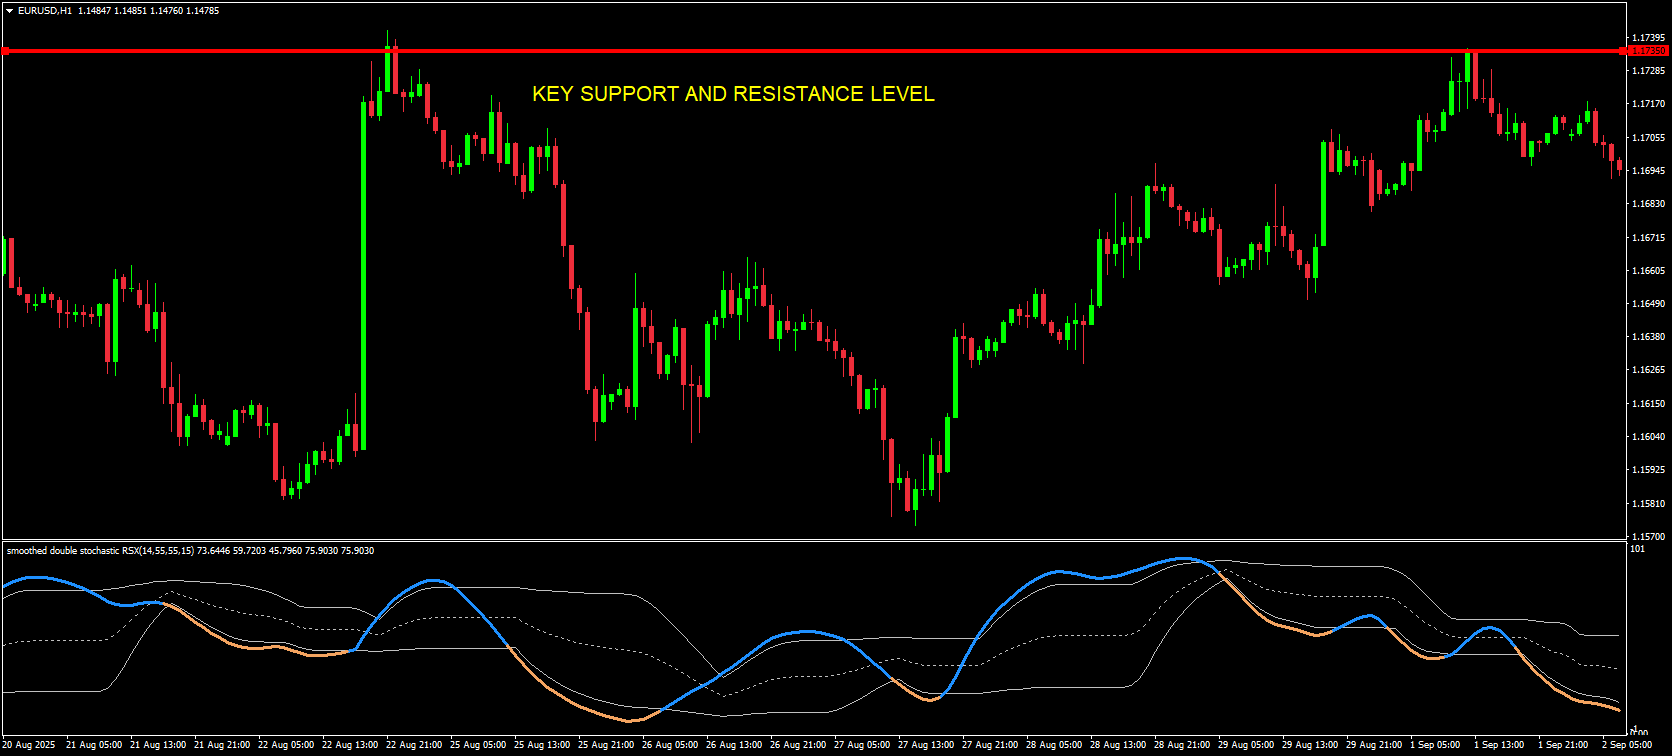
Momentum alone is not enough. Price must respect a meaningful level.
Look for:
- Previous swing highs or lows
- Key support or resistance zones
- Breakout and retest patterns
If price reacts at a known level, the indicator signal becomes far more reliable. This keeps you out of random oscillator flips in the middle of nowhere and focuses you on logical reaction points.
3. Trend or Strength Confirmation
A momentum shift at a level is good. But confirming strength improves accuracy.
Use one of these filters:
- Trend: Long above EMA 100/200, short below them
- Strength: Strong rejection candle, engulfing pattern, or rising volume
This ensures you are trading in the flow of the market, not against it. When direction and strength align, setups become cleaner and trades tend to move faster and smoother.


Download a Collection of Indicators, Courses, and EA for FREE
How to Enter and Manage Trades For Double Stochastic RSI Strategy
Long Setup (Buy Strategy)
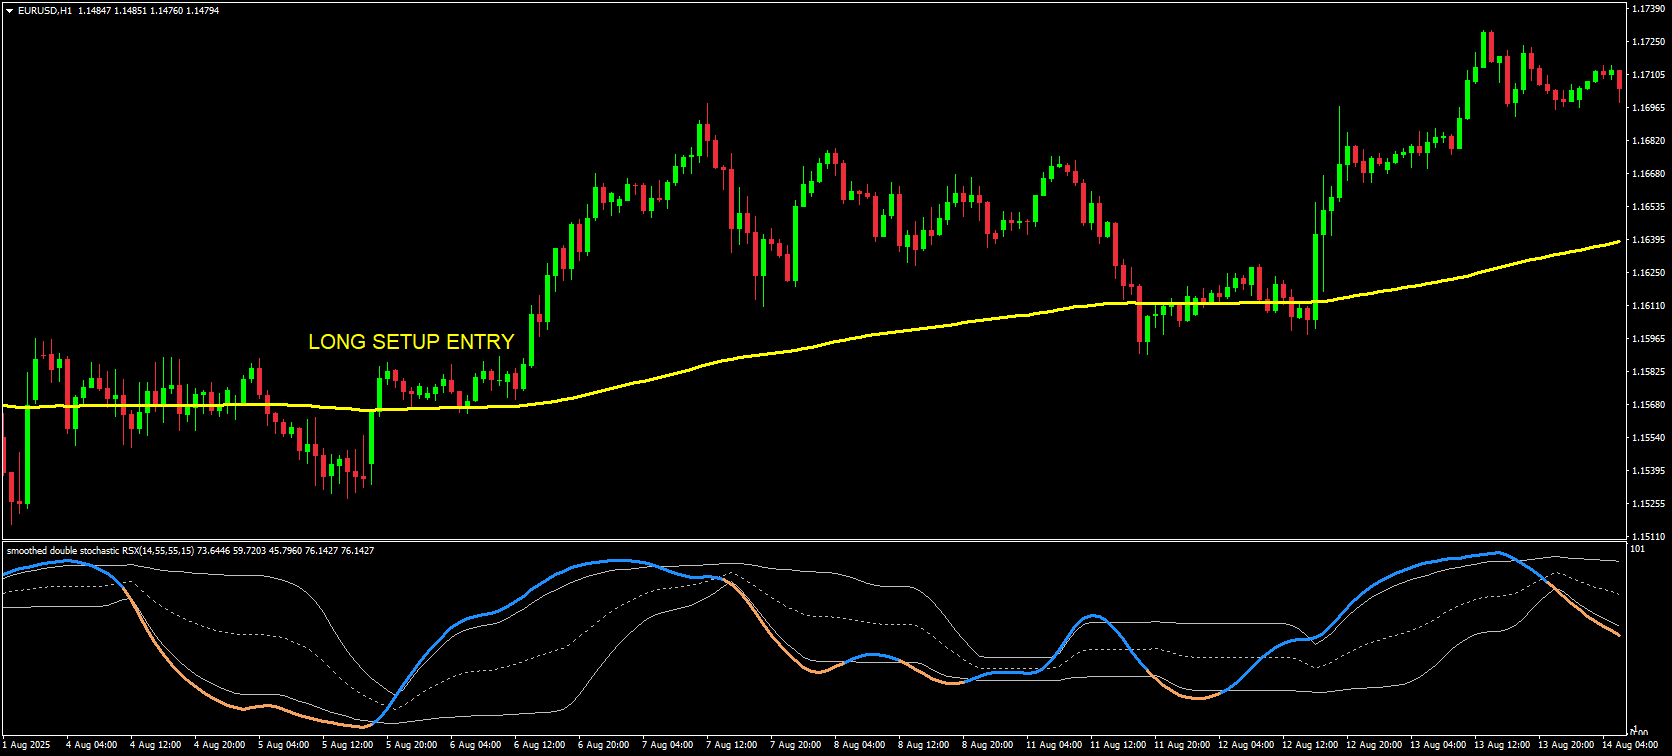
The goal here is to catch momentum turning upward at the right location, not just when the indicator flicks oversold.
Conditions
- Double Stochastic RSI exits oversold and curves upward
- Price trades above EMA 100/200 or reclaims a major support level on a retest
- Market shows bullish intent (strong candles, rejection wicks, or higher-low forming)
Entry Trigger
- Enter after the confirmation candle closes
- Or enter on a controlled retest wick into support if momentum holds
This avoids jumping early and lets the chart prove buyers are stepping in.
Stop-Loss
- Set below the most recent swing low
This cushions noise and protects against failed breakouts.
Take-Profit Plan
- First TP at the next key resistance
- Let the remaining position trail using swing lows or a moving average
- Close if the indicator gives a full opposite exit signal
You are aiming for a clean move, not every tick. Structure + momentum decides the exit.
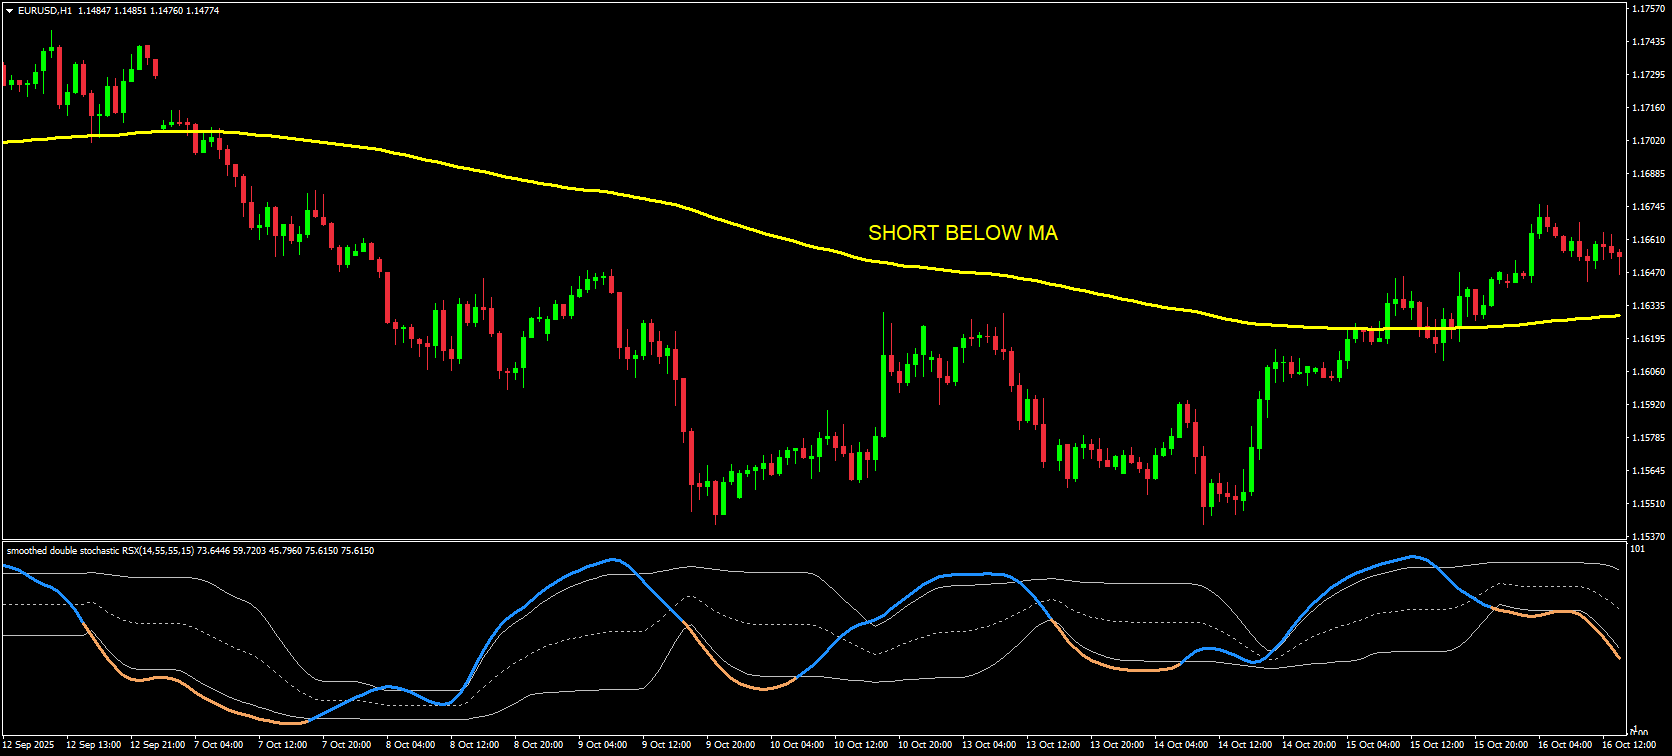
Short Setup (Sell Strategy)
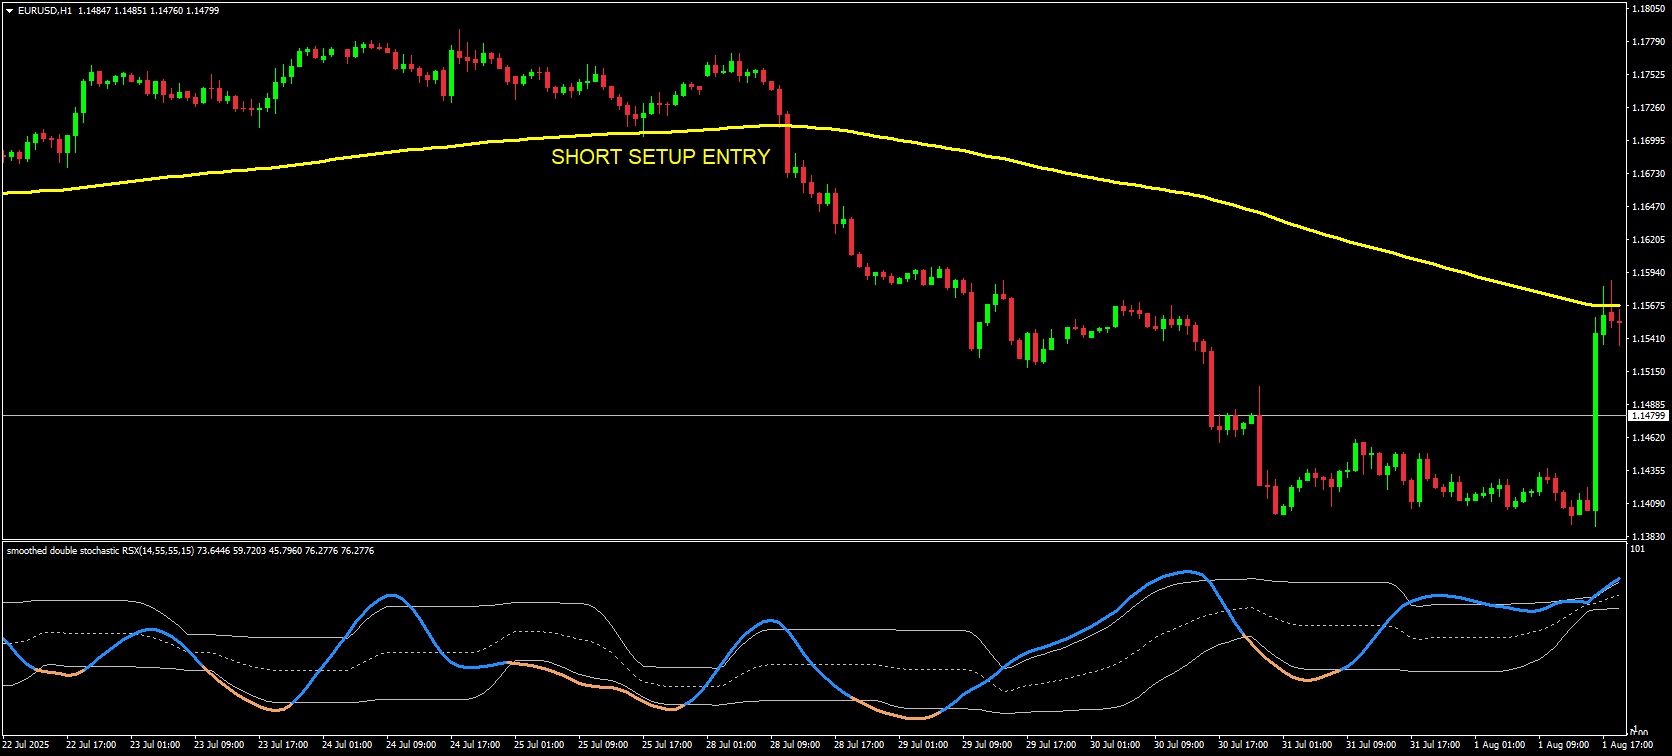
Same concept flipped catch momentum rolling down from strength into weakness.
Conditions
- Double Stochastic RSI exits overbought and curls downward
- Price sits below EMA 100/200 or rejects a key resistance
- Bearish candle behavior (rejections, engulfing bars, lower-high forming)
Entry Trigger
- Enter after the confirmation candle closes
- Or enter on a flip-back retest into resistance
This confirms sellers are taking control instead of reacting to one indicator spike.
Stop-Loss
- Above the most recent swing high
Take-Profit Plan
- First TP at the nearest support zone
- Trail runner as long as price keeps forming lower highs and indicator stays bearish
The idea is to ride momentum while price respects structure.
Smart Filters for Cleaner Signals
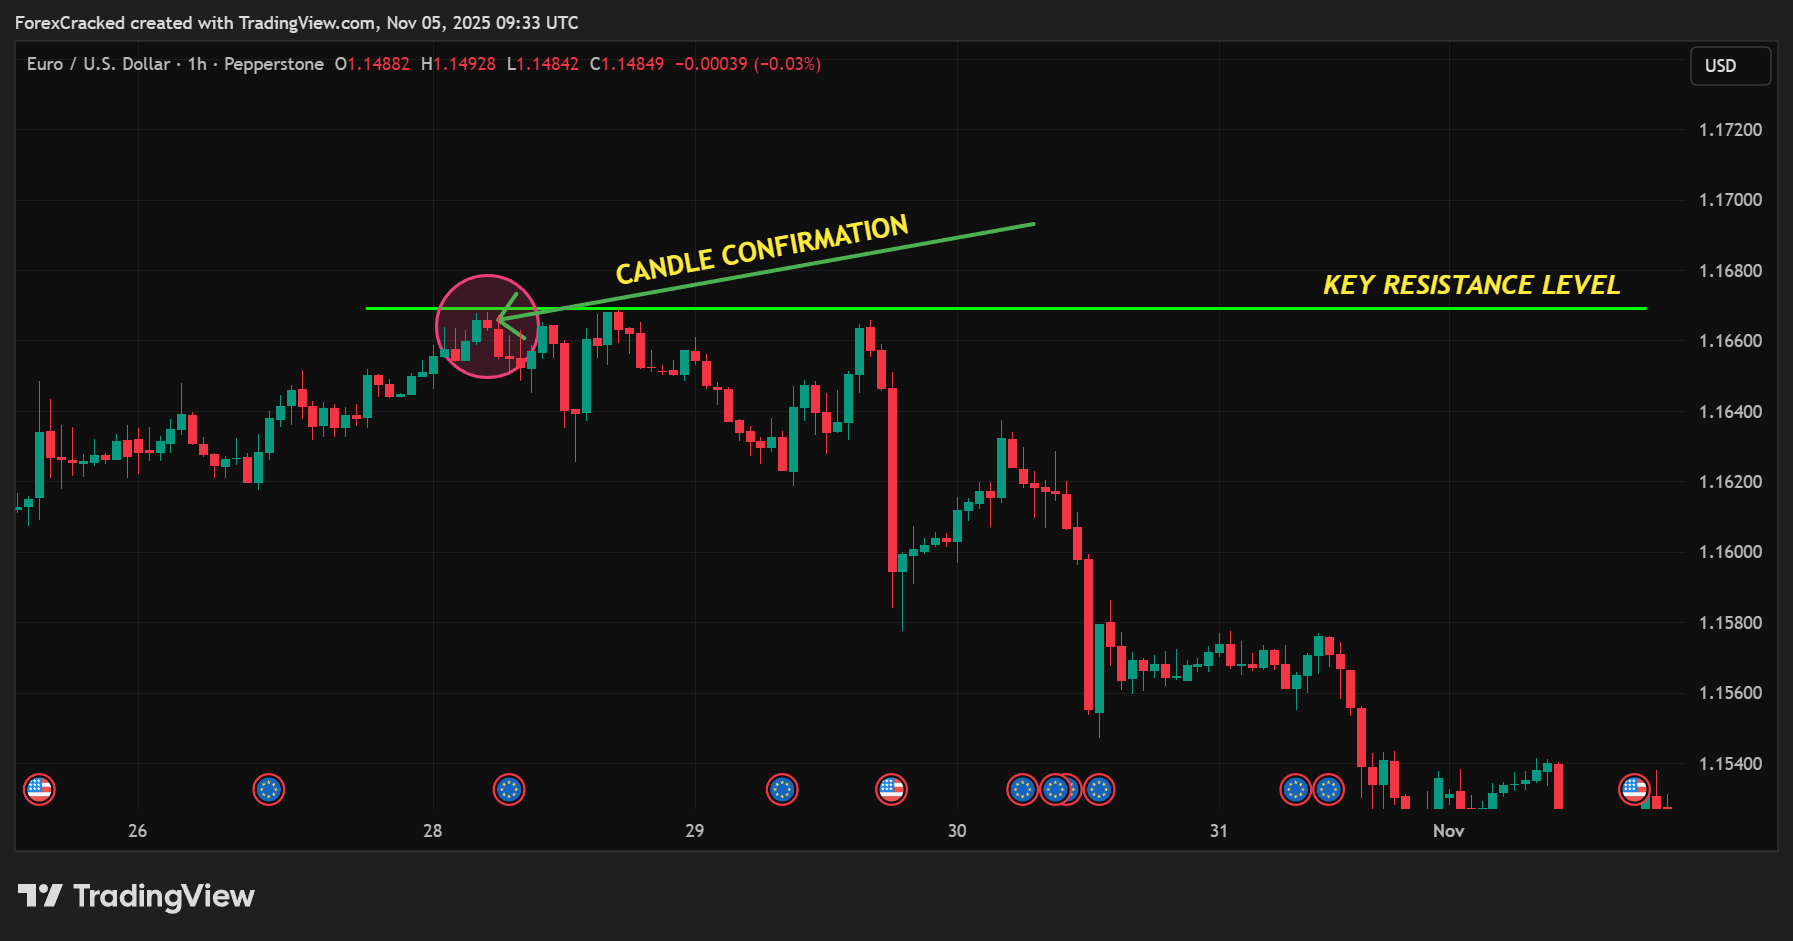
These filters improve accuracy and keep you from forcing trades:
- Candle confirmation – engulfing bars, pin bars, long wicks at key levels
- Trend filter – only trade with market direction in clean trends
- Range logic – in ranges, rely more on support/resistance confluence
- Divergence check – momentum weakening before price turns strengthens the reversal case
These rules eliminate most low quality signals.
When to Avoid Trading
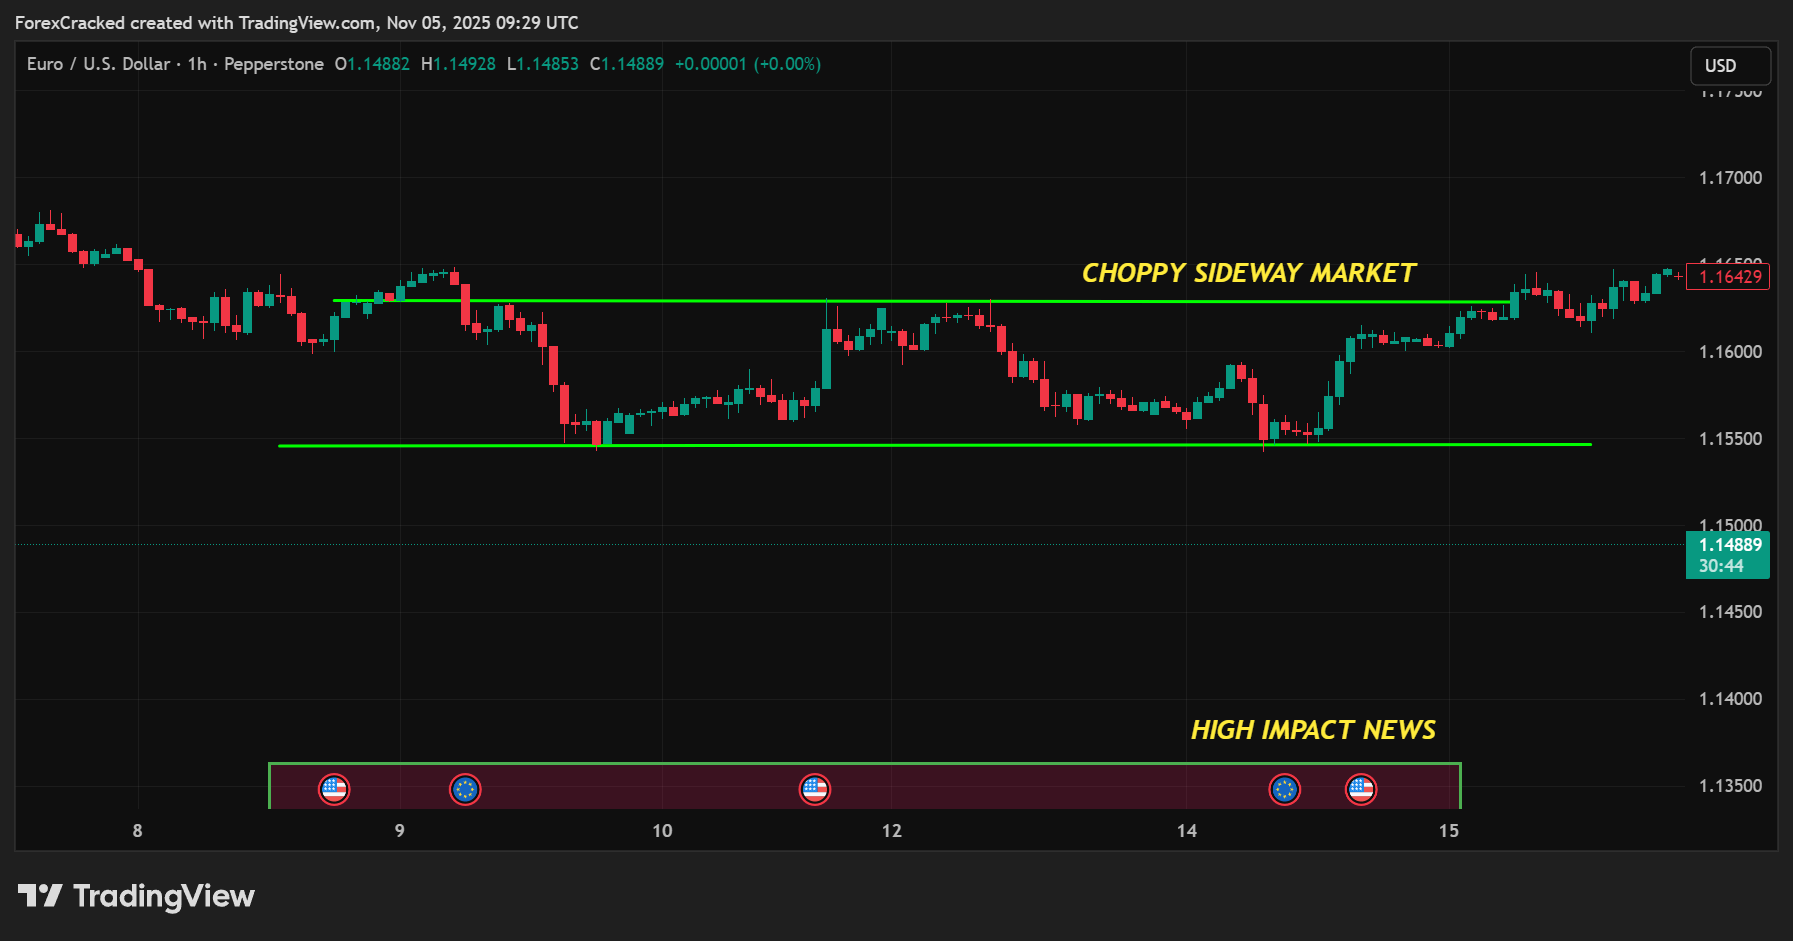
Not every indicator swing is trade-worthy. Skip setups when:
- Market is in choppy sideways price with no structure
- High-impact news is pending or just released
- Signal goes against major trend without strong levels supporting the idea
Good trading is not only entering smart it is knowing when to stay flat and protect capital.
Real World Chart Examples
Break and Retest Long
Price breaks above resistance → pulls back → indicator exits oversold while holding new support → enter long → stop under retest low.
This stacks momentum + structure + confirmation.
Trend Continuation Short
Price is below EMA 200 → bullish pullback into resistance → indicator leaves overbought and turns down → enter short → trail until momentum shifts.
Classic trend trade with a precision trigger.
Risk Management For Double Stochastic RSI Strategy

Control Risk on Every Trade
Momentum tools like the Double Stochastic RSI give frequent signals, so risk control is non-negotiable. A practical range for swing traders is 0.5%–1% risk per trade. This lets you take multiple quality setups without letting one loss derail your account.
Lock in Safety Once You’re Right
When price moves 1R in your favor (meaning you’ve earned what you risked), move your stop-loss to breakeven. This protects your capital and removes emotional stress while still giving the trade room to breathe. You are now playing with market money, not your own.
Manage Profits With Logic, Not Emotion
Use structured exits to balance safety and growth:
- Take a partial profit at the first key support or resistance
- Let the remaining position run by trailing below swing lows (for buys) or above swing highs (for sells)
- A moving average trail works well in trends
This approach locks in profit while staying open to bigger trend moves instead of cutting winners too early.
Why This Matters for This Strategy
Oscillator based systems can fire multiple signals in fast or choppy markets. Strong risk rules protect your account during sideways periods and maximize gains when momentum flows cleanly. Steady execution here often makes the difference between inconsistent results and long-term profitability.
FAQs
u003cstrongu003eDoes Double Stochastic RSI repaint?u003c/strongu003e
No after candle close, per the MT4 build referenced. Trade on closed bars.
u003cstrongu003eWhat thresholds should I use?u003c/strongu003e
Treat 80/20 as practical StochRSI extremes. Focus on u003cstrongu003eexitsu003c/strongu003e from extremes and confluence, not raw overbought/oversold.
u003cstrongu003eBest timeframe?u003c/strongu003e
H1–D1 for cleaner signals; M15–M30 possible if you add stricter filters.
u003cstrongu003eWhich confirmations work best?u003c/strongu003e
S/R, EMA trend alignment, and volume/candle strength.
u003cstrongu003eWill it work across assets?u003c/strongu003e
Yes. FX, indices, crypto are supported. Always validate with structure and risk controls.
Conclusion
Double Stochastic RSI gives you a clean way to spot momentum exhaustion and time entries with precision. It works best when you treat it as a confirmation tool, not a solo signal. Combine it with structure, trend bias, and disciplined risk management, and always wait for candle closes before acting. With the right filters, this indicator can turn uncertain reversals into structured, high-probability setups you can follow with confidence.