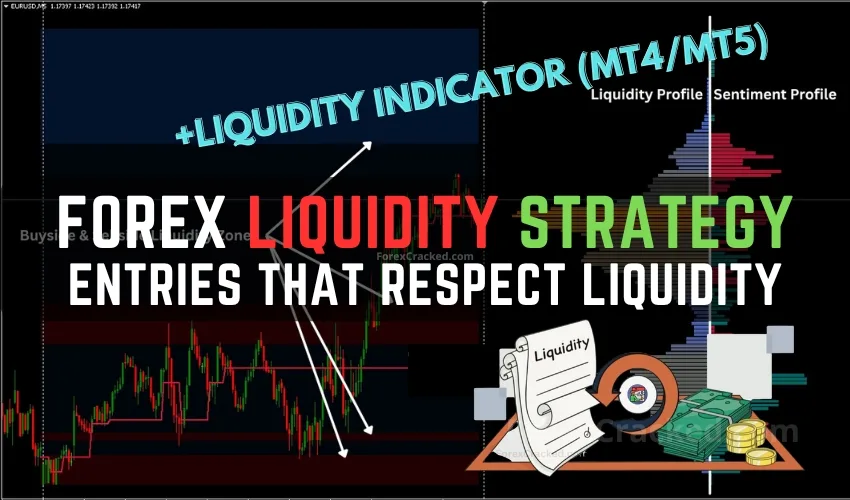
When you’re trading Forex, it’s not just about reading candles or chasing trends it’s about understanding where the money hides. That’s where the Forex Liquidity & Market Sentiment Indicator (MT4/MT5) comes in. This tool transforms raw price and volume data into a visual “map” of liquidity zones and trader sentiment, helping you spot where the smart money may hide stops or force reversals.
In this article, you’ll learn:
- What liquidity and sentiment really mean in Forex markets
- How this indicator reveals POC, value areas, and hidden liquidity pools
- Three clear, high-probability setups built around sweeps, rejections, and breakouts
- Risk rules, trade management, and how to backtest your edge
- Real-world tips so you can start applying this in your demo or live charts
Whether you’re a newbie curious about advanced tools, or a trader wanting to sharpen your edge, this guide walks you step by step. Let’s dive in and turn those invisible zones into your trading advantage.
Table of Contents
Why Liquidity & Sentiment Matter in Forex Trading
In Forex, price doesn’t move randomly it moves toward liquidity. Every major swing, breakout, or reversal happens where a cluster of orders sits. The Forex Liquidity & Market Sentiment Indicator helps you see those invisible zones by mapping out where trading activity and trader psychology overlap.
One side of the profile displays liquidity distribution showing how much volume traded at each price level. The other side reflects market sentiment, revealing whether traders were more aggressive on the buy or sell side. By anchoring the indicator to a specific period (like the London or New York session, or the previous trading day), you get a clear snapshot of how the market structure evolved during that window.
Unlike simple moving averages or oscillators, this indicator doesn’t predict direction. Instead, it provides context showing where smart money might enter, defend, or exit positions. When you combine it with a rules-based strategy, it becomes a powerful tool for identifying value areas, liquidity traps, and high-probability trade zones.
At the heart of the profile is the Point of Control (POC) the price level where the most trading volume occurred. Think of it as the market’s “fair price” or a magnet that price often gravitates toward after imbalances. Surrounding it is the Value Area, the range where roughly 70% of trading took place. Traders use these zones to anticipate whether price will revert to value or break away into new territory.
In simple terms:
- Liquidity tells you where the orders are.
- Sentiment tells you who’s winning buyers or sellers.
- Together, they tell you what’s likely to happen next.
By reading liquidity and sentiment together, you’re no longer guessing. You’re watching the market’s behavior where it truly matters at the price levels where traders commit their money.
Strategy Overview: Turning Liquidity & Sentiment into Clear Trade Setups

The Forex Liquidity Strategy isn’t just another chart overlay it’s a complete market map showing where traders are positioned and how the crowd is feeling. Used correctly, it helps you spot smart money footprints and align with institutional order flow rather than getting trapped by fake breakouts.
This strategy works best on high-liquidity instruments like EURUSD, GBPUSD, and XAUUSD, where order flow and sentiment data are more reliable. It performs particularly well during the London and New York sessions, when trading activity peaks and liquidity is deepest.
Recommended timeframes:
- M15–H1 → for scanning setups and confirming structure.
- M5 → for refining entries with precision and tighter stops.
Building Your Chart Template
To get consistent results, start with a clear, structured chart setup:
- Anchor period: Set to session open (London or NY) or the previous day’s start.
- Liquidity (right side): Displays the distribution of traded volume across price levels.
- Sentiment (left side): Shows whether buying or selling pressure dominated at each level.
- POC & Value Area lines: Highlight where most trading occurred — crucial for entries, exits, and reversion points.
- LVNs (Low Volume Nodes) and HVNs (High Volume Nodes):
- LVNs mark thin, low-liquidity zones where price may accelerate quickly.
- HVNs are dense clusters where price tends to stall or reverse.
Together, these elements give you a 3D view of the market showing both where liquidity sits and how traders are behaving around it.
The Three Core Setups
1. Liquidity Sweep Reversal + Sentiment Flip
Concept:
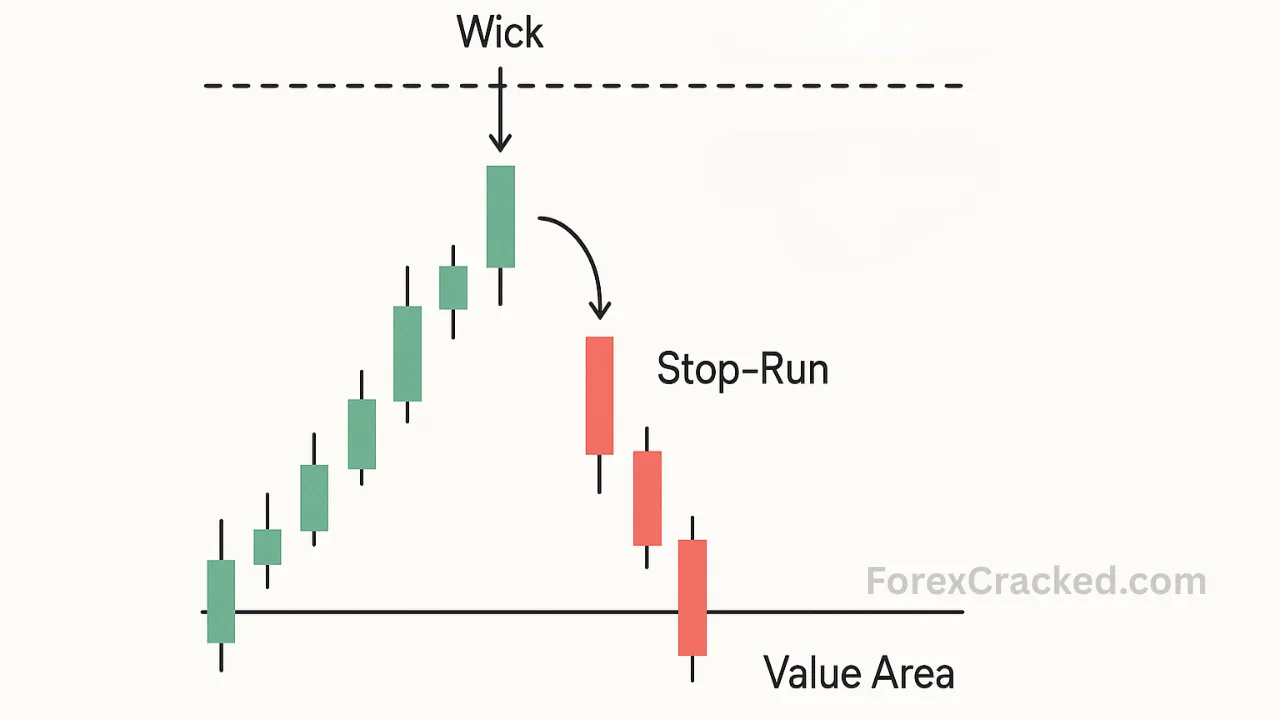
When price reaches a well-known liquidity pool (like equal highs/lows or the previous day’s high/low) and wicks beyond it, it often triggers stop orders before reversing. If sentiment weakens in the breakout direction and price closes back inside the value area, it signals the stop-run is complete and a reversal is likely.
Rules:
- Mark buy-side and sell-side liquidity zones equal highs/lows and session extremes.
- Wait for a sweep candle that takes the liquidity and snaps back inside range.
- Confirm a sentiment flip: buying weakens after a sweep of highs, or selling weakens after a sweep of lows.
- Entry: On the retest of the swept level.
- Stop-loss: Beyond the sweep wick.
- Targets:
- TP1: Point of Control (POC).
- TP2: Opposite value edge or next HVN.
Why it works:
Liquidity sweeps fill institutional orders by triggering retail stops. Once the big players are filled, price often reverts toward fair value (POC) before its next move.
2. POC Rejection Mean-Reversion
Concept:
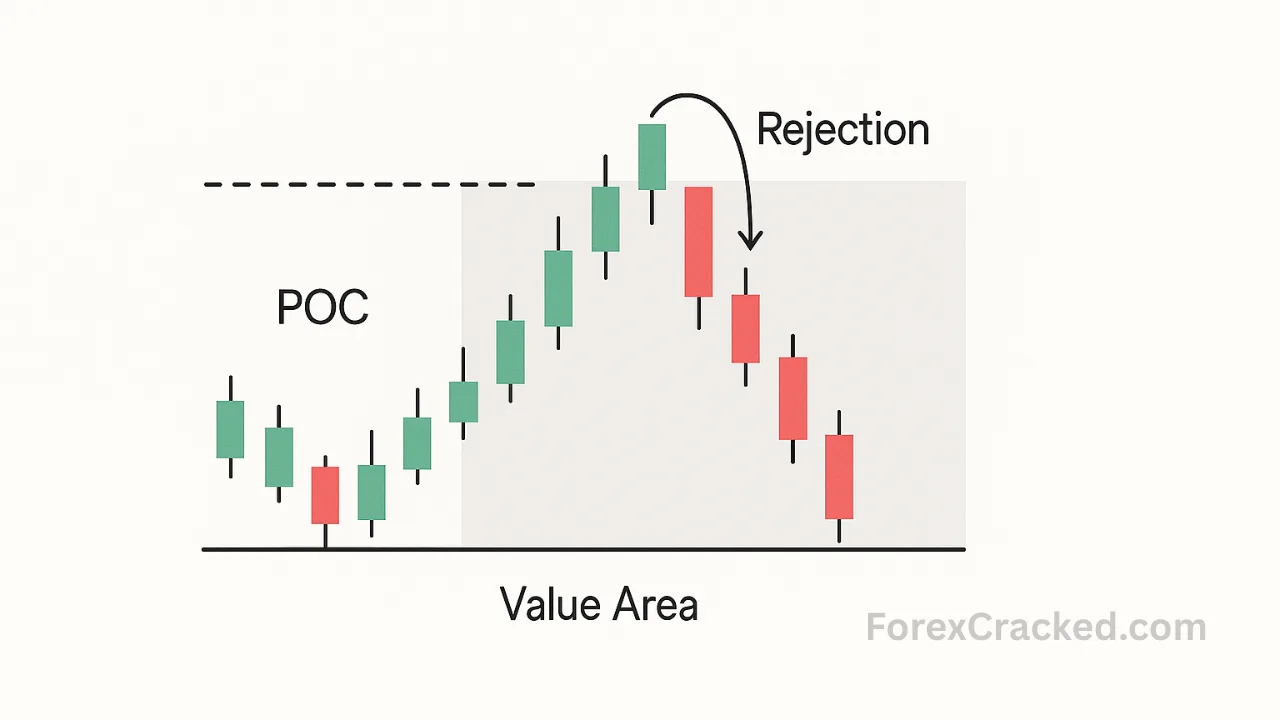
During balanced sessions, price frequently oscillates around the Point of Control and Value Area. When price rejects a value edge and sentiment weakens in that direction, it signals that buyers or sellers are exhausted opening the door for a return to POC.
Rules:
- Identify a balanced profile (wide, even distribution).
- Watch for price to tag a value-area edge and reject it with weakening sentiment.
- Entry: On the rejection close or a retest confirmation on a lower timeframe.
- Stop-loss: Just beyond the value edge.
- Targets:
- TP1: POC (the “magnet” price).
- TP2: Opposite value edge (optional for extended range days).
Why it works:
The POC is the market’s fair price, where the most business occurred. When price rejects the edges, mean-reversion toward this equilibrium level becomes the path of least resistance.
3. Value-Area Breakout & Retest (Thin-Zone Drive)
Concept:
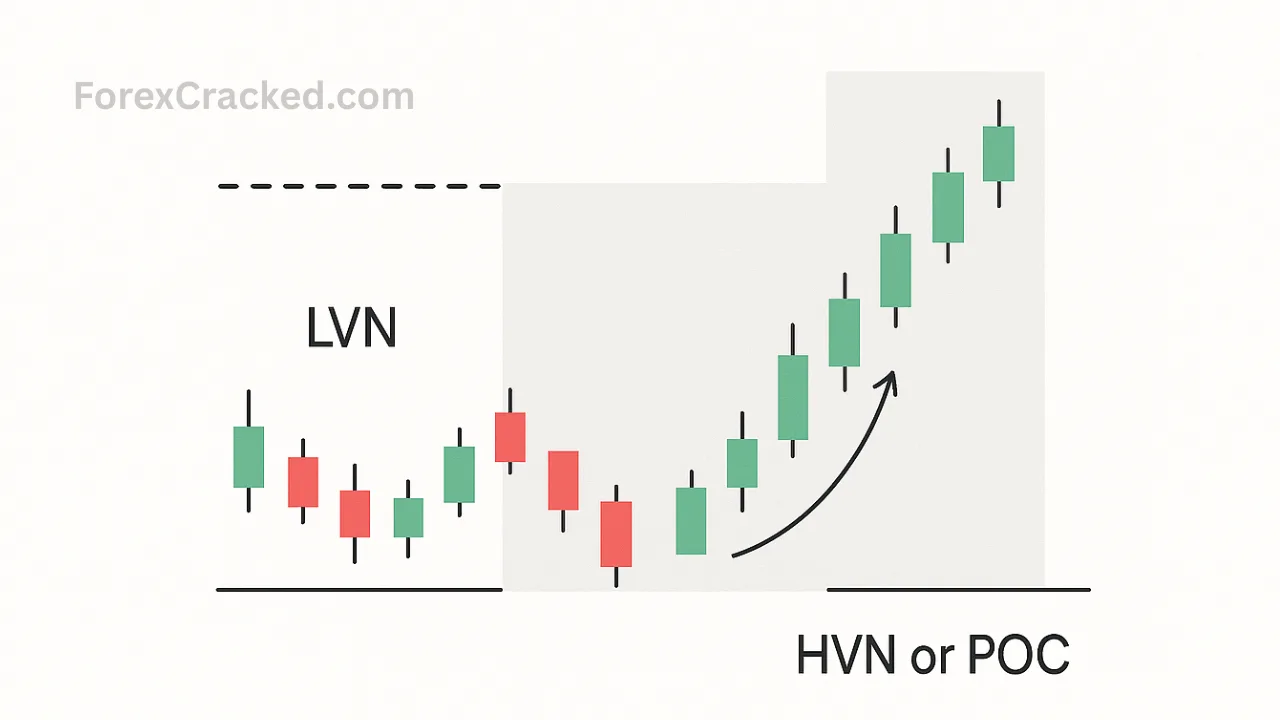
When price breaks through a Low Volume Node (LVN) a thin zone on the liquidity profile it often accelerates quickly toward the next High Volume Node (HVN) or POC. These moves usually happen during high-volume sessions and align with a strong sentiment bias.
Rules:
- Map out LVNs (thin zones) and HVNs (heavy zones).
- Look for a decisive breakout through an LVN with sentiment confirming the direction.
- Entry: On the retest of the broken value edge or LVN.
- Stop-loss: If price closes back inside the value area for more than one candle.
- Targets: Next HVN or session POC extension.
Why it works:
LVNs are “air pockets” once price breaks through, there’s little resistance until it hits the next liquidity cluster. Combining LVN breaks with sentiment alignment gives high-momentum entries with strong risk-reward potential.
In Summary
These three setups Liquidity Sweep, POC Reversion, and Value-Area Breakout form a complete system for trading around liquidity and sentiment.
- The Sweep catches reversals from trapped traders.
- The Reversion captures equilibrium rotations.
- The Breakout rides directional expansions.
By combining them with the Liquidity & Market Sentiment Indicator, you’ll always know where price is likely to react not just where it’s been.
Download a Collection of Indicators, Courses, and EA for FREE
Risk & Trade Management: The Rules That Keep You Profitable

Even the best trading setups mean little without discipline and risk control. Managing your trades with a consistent structure is what turns a good strategy into a long-term edge. The Liquidity & Market Sentiment Strategy follows a strict but simple approach designed to protect capital, minimize drawdowns, and steadily grow your account even with a modest win rate.
1. Keep Risk Small and Consistent
Always risk only 0.5% to 1% of your account per trade. This ensures you can survive losing streaks while staying mentally clear for the next opportunity.
Avoid the common mistake of increasing position size after a few wins or widening stops when trades move against you. A small, consistent risk profile creates stability and prevents emotional decision-making one of the biggest killers of trading performance.
2. Position Size Based on Stop Distance
Your position size should always depend on the distance between your entry and stop-loss not how confident you feel about a setup.
- Wider stop = smaller position.
- Tighter stop = slightly larger position.
Use a position size calculator or an EA to automate this process. This keeps your risk per trade constant no matter the volatility or timeframe.
3. Scale Out and Secure Partial Profits
Once price reaches the first logical target usually the Point of Control (POC) or a key value edge consider taking 50% off the table. This locks in profits and reduces stress on the remaining position.
Trail your stop behind:
- A minor swing structure, or
- The shifting POC as it updates throughout the session.
This way, even if the market reverses, you’ve already captured a reward and limited your downside.
4. Know When Not to Trade
Some conditions simply aren’t worth the risk:
- High-impact news releases (NFP, FOMC, CPI, etc.) create unpredictable volatility that distorts sentiment data.
- Overlapping, choppy sessions often produce false signals with little directional conviction.
- Immature profiles early in a session when liquidity hasn’t built up can mislead you into premature entries.
Patience is a form of edge. Sitting out of bad conditions protects both your capital and your confidence.
5. Focus on Positive Expectancy
With structured targets like POC, value edges, and HVNs, your average reward-to-risk ratio naturally tilts in your favor. Even if your win rate is only 40–50%, maintaining a 1.5–2R target keeps your expectancy positive over time.
In short: trade small, trade smart, and let the math not emotions compound your edge.
Indicator Setup (MT4/MT5): How to Configure It for Maximum Clarity
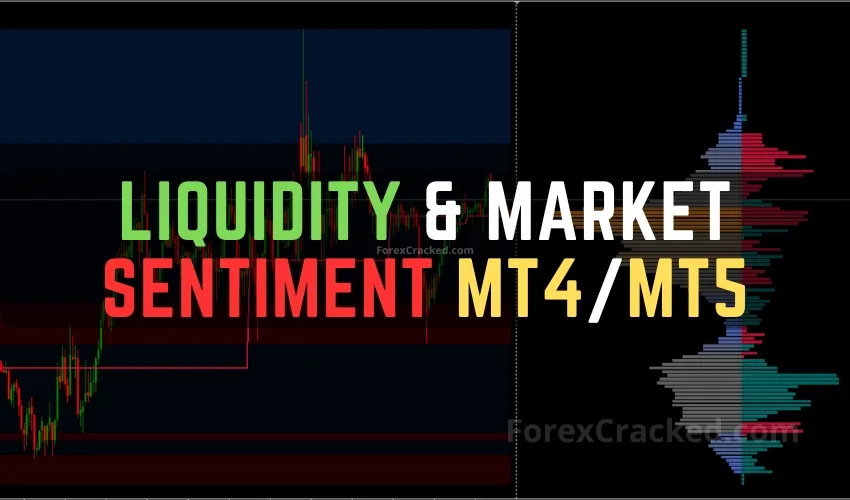
Setting up the Forex Liquidity & Market Sentiment Indicator correctly is key to getting clean, reliable signals. The default settings are designed to suit most traders, but a few simple adjustments can make your chart easier to read and your analysis far more effective.
This indicator is available for MT4 and MT5 platforms and is built to display real-time liquidity distribution, trader sentiment, and value areas. You can anchor it to any period like a specific session or trading day to understand how institutional order flow and retail sentiment develop over time.
1. Anchor the Profile for Context
Set your anchor point to either the London or New York session open, or to the start of the previous day.
- Anchoring to a session open helps you analyze intraday behavior, identifying where liquidity builds up during the most active hours.
- Anchoring to the previous day gives you a broader view of developing value zones and major liquidity clusters.
This context helps you identify whether today’s price action is building on or rejecting yesterday’s structure.
2. Choose the Right Resolution
Set the profile resolution to Medium as a starting point.
- If the histogram looks too blocky, increase the resolution slightly for finer detail.
- If it looks too noisy, reduce resolution to simplify the visual flow.
Each pair and timeframe has its own rhythm so adjust until the profile feels smooth and easy to interpret.
3. Display Key Elements Clearly
Make sure the indicator displays the following essential components:
- Liquidity Profile (right): Shows where trading activity and order flow cluster by price level.
- Sentiment Profile (left): Reveals how buyers and sellers behaved at those same levels.
- Point of Control (POC) or Level of Significance: The price level with the highest traded volume often acts as a “fair price magnet.”
- Value Area: Highlights the zone where about 70% of trading occurred a critical area for mean reversion and breakouts.
This structure gives you a full picture of where the market is most interested in doing business.
4. Keep Color Coding Consistent
Use consistent colors for all pairs and timeframes so you can read your charts quickly and intuitively.
- Example: Red for liquidity, blue for sentiment, yellow for POC, and shaded zones for value areas.
Consistency speeds up your analysis and reduces cognitive load when switching pairs during active sessions.
5. Use It as a Map. Not a Signal Generator
Remember, this is a data-driven visualization tool, not a buy/sell signal indicator.
It displays price, volume, and sentiment data so you can make informed, rules-based decisions. Combine it with your trading plan, structure analysis, and risk management never rely on it alone.
Download the Indicator
It’s lightweight, easy to install, and works perfectly with any modern MetaTrader setup. Start experimenting with the default settings first, then fine-tune based on your favorite pairs and sessions for the best results.
Backtest & Forward-Test Blueprint: Prove Your Strategy Before You Risk a Dollar
Before you trade any strategy live, you need evidence that it actually works. A well-structured backtest and forward-test not only builds confidence but also reveals whether the Liquidity & Market Sentiment Strategy truly gives you an edge. This blueprint keeps the process fast, realistic, and data-driven.
1. Define Your Testing Scope
Start with a 30-day sample period, focusing on the most active and liquid market hours the London and New York sessions.
- Pairs to test: EURUSD and XAUUSD (Gold).
These instruments offer consistent volume and cleaner liquidity profiles, which make your test results far more reliable.
Your goal is to understand how the strategy behaves in different market conditions trending, ranging, and volatile sessions without needing months of data collection.
2. Prepare and Label the Three Setups
Clearly define the setups before you start:
- Liquidity Sweep Reversal + Sentiment Flip
- POC Rejection Mean Reversion
- Value-Area Breakout & Retest
Having these labeled will prevent emotional bias during testing and help you see which pattern delivers the most consistent results.
3. Track Every Detail (Journal It Properly)
For every trade you test, log:
- Entry reason (which setup triggered it)
- Stop-loss & Take-profit levels
- Risk-to-Reward ratio (RR)
- Session traded (London or NY)
- MAE/MFE (Maximum Adverse/Maximum Favorable Excursion)
- Final result (win/loss/BE)
Use screenshots or annotated chart images for proof. Visual evidence helps you learn from both winners and losers and prevents hindsight bias when you review later.
4. Evaluate the Results with Clear Benchmarks
After 30 days of trades, calculate your performance metrics:
- Expectancy: Greater than 0 (meaning your average trade makes money)
- Average RR: At least 1.5:1 or higher
- Win rate: Minimum 40%
- Maximum drawdown: Under 10%
If your numbers meet or exceed these benchmarks, you’ve proven your setup has a statistical edge. If not, review your screenshots, refine entry rules, or improve risk control.
5. Move from Backtest to Forward Test
Once your paper results show promise, trade the same setups on a demo account or with small live risk for another few weeks. This “forward test” phase helps you adapt to real-time emotions, spreads, and execution speed factors that backtests can’t replicate.
Why This Step Matters
Testing isn’t busywork it’s how professional traders separate belief from proof. A structured 30-day blueprint shows whether your liquidity-based entries and sentiment filters truly add value, or if they need refining. When you commit to testing like this, you build both discipline and data-driven confidence the two traits that define long-term profitable traders.
FAQs

1. Is the Liquidity & Market Sentiment Indicator predictive?
No. It visualizes where trading activity and sentiment cluster so you can make structured, rules-based decisions (entries/exits/risk). Use it within a plan.
2. What is the POC and why does everyone target it?
POC is the price with the highest traded volume in your anchored window often a reaction level or “magnet” on mean-reversion days.
3. What are buy-side and sell-side liquidity?
Buy-side liquidity (above highs) are stops from short sellers; sell-side (below lows) are stops from longs. Sweeps occur when price tags those pools before reversing.
4. How do LVNs/HVNs help?
LVNs (thin zones) are ideal for breakouts; HVNs (thick zones) and POC often act as targets or pause points.
5. Best timeframes and sessions?
Scan on M15–H1, refine on M5 during London/NY when liquidity and sentiment signals are most reliable.
Conclusion
Trading isn’t about chasing price it’s about reading liquidity and sentiment.
Take the EURUSD London session for example: price sweeps the previous day’s high, wicks above, and closes back inside the value area as buyer sentiment fades. You short the retest, place your stop above the wick, take profit at the POC, and trail the rest to the lower value edge a textbook Liquidity Sweep Reversal.
That’s how this strategy works: it lets you trade where big decisions happen, not where retail noise reacts.
Download the Forex Liquidity & Market Sentiment Indicator (MT4/MT5) from ForexCracked and start practicing these setups because once you see liquidity clearly, you’ll never look at the market the same way again.

