
The Relative Strength Index (RSI) is a popular technical indicator used in forex trading to assess the strength and momentum of price movements. Developed by J. Welles Wilder in 1978, RSI measures the speed and change of price movements, providing traders with valuable insights into potential overbought or oversold conditions. In this article, we will explore a simple yet effective RSI trading strategy designed to help traders make informed decisions and optimize their trading performance.
Understanding RSI
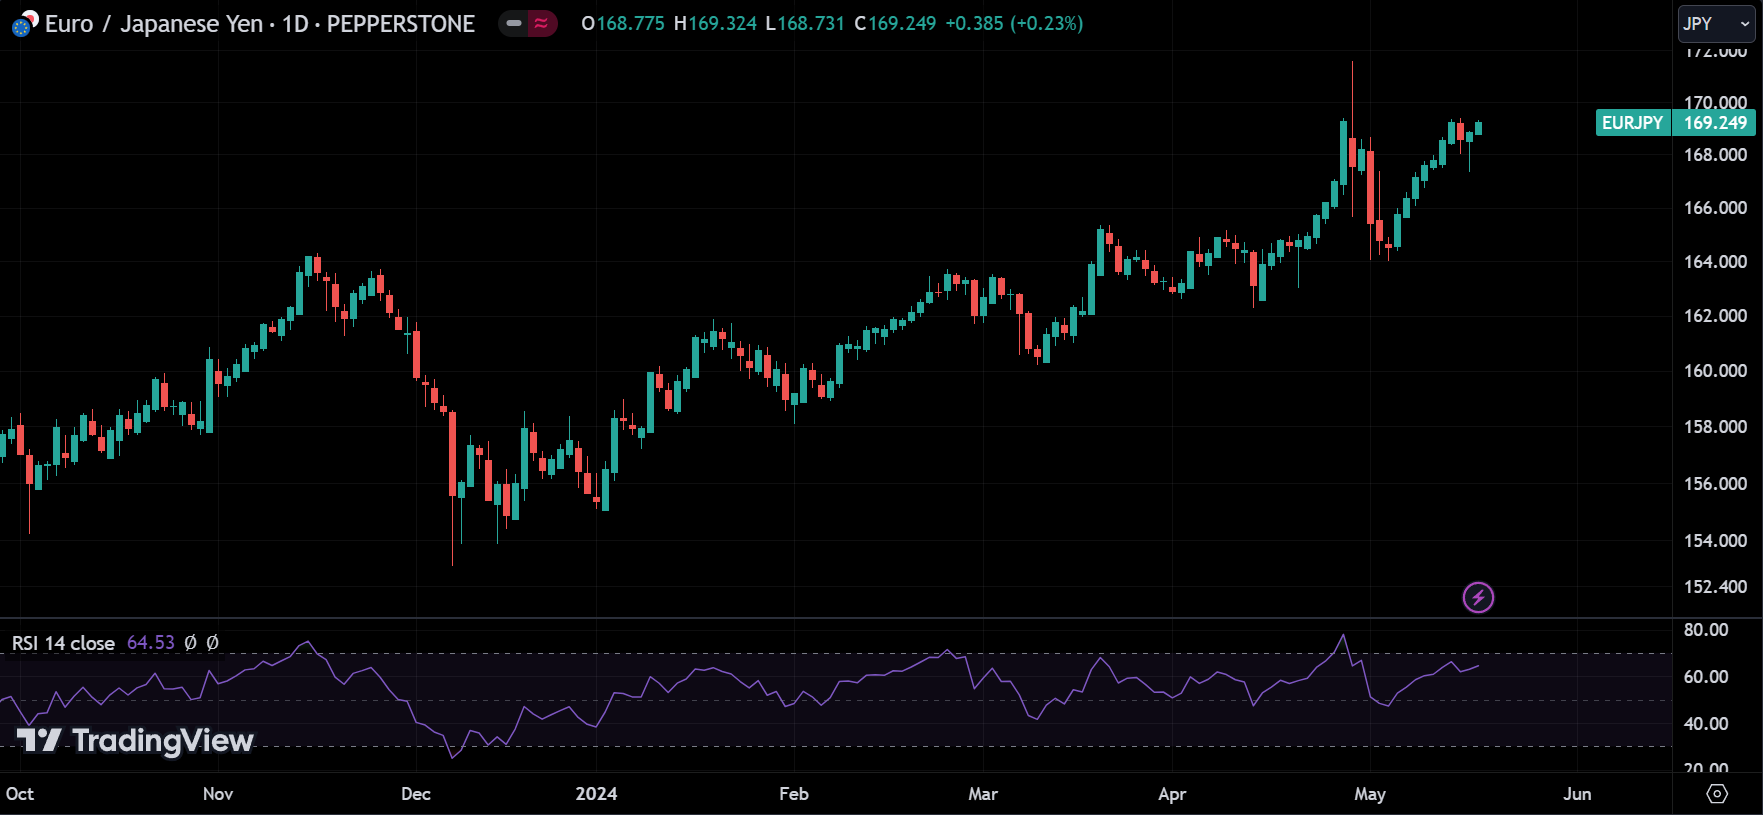
The RSI is a momentum oscillator that ranges from 0 to 100. Traditionally, an RSI reading above 70 is considered overbought, indicating that the asset may be overvalued and due for a correction. Conversely, an RSI reading below 30 is considered oversold, suggesting that the asset may be undervalued and due for a rebound. The standard period for calculating RSI is 14 periods, but traders can adjust this based on their trading style and time frame.
RSI Forex Trading Strategy
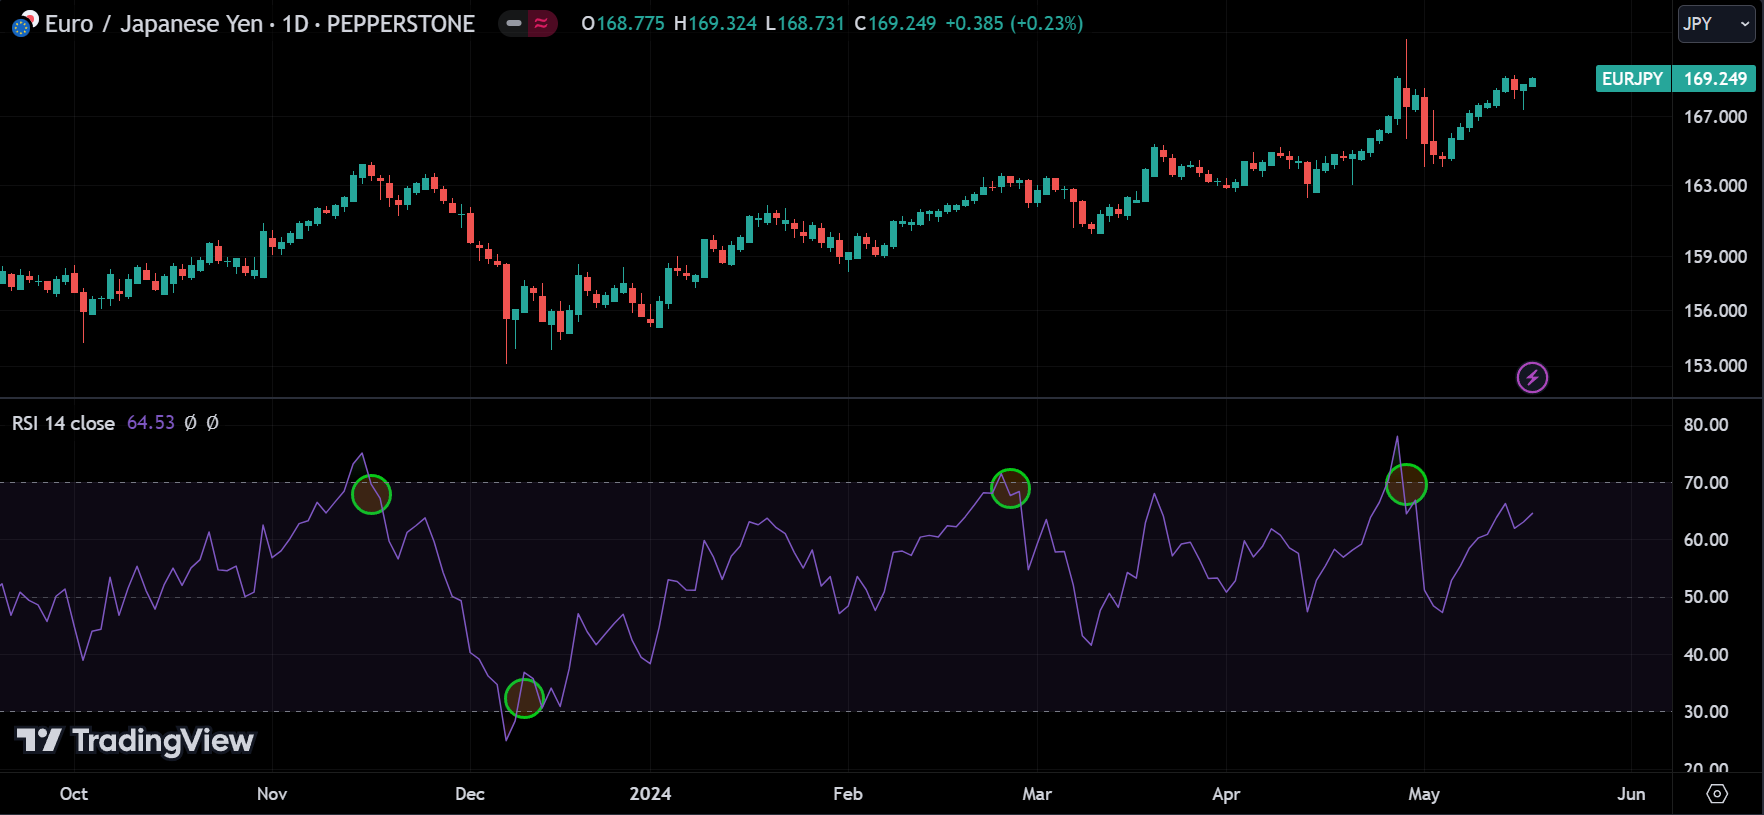
The idea behind this strategy is not to take a position when RSI reaches oversold or overbought levels but to take advantage of RSI returning to normal from these levels.
For example, if the RSI is at 75, which is an overbought level, and it starts dropping to 69, you enter a short position. If the RSI is at 20, which is an oversold level, and it starts rising to 31, you enter a long position.
This is because we don’t want to get stuck in a position while the market stays oversold or overbought for a long time because it does happen all the time. Instead, we wait for confirmation that the price is reversing, and then we take that opportunity to make a profit from this momentum.
To take profit, if you have a long position, aim to take profit around the 65 level. If you have a short position, aim for around 35. You can adjust these levels to see what works best for you. For example, you might take profit at a middle level like 50. Experiment and find what works best for you.
For stop loss, depending on the timeframe you’re trading, this strategy works best on 15-minute and 1-hour charts. When you enter a position, make sure your stop loss isn’t triggered by market noise. Leave enough space for market fluctuations, which depends on the market conditions and the pair you’re trading. For example, set your stop loss to at least 15-20 pips for 15-minute charts and over 40 pips for 1-hour charts. Again, try different options to see what works best for you.
Trading Plan for RSI Trading Strategy
| STRATEGY | SIMPLE RSI TRADING STRATEGY |
| TRADING STYLE | DAY-TRADING |
| STRATEGY TYPE | MEAN-REVERSION |
| HOLDING PERIOD | FEW MINS TO CURRENT SESSION END |
| ASSET SELECTION | EURUSD |
| TIME FRAME | 15M |
| ENTRY SIGNAL | RSI REACHING 31 OR 69 |
| ENTRY STYLE | SINGLE MARKET ENTRY |
| TAKE PROFIT SIGNAL | RSI REACHING 65 OR 35 |
| TAKE PROFIT STYLE | SINGLE LIMIT ORDER |
| POSITION SIZING | SINGLE ENTRY 2% RISK |
| STOP LOSS | 2% RISK, NEAR SUPPORT/RESISTANCE, OVER 15 PIPS |
| BAIL OUT INDICATORS | STONG FUNDAMENTAL NEWS |
If you are not familiar with a Trading Plan and don’t know How to implement a Trading Plan correctly consider reading those articles.
These parameters worked for me when I used this strategy, but the market has changed and will keep changing. Your goal is to try different settings or methods for these parameters and backtest your trading strategy to see what works for you. Keep testing until you find a trading plan that gives you positive results.
For example, you can change the holding time for your position, and you can try to increase your profit even before reaching 65 or 35. you can try different pairs. You can try different RSI levels. Different time frames. Incorporate multiple time frame analyses. You can push this strategy as much as you want.
Once you find the best setup for your trading strategy and plan, write it down like shown above and follow it every time you trade. This is very important for your trading mindset.
Advantages of the RSI Trading Strategy
- Ease of Use: The strategy is straightforward, making it accessible for novice and experienced traders.
- Versatility: RSI can be applied to various time frames and currency pairs, allowing traders to adapt the strategy to their preferences.
- Effectiveness in Trending and Range-Bound Markets: While particularly useful in range-bound markets, RSI can also provide valuable insights when combined with price action during trending conditions.
Limitations and Considerations
- False Signals: RSI can generate false signals, especially during strong trending markets where the price continues to rise or fall despite overbought or oversold conditions.
- Lagging Indicator: As a momentum oscillator, RSI can lag behind price movements, potentially causing delays in entry or exit points.
- Need for Confirmation: To improve accuracy, combining RSI signals with other technical analysis tools or indicators is essential.
Disclaimer
The information provided in this article is for educational purposes only and should not be considered financial advice. Trading forex involves significant risk and may not be suitable for all investors. Past performance is not indicative of future results. Always conduct your own research and consider your financial situation before making any trading decisions. Seek advice from a licensed financial advisor if needed.
Conclusion
The simple RSI trading strategy is a powerful tool for traders seeking to capitalize on overbought and oversold conditions in the forex market. By understanding the principles behind RSI and implementing a disciplined approach to entry and exit points, traders can enhance their decision-making process and improve their trading outcomes. Remember, no strategy is foolproof, so practicing proper risk management is crucial and continually refining your approach based on market conditions is crucial.
Thanks admin no downloading link
What download link are you looking for?
This is a strategy, not an ea nor an indicator