

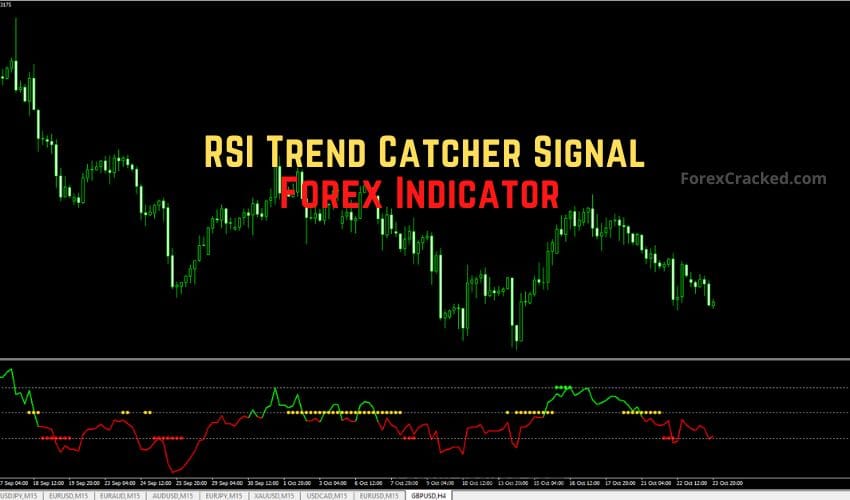
The RSI Trend Catcher Signal Indicator for MT4 is a simple yet powerful trend-following tool that takes the traditional Relative Strength Index (RSI) to the next level. Unlike the classic RSI, which only shows overbought and oversold zones, this upgraded version adds clear color-coded signals, trend alerts, and even divergence detection, giving traders an all-in-one momentum and trend analysis system.
Whether you’re a beginner or an experienced price-action trader, this indicator makes it easier to spot trend continuations, reversals, and entry points in real time.
What Is the RSI Trend Catcher Signal Indicator?
The RSI Trend Catcher Signal is built on standard RSI logic, enhanced with color-coded visual cues that instantly show market sentiment and trend state.
It uses three key colors to represent different market conditions:
- Red line – Bearish trend (ideal for SELL trades)
- Green line – Bullish trend (ideal for BUY trades)
- Yellow line – Neutral zone or sideways market
Alongside color changes, the indicator also identifies bullish and bearish divergences, giving early warnings before a trend shift occurs, something the regular RSI doesn’t do by default.
How the RSI Trend Catcher Signal Works
Like the classic RSI, the RSI Trend Catcher measures momentum and identifies overbought (70) and oversold (30) levels.
- When RSI moves above 70, the market is overbought and is expected to experience a potential downward reversal.
- When RSI dips below 30, the market is oversold, signaling a potential upward bounce.
However, what sets this indicator apart is how it visually displays these states and trend shifts:
- A green RSI line appears when the market transitions into a bullish trend.
- A red RSI line forms when bearish pressure dominates.
- A yellow RSI line shows price consolidation or uncertainty.
This simple color-coded logic helps traders avoid confusion and quickly gauge the market mood.
RSI Trend Catcher Buy Strategy
- Wait for the indicator line to turn green, signaling bullish momentum.
- Confirm that RSI is rising from the oversold zone (below 30).
- Enter a BUY trade when the line fully transitions from red/yellow to green.
- Set a stop-loss near the recent swing low.
- Exit the trade when the RSI line changes back to yellow or red.
Pro Tip: Combine the green RSI signal with a bullish candlestick pattern (e.g., engulfing or hammer) to confirm your entry.
Read More Double Stochastic RSI Forex Indicator FREE Download
RSI Trend Catcher Sell Strategy
- Wait for the indicator line to turn red, signaling bearish strength.
- Confirm that RSI is falling from the overbought zone (above 70).
- Enter a SELL trade when the line shifts from green/yellow to red.
- Place a stop-loss above the last swing high.
- Exit the trade when the RSI line turns yellow or green again.
Pro Tip: Add a trend filter, such as a 50 EMA, to trade only in the dominant trend direction for more accuracy.

Download a Collection of Indicators, Courses, and EA for FREE
Example: Trading RSI Trend Catcher on EUR/USD
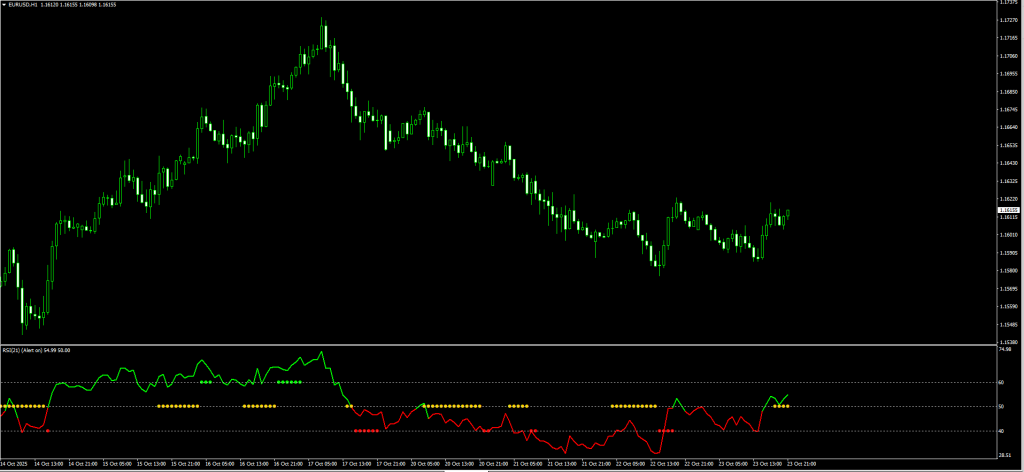
Let’s look at how this indicator performs in a real scenario.
In the EUR/USD H1 chart, the RSI Trend Catcher line turned green after dipping into the oversold region. A BUY signal appeared as the line crossed above 30 and began climbing steadily.
The price continued rising for nearly 120 pips before the line shifted to yellow, signaling a potential exit.
Later, the RSI turned red as the pair entered overbought territory, providing a clean SELL signal that captured another strong move.
This kind of dual functionality (trend direction + reversal signal) makes RSI Trend Catcher ideal for swing and intraday traders alike.
RSI Trend Catcher Indicator Features
- Color-coded RSI line (green, red, yellow) for instant trend recognition
- Identifies bullish & bearish divergences automatically
- Buy/Sell alerts are displayed in the top-left chart corner
- Works across all timeframes (from M1 to D1)
- Compatible with Forex, Crypto, Stocks, and Indices
- Lightweight, free, and easy to install on MT4
Trading Tips
- Avoid trading when the RSI line is yellow, as it indicates indecision or range-bound movement.
- Use the indicator in combination with support and resistance zones for cleaner signals.
- Stick to a 1:2 risk-reward ratio for consistent profitability.
Free Download RSI Trend Catcher Signal Forex Indicator
Read More RSI Extreme Zone Forex Indicator MT4 FREE Download
Conclusion
The RSI Trend Catcher Signal Forex Indicator for MT4 simplifies RSI-based trading by combining color-coded visuals, alerts, and divergence detection in a single package.
It helps you trade with the trend, identify reversals early, and avoid ranging markets. Whether you’re a scalper or swing trader, this tool delivers clear signals that make decision-making much easier.
Download the RSI Trend Catcher Signal Indicator for MT4 today and start catching trends like a pro!
Frequently Asked Questions (FAQ)
1. Does the RSI Trend Catcher repaint?
No, the signals and colors stay fixed once the candle closes.
2. Can it be used for scalping?
Yes, it works great with a short-term moving average on M5 or M15.
3. Does it have alerts?
Yes, buy/sell alerts appear automatically in the top-left corner of the chart.
4. Is it beginner-friendly?
Absolutely. The color-coded system makes it easy to read, even for new traders.
5. What pairs and timeframes does it work on?
It works across all pairs and timeframes, from intraday to swing trading setups.