
Range Detector Indicator is a technical analysis tool designed to assist traders in identifying periods where asset prices consolidate within a defined boundary. This indicator for MT4/MT5 focuses on real-time detection of ranging intervals, visually marking these zones to help users recognize potential breakouts and emerging trends. With its dynamic visual cues and automated range analysis, this tool aims to provide a structured approach to interpreting sideways market movements.
At its core, the Range Detector relies on a detection algorithm that examines whether all prices within a predefined time window fall inside a band formed by the mean of that window, adjusted by an Average True Range (ATR) value. The boundaries are calculated using the formula: mean ± ATR, which creates a zone that adapts to price volatility.
If a new price range overlaps with an existing one, the indicator consolidates the two into a single extended range. This merging mechanism updates the extremities of the prior range to ensure continuity and accuracy. The result is a streamlined depiction of market ranges that reflects changes over time without significant manual input.
Range Detector MT5 Indicator isn’t a standalone trading indicator System. Still, it can be very useful for your trading as additional chart analysis, to find trade exit position(TP/SL), and more. While traders of all experience levels can use this system, practicing trading on an MT4 demo account can be beneficial until you become consistent and confident enough to go live. You can open a real or demo trading account with most Forex brokers.
Configuring the Indicator
Traders can adjust several settings within the Range Detector indicator to match their specific market outlook or timeframe:
- Minimum Range Length – This sets how many candlesticks or bars are required to confirm a range. A higher setting may result in fewer but potentially more stable ranges.
- Range Width (ATR Multiplier) – Controls how tight or loose the range limits are. A smaller multiplier can pick up shorter, tighter price consolidations, while a larger one can avoid smaller fluctuations but may miss some useful signals.
- ATR Length – This defines how the volatility baseline is calculated. Shorter ATR periods react quicker to recent changes; longer ATR values smooth the data, potentially delaying the range detection.


Trading with the Range Detector
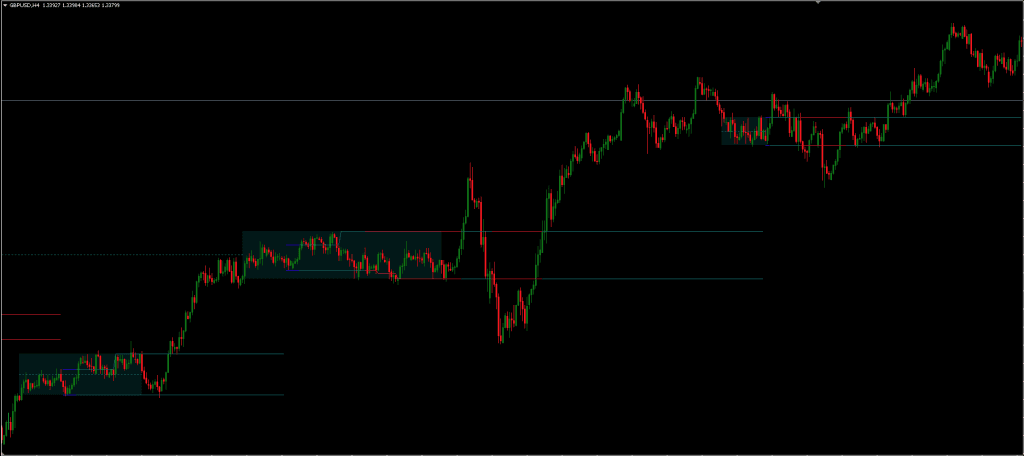
Typically, range trading involves identifying sideways markets where price oscillates within a ceiling and a floor. The Range Detector automates this identification, offering visual cues to mark the start and dimensions of a stationary period price action.
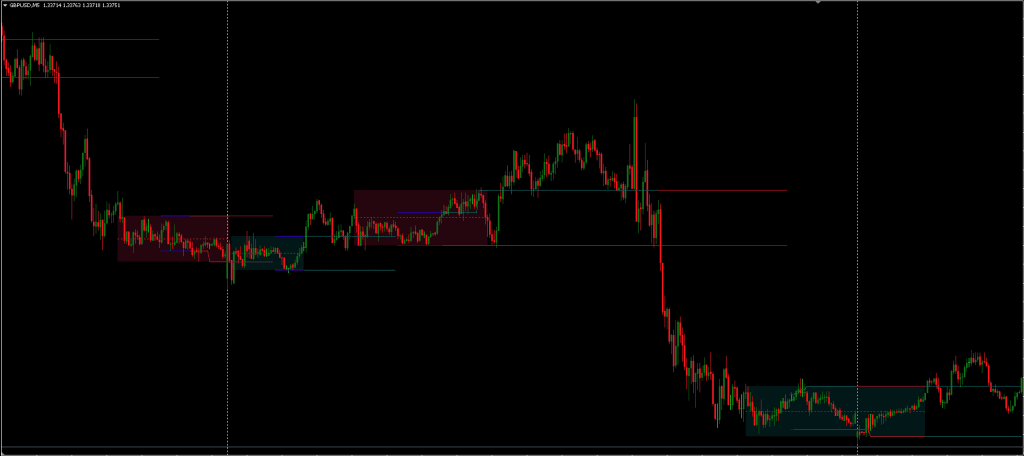
Each detected range is mapped retrospectively, beginning at a point in the past which meets the tool’s requirements. A gray band is applied to the chart to indicate the range period, and a dotted line running through the midpoint (between high and low) provides an additional point of reference. This can be useful in understanding where the market is in relation to the mean of the range.
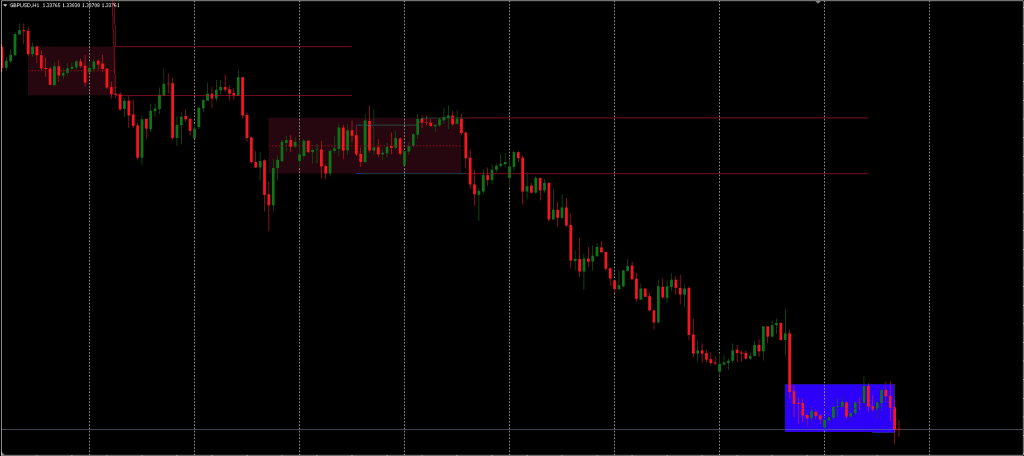
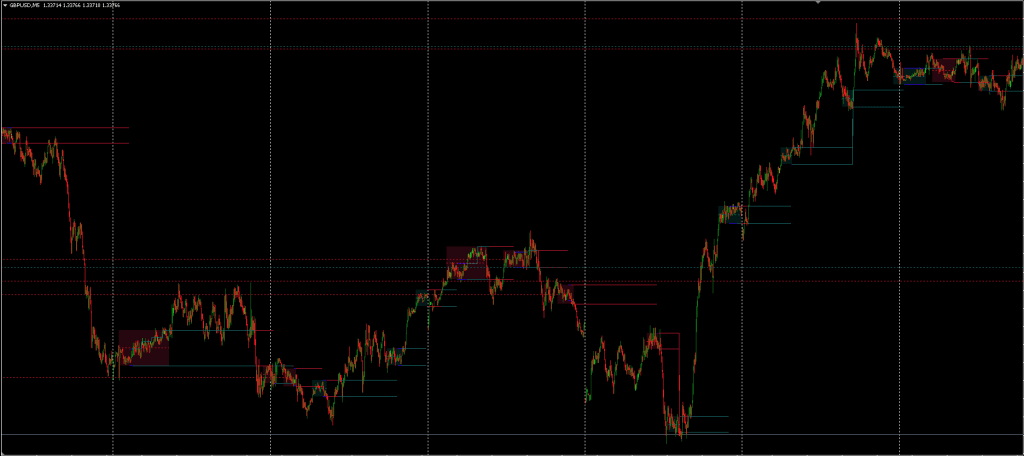
Range Breakouts are signaled through color-coded extremities:
- Blue Lines – Denote the top and bottom of an active, unbroken range.
- Green Lines – Indicate that price has moved above the upper boundary, suggesting a potential upward momentum.
- Red Lines – Suggest downward movement beyond the lower boundary, which may lead to bearish trends.
These lines remain on the chart until another range is detected, offering possible clues about former support or resistance levels.
Conclusion
The Range Detector MT4 Indicator provides traders with an automated method of visualizing and interpreting sideways market activity. While it can improve the consistency of range identification and highlight key market breakouts, its effectiveness still depends on context, market condition, and individual trading approach. As with most indicators, its output is meant to support, not replace, comprehensive analysis and decision making.
“Please send me the link to the Range Detector Indicator for MT4/MT5