
Dxy chart looking at the daily it is a pretty tricky one here because last week we had a break to the downside and we have a break to the up side and a very very wide move, so this move to the downside and what happened was we’re gonna see if this is a correction and continuation or if this was the impulse, And as we can see on the daily timeframe , Dxy analysis did close back up above this important resistance and the support area so on
the daily and the weekly we have a close above that.So it is possible that the dollar keep pushing higher for another test to the upside,
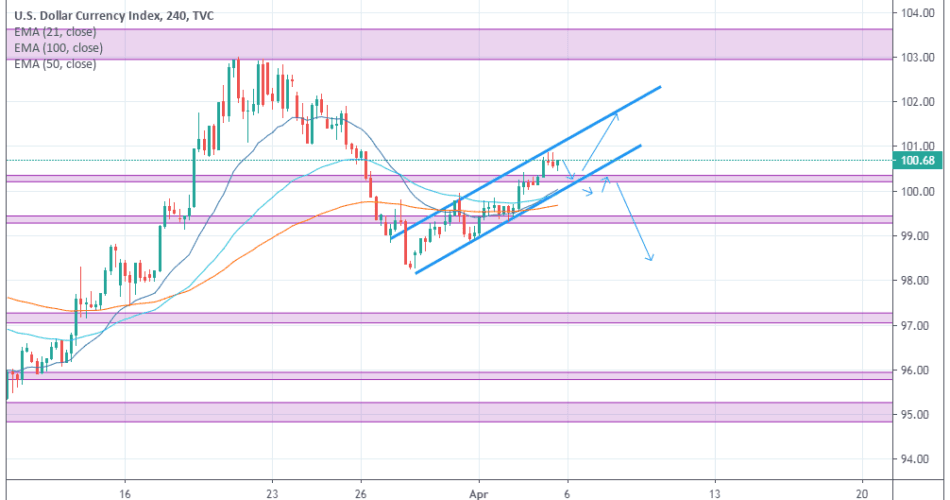
and yes is it possible that we may see this as a possible correction and we move lower check dxy analysis ,if we see a break of the trendline , so as for now we’re seeing higher highs and higher lows on the four-hour time frame, and week we may see a continuation ,as long as we are above this trendline holding as support as it did last two times then we may see a continuation.
for a bearish move we want to see a strong break below trend line to really see that the correction is over and that the market fails to make a new high then we may see continuation.
otherwise it is still a possible continuation to the upside as far as we are above the trend line
Comment your thoughts down below!