

Ever wondered why a textbook bullish engulfing on EURUSD sometimes fails while the same pattern on GBPJPY rockets for 100 pips? The answer is hidden in relative strength. A single-pair indicator (RSI, MACD, Stochastics) only tells you what is happening inside that chart. A currency strength meter (CSM) compares all eight majors across 28 crosses in real time, so you can marry a currency that’s actually strong with one that’s objectively weak. Put simply:
Buy strength, sell weakness, and let correlation do the heavy lifting.
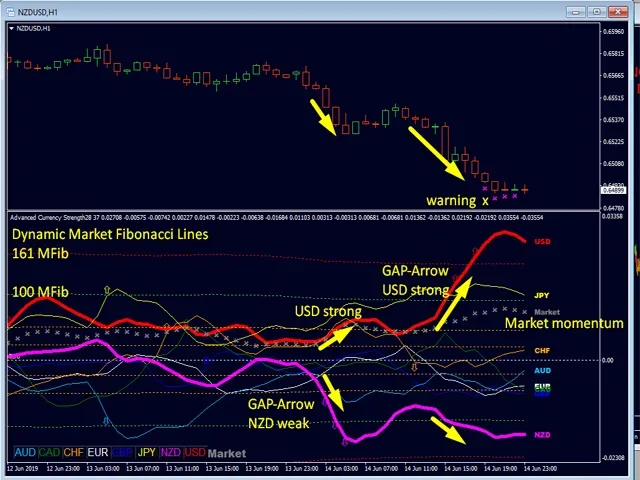
This Currency Strength Meter packs every clue you need onto one screen: multi-timeframe strength lines, dynamic Market Fibonacci (MFib) bands that flag exhaustion, a momentum curve with green/red GAP arrows for acceleration, and pop-up alerts when a currency stretches too far. Instead of flipping through dozens of charts, you get an instant, colour coded pulse of where the money is moving.
Table of Contents
What Exactly Is a Currency Strength Meter?
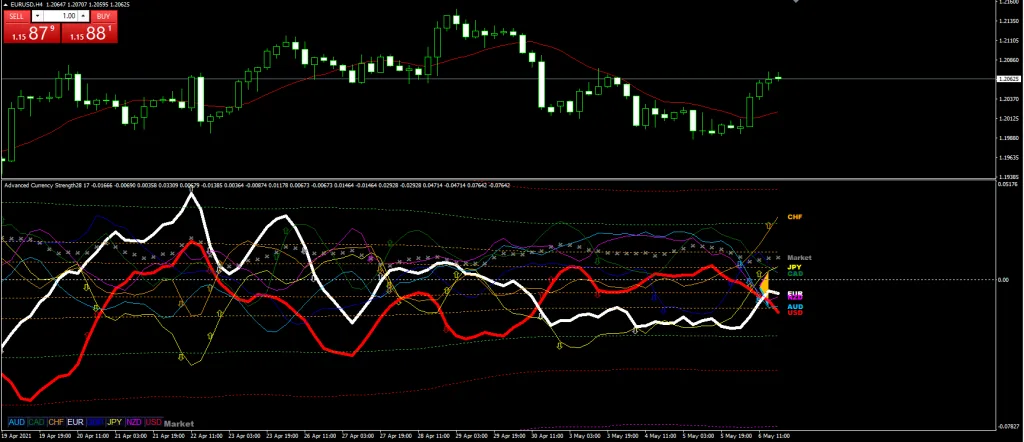
Picture the currency strength meter as an eight-lane racetrack that refreshes every few seconds. For each major currency USD, EUR, GBP, JPY, CHF, CAD, AUD, NZD it totals that currency’s net move against all the others over your chosen look-back window (say, the last 100 H4 candles) and plots the result as a coloured line that floats above or below a central zero line. Next to the legend, you’ll see decimal readings, typically somewhere between +0.010 and –0.010:
- +0.007 GBP → sterling is drawing steady buying pressure
- –0.006 JPY → yen is being unloaded
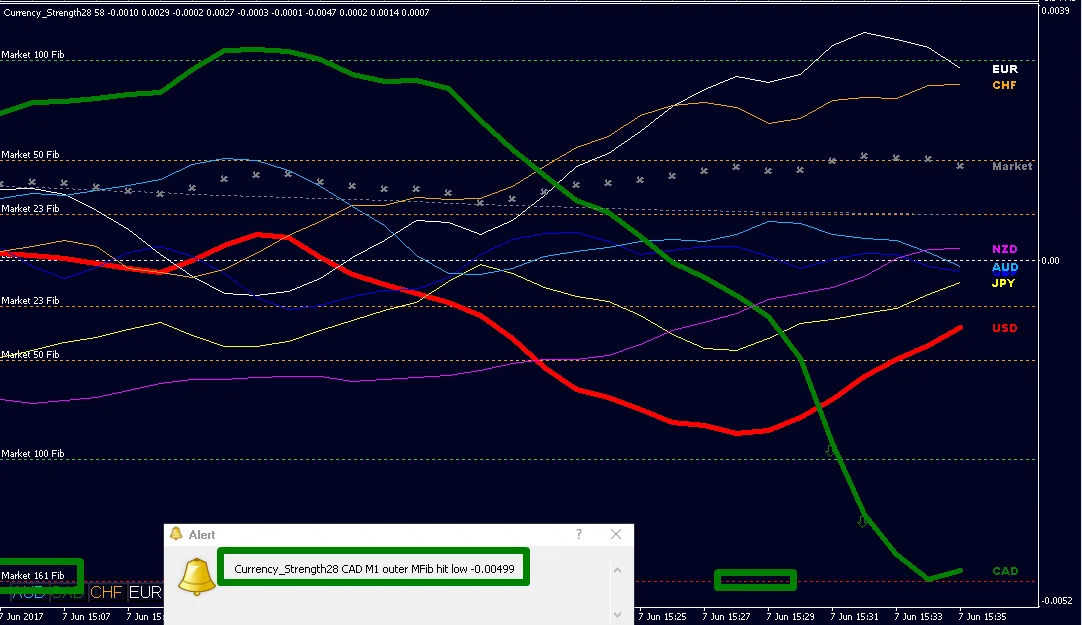
Pairing those extremes, long GBPJPY in this case, puts the market’s fastest sprinter against its slowest. The panel’s white mid-line marks equilibrium, while its outer Market Fibonacci (MFib) bands act like overbought/oversold rails; when a strength line kisses the ±161 % MFib, an alert warns that the fuel tank may be running low.
Because every new candle recalculates these numbers, the meter doubles as an early warning system. If GBP fades from +0.007 to +0.003, you know momentum is cooling long before classic oscillators flash divergence. Used this way, the strength meter isn’t a magic trigger, it’s a high probability filter that shrinks 28 potential crosses to one or two prime candidates, leaving your price-action toolkit to fine-tune the actual entry and exit while the meter keeps you trading with the tide, not against it.
Installing the “Best Currency Strength Meter” on MT4
- Download the ZIP from ForexCracked.
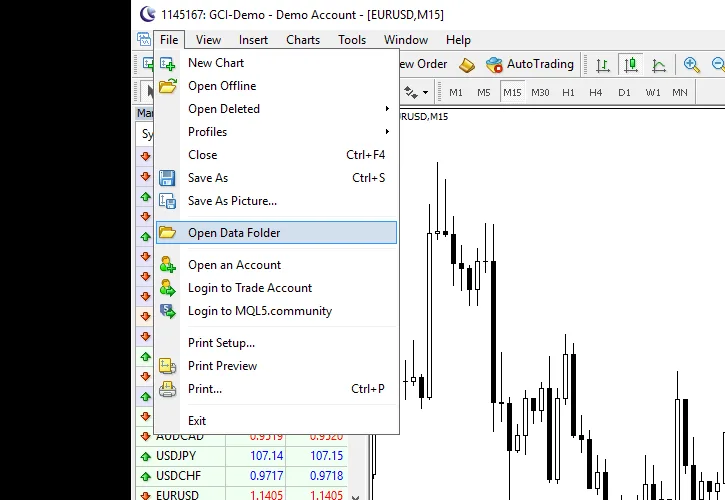
- In MT4 click File ▸ Open Data Folder ▸ MQL4 ▸ Indicators.
- Paste the extracted
.ex4/.mq4files. - Restart MT4 or hit Ctrl + N → Indicators to confirm it appears.
- Drag the indicator onto any chart (EURUSD works fine) and pick your preferred color scheme.
Tip: Because the indicator autoloads 28 hidden charts to pull price data, keep no more than two open dashboards to save RAM.
Under the Hood: Key Features You’ll Use
- Multi-Time-Frame strength lines – Eight colour-coded curves can be fed from any timeframe, so you might display H4 flow on an M15 chart. One glance tells you whether the “big money” and the short-term noise are moving in the same direction before you risk a cent.
- Market Fibonacci (MFib) bands – Two live envelopes inner 100% and outer 161% expand and contract with volatility. They behave like dynamic support-and-resistance rails: the inner band is an obvious stop-loss or pullback zone, while touches of the outer band often precede exhaustion.
- Momentum line & GAP arrows – A ninth white line tracks aggregate momentum. When the slope of a currency’s strength line exceeds the default GAP-angle (≈ 23°), the dashboard flashes a green or red arrow, signalling real acceleration rather than random blips.
- Overbought/oversold alerts – If any strength line tags the ±161 % MFib zone, the indicator pings the chart (and, if you want, your phone). It’s a heads-up that fuel is running low, and profit-taking could kick in.
- One-click pair buttons – Tiny buttons let you flip the price chart to the exact cross GBPJPY, EURUSD, or whatever matches the strongest and weakest currencies, so you can act in seconds instead of hunting through 28 tabs.
These five tools combine to spot a brand-new strength gap, confirm it’s gaining speed, and whisk you to the right pair for execution. The indicator can also flag exits or trailing stops, but our strategy centres on that first jolt of imbalance get in early, ride the surge, and let the meter warn you when momentum starts to fade.
Example: Step-by-Step Currency Strength Meter Strategy
1. Macro Imbalance (H4)
Open the H4 strength dashboard and rank the lines by distance from the white zero line. When the leader and laggard sit roughly five ‘raw points’ apart (≈ ±0.005 on most feeds) you know real money is rotating, not just scalpers flicking prices.
Example: AUD +0.006 vs JPY –0.005 → AUDJPY long jumps onto your watch-list.
2. Micro Confirmation (H1)
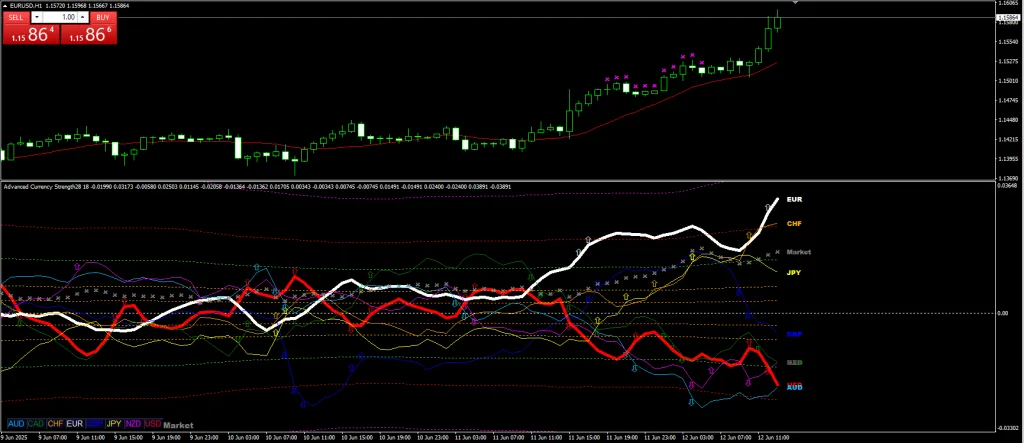
Drop to the H1 feed and check two things:
- Momentum slope – the ninth white “momentum” curve and the coloured AUD line are still climbing, while JPY is still falling. A green GAP arrow usually appears when the slope tops the default 23°.
- Market Fibonacci (MFib) band – price on the AUDJPY chart is holding above the inner 100 % MFib (or below it for shorts). If candles have already pierced back through the 61.8 % zone, momentum is leaking; skip to the next pair.
3. Sniper Entry (M15)
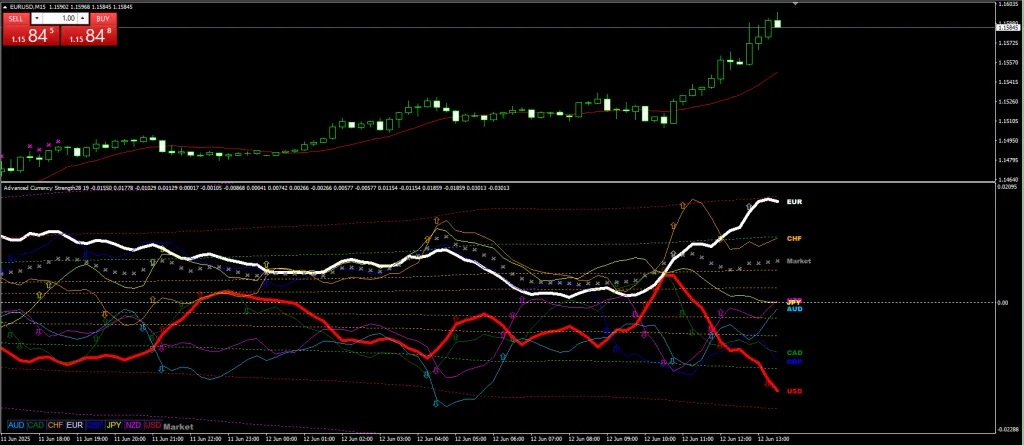
Flip to M15 and wait for the textbook dip:
- Strong currency relaxes toward +0.003; weak currency claws up toward –0.003, but neither crosses the zero line.
- a bullish engulfing (or bearish) engulfing, pin bar, or inside-bar break prints, and the dashboard throws a matching GAP-arrow.
Confluence achieved: big imbalance → short-term discount → price-action trigger.
“Trading Constitution” – Rules You Never Break

- Session filter – enter only when at least one leg is in its home market (London for EUR/GBP, New York for USD/CAD, Tokyo/Sydney for JPY/AUD/NZD). Liquidity outside these windows dries up fast.
- Strength thresholds – H4 gap ~ 0.005; H1 gap must still show ~ 0.004 just before entry. A narrowing spread is a fuel gauge on empty.
- Stop loss – choose the tighter of:
- 5-10 pips beyond the latest M15 swing, or
- a few pips outside the nearest 50 % / 61.8 % MFib band.
- Take profit – hard exit at 2× risk, or trail to the 127 % / 161 % MFib extension, or bail when the strength gap shrinks below ~ 0.003.
- Management – move SL to breakeven once the gap narrows to ~ 0.004 and trail behind fresh M15 structure. Hold no more than two simultaneous trades with different base currencies to avoid correlation pile ups.
Why These Numbers?
In house back-tests of 2021-24 London + NY sessions showed that raw gaps of about 0.005 on H4 produced ≥ 60-pip follow-through 7 times in 10, while smaller gaps dropped to 4 in 10.
Waiting for the pullback toward 0.003 helps you buy the dip, not the spike, because the indicator’s ±161 % MFib alert (its built-in “overbought” ping) often flashes just before momentum cools. And the 1:2 reward-to-risk keeps expectancy positive even if you only win 4 of 10 trades.
The bottom line is to start wide, zoom in, and execute the macro gap. ➜ H1 health-check ➜ M15 trigger. Treat those steps like muscle memory and the Indicator dashboard stops being pretty lines and starts being your edge.
Advanced Tweaks & Filters – Fine-Tuning Your Edge
Multiple-Time-Frame (MTF) Scaling
The Indicator lets you feed a higher-time-frame data stream into any chart via the TimeFrame1/TimeFrame2 inputs, so you can “borrow the vision” of big money while executing on a faster canvas. Use that to run a single strategy at three distinct speeds:
- Scalpers keep the strength feed on H1 but display it on an M5 chart. Wait for a raw gap of roughly ±0 .004 on the H1 dashboard, then demand only a shallow pullback to about ±0 .002 before you fire.
- Intraday traders stay with the classic H4 → H1 → M15 funnel: hunt a ±0 .005 gap on H4 and a dip toward ±0 .003 on M15.
- Swing traders flip the inputs to D1 → H4 → H1. Daily moves are broader, so insist on a ±0 .006 spread on the D1 feed and allow pullbacks only to about ±0 .004 before entering.
As a rule of thumb, anchor one timeframe higher than you plan to hold, confirm one level below that, and pull the trigger two levels beneath that. Widen or tighten the raw gap numbers in proportion to the chart speed.
Correlation Clustering
Some currencies move like siblings, EUR and CHF, AUD and NZD, CAD and oil. If two buddies both print strong readings, pairing them saps momentum. Instead, match one of the friends against a genuine laggard. For example, if EUR and CHF hover near +0 .006 while JPY languishes at –0 .006, an EURJPY or CHFJPY long will outrun EURCHF every time.
Fundamental “Risk Pulse”
High-impact headlines can flip strength lines in seconds.
- Red-flag releases – (NFP, CPI, central-bank decisions): close or hedge fifteen minutes before, then wait another fifteen for spreads to normalise. Only trade gaps that survive that half-hour gauntlet.
- Risk-on / risk-off flips – equities up? AUD-NZD usually firm while JPY-CHF fade. Stocks tanking? Safe-havens jump to the top of the board. If your meter shows the reverse, flows are conflicted size down or stand aside.
- Commodity shocks – an OPEC surprise can launch CAD; a copper spike can yank AUD. Watch which line reacts first early strength usually flags the true driver.
Indicator Settings Worth Tweaking
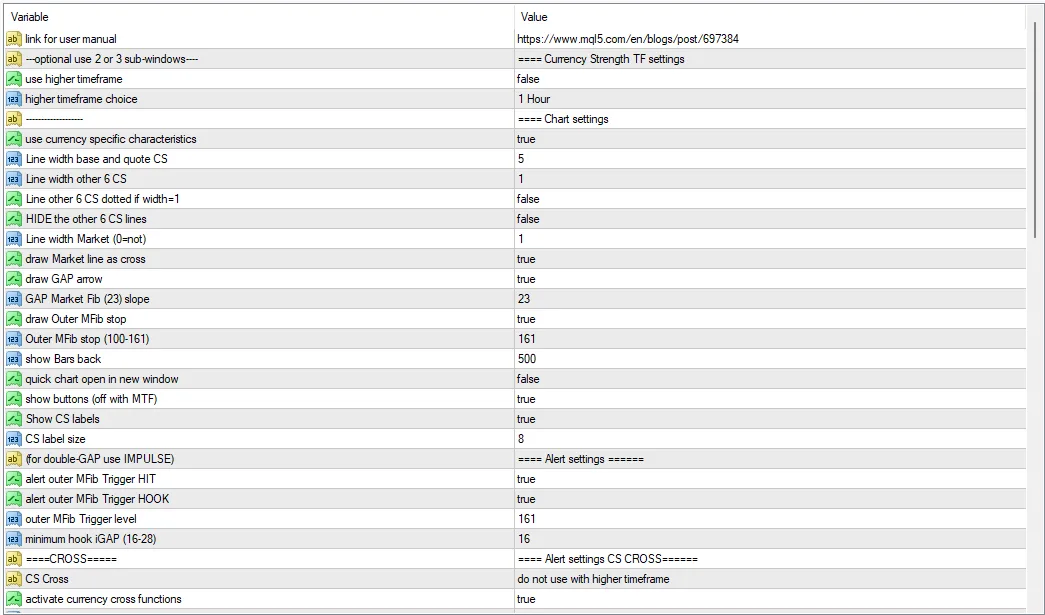
The manual exposes every knob you need—no code required. Tweak one at a time and forward-test thirty trades before judging.
- Period / Look-back – Default 1 440 candles balances speed and stability. Halve it for scalping so lines react faster; double or triple it for swing trading to smooth whipsaws.
- SmoothFactor (momentum line) – Factory setting is 14. Drop to 9 for snappier arrows; raise to 21–34 for silkier but slower turns.
- Alert_Level – Pop-ups ring when a strength line hits the outer 161 % MFib. Lower the threshold to get nudged out earlier, raise it if you like squeezing the very last pip.
- GAP_Angle – Default ≈ 23° triggers the green/red acceleration arrows. Tighten for hyperactive entries; loosen if you want only the strongest thrusts.
- Visual ergonomics – Beef up line thickness or assign simple “strong = green/weak = red” colours so your brain sorts winners from laggards in half a second.
- UniqueID – Rename each instance (e.g., “ACS_fast” and “ACS_slow”) if you run multiple meters; this keeps MT4’s buffers from colliding.
Putting It All Together
- Pick your speed – scalp, day-trade, or swing.
- Wire the MTF feed – anchor above, confirm mid, execute below.
- Use correlation logic –pair a true heavyweight with a featherweight, not two best friends.
- Glance at the risk pulse before every click.
- Tune Period, SmoothFactor, Alert_Level, and GAP_Angle until the dashboard “speaks” your language.
Risk Management & Psychology

- Size small, live long – Keep risk at ~1 % of equity per setup. Even the Indicators cleanest gap can whipsaw when all eight lines bunch near the mid-line; a tiny position lets you shrug off that chop instead of clenching every tick.
- Cap exposure to two open positions – A surprise dollar spike can crush EURUSD and GBPUSD in the same breath. Two trades, each with a different base currency, limit the domino effect.
- Let the tool tell you when to loosen the grip:
- When a strength line tags the ±161 % Market Fib envelope, the built-in alert is warning that fuel may be low. Consider banking partial profits or sliding the stop to the inner 100 % band.
- If the green/red GAP arrow disappears and the slope of the momentum line flattens, momentum is stalling, trimming, trailing, or flattening.
- Journal the raw gap at every exit – After fifty trades you’ll know whether closing once the spread shrinks to about 0.003 keeps more profit than letting it ride. Your own data will beat any generic rule.
- No revenge-trading the flip – The first time both lines cross the zero-line it’s usually noise, not a trend change. Hold fire until a fresh H4 gap of roughly 0.005 forms; otherwise you’re guessing, not trading.
Trade small, heed the tool’s built-in warnings, and treat every exit as a data point. Do that and you’ll keep both your capital and your composure when the strength lines start dancing.
Common Pitfalls and Quick Fixes

1. Chasing outer-band spikes.
Seeing a strength line slam into the ±161 % MFib can feel like a “buy now or miss out” moment. Don’t. Wait for the line to relax back toward the inner 100 % band (roughly the raw ±0.003 zone on H4). You’ll enter at a discount and with the GAP-arrow already confirming the next push.
2. Trying to trade every session.
Liquidity thins outside a currency’s home market. Stick to London and New-York hours unless your pair involves an Asian leg (JPY, AUD, NZD). The moves that matter almost always start when at least one side is awake.
3. Ignoring correlation clusters.
Going long EURGBP and short GBPUSD at the same time might feel diversified, but if the meter shows GBP deep in the red you’ve simply doubled your sterling risk. Pair one strong line with one weak linenever stack trades that lean on the same base currency.
4. Believing the meter is a stand-alone trigger.
The Indicator is a flow detector, not an entry robot. Layer it with plain price action trend line breaks, break and retest, engulfing candles so the chart itself agrees with the strength story.
5. Flipping the moment lines cross zero.
The first cross is often noise, especially on lower timeframes. Hold fire until a fresh H4 gap of about 0.005 appears; then you’re trading a genuine rotation, not a jitter.
Frequently Asked Questions
Q 1. Can I automate this strategy?
Yes. The Indicator exposes buffers for every strength line, the momentum curve, and the GAP arrow status. Code your EA to read those values, check your raw gap thresholds (≈0.005 H4, 0.004 H1), and launch trades when the M15 candle pattern prints. Add a news-filter so the bot stands aside during red-flag releases.
Q 2. Will my broker’s feed change the readings?
Minor spread differences barely nudge the raw numbers. Test on a demo: if you still see gaps of roughly 0.005 or more on H4, your data is fine.
Q 3. Does it repaint?
Never on a closed candle. The live bar does wiggle as ticks arrive, so base decisions on closed values—or accept the intrabar noise.
Q 4. Can I adjust currency weightings?
The default build uses equal weights. If you’re comfortable in MQL you can edit the weighting array; otherwise, the stock mix is already well-balanced.
Q 5. How do I avoid over-trading?
Treat the meter as a filter, not a signal machine. Aim for one or two high-quality setups per session and keep a hard cap of two open positions with different base currencies. Ignoring half-baked gaps is the fastest way to lift your win rate.
Conclusion
The Currency Strength Meter takes the noise of 28 currency pairs and distills it into one live, colour-coded gauge. When you anchor your plan to clear, repeatable raw-gap rules (≈ 0.005 on H4, ≈ 0.003 after a pullback), check the momentum arrow, respect the MFib bands, and add a straightforward price-action trigger, the tool stops being a flashy overlay and starts acting like a rules-based engine.
The real edge isn’t “seeing” which line is on top anyone can load the indicator. The edge comes from acting only when the dashboard, the candle, and your risk plan line up, sizing modestly, and letting the market do the heavy lifting once you’re in.