

Trading in the forex market can feel overwhelming at first price charts move fast, trends shift without warning, and it’s easy to get lost in the noise. That’s where forex indicators come in. These are built-in tools on your trading platform that turn raw market data into clear, visual signals, helping you understand whether a currency pair is trending, ranging, overbought, oversold, or primed for a breakout.
In this Forex Indicators Guide, we’ll break down the most useful types of indicators trend, momentum, volatility, and support/resistance and explain how they work, when to use them, and how to combine them for stronger trade setups. You’ll learn common settings, see practical examples, and discover simple indicator combinations that filter out bad trades and improve timing.
Table of Contents
What Are Forex Indicators?
Forex indicators are mathematical formulas applied to a currency pair’s price data, and sometimes its volume or tick data, to help traders interpret what’s happening in the market. They’re displayed visually often as lines, histograms, or overlays directly on your chart, making it easier to identify:
- Trend direction – Is the market moving up, down, or sideways?
- Momentum strength – How strong or weak is the current move?
- Volatility – Is price moving in wide swings or staying compressed?
- Support and resistance zones – Where might price stall, reverse, or break out?
Unlike “predictions” or guaranteed signals, forex indicators highlight probabilities. They take raw market activity and transform it into patterns and measurements you can analyze helping you make decisions based on evidence, not guesswork.
Not sure which indicators to use? Our Top 10 Free MT4 Indicators guide reviews the best tools with complete trading strategies.
Understanding Volume in Forex Charts
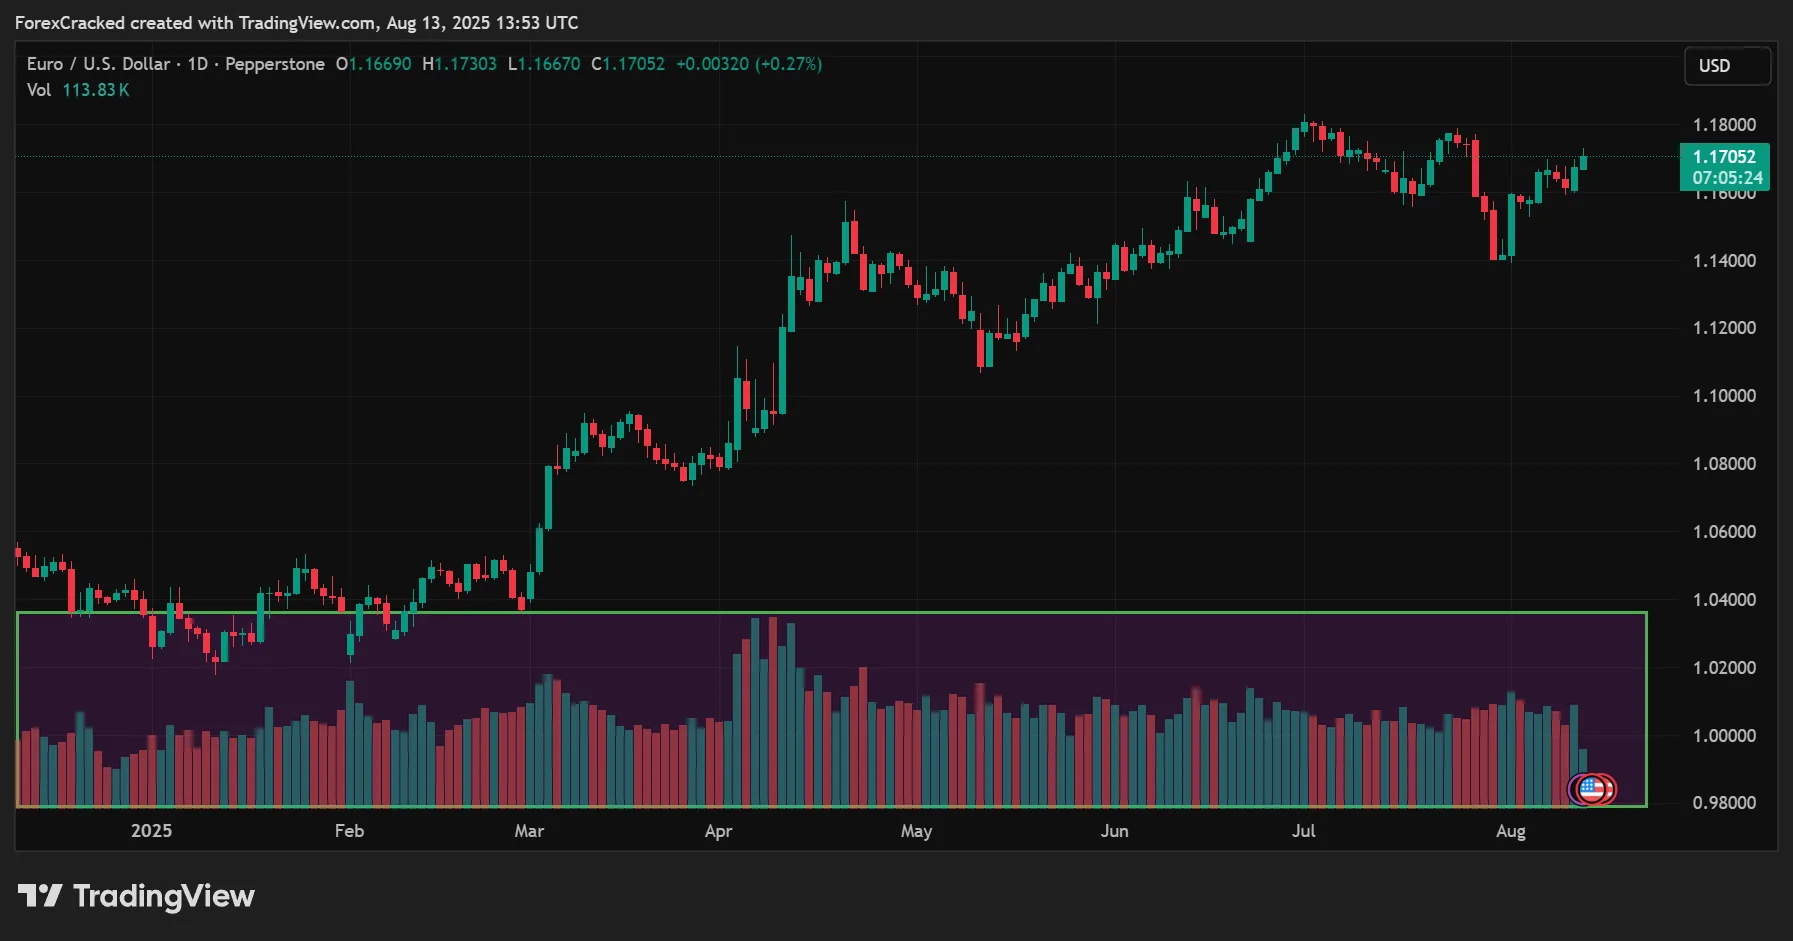
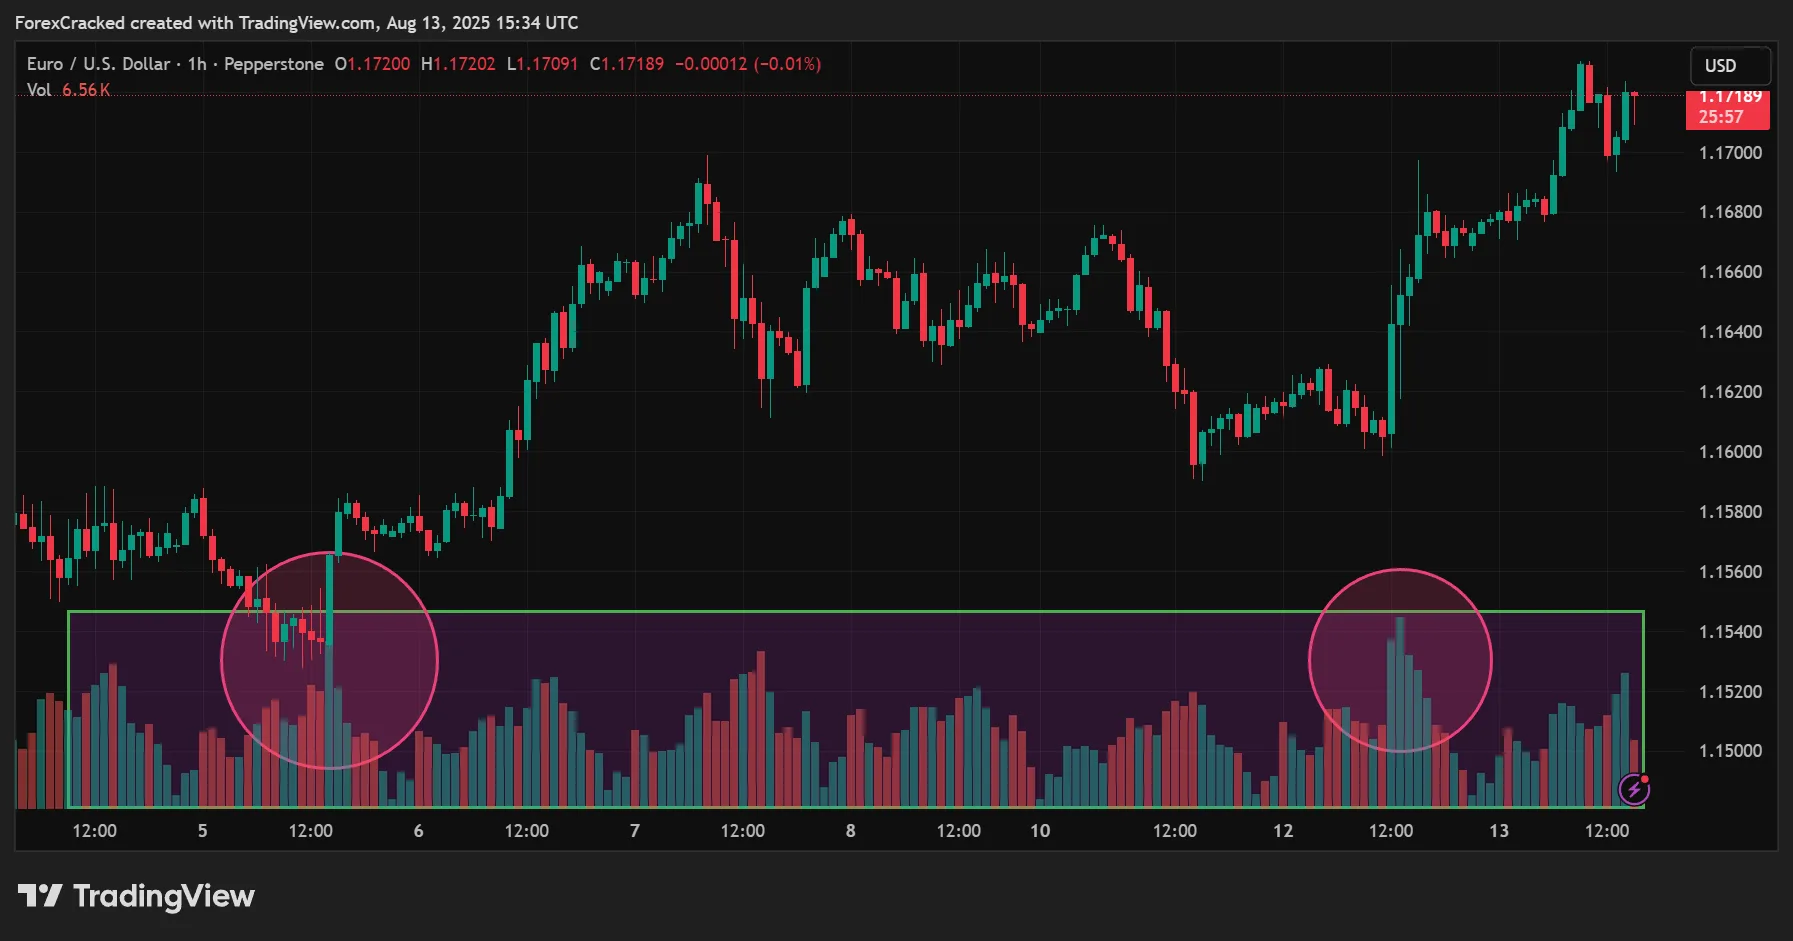
In spot forex, there’s no central exchange tracking all trades, so the “volume” you see is usually tick volume the number of times price changes within a given period. While it doesn’t represent the exact number of contracts or lots traded, tick volume is still a reliable proxy for market activity. Higher tick volume often means more participation and potentially stronger moves, while low tick volume can indicate quieter market conditions.
By learning how different indicators process price and volume data, you can start reading the market’s “language” more clearly and choose trades that align with the bigger picture.
How Forex Indicators Work (and Their Limitations)

Forex indicators take historical market data mainly price and sometimes volume or tick activity and run it through a formula to produce a visual output on your chart. This output helps traders interpret what’s happening beneath the surface of price action.
Indicators Are Derived From Price
Most indicators are calculated directly from price movements:
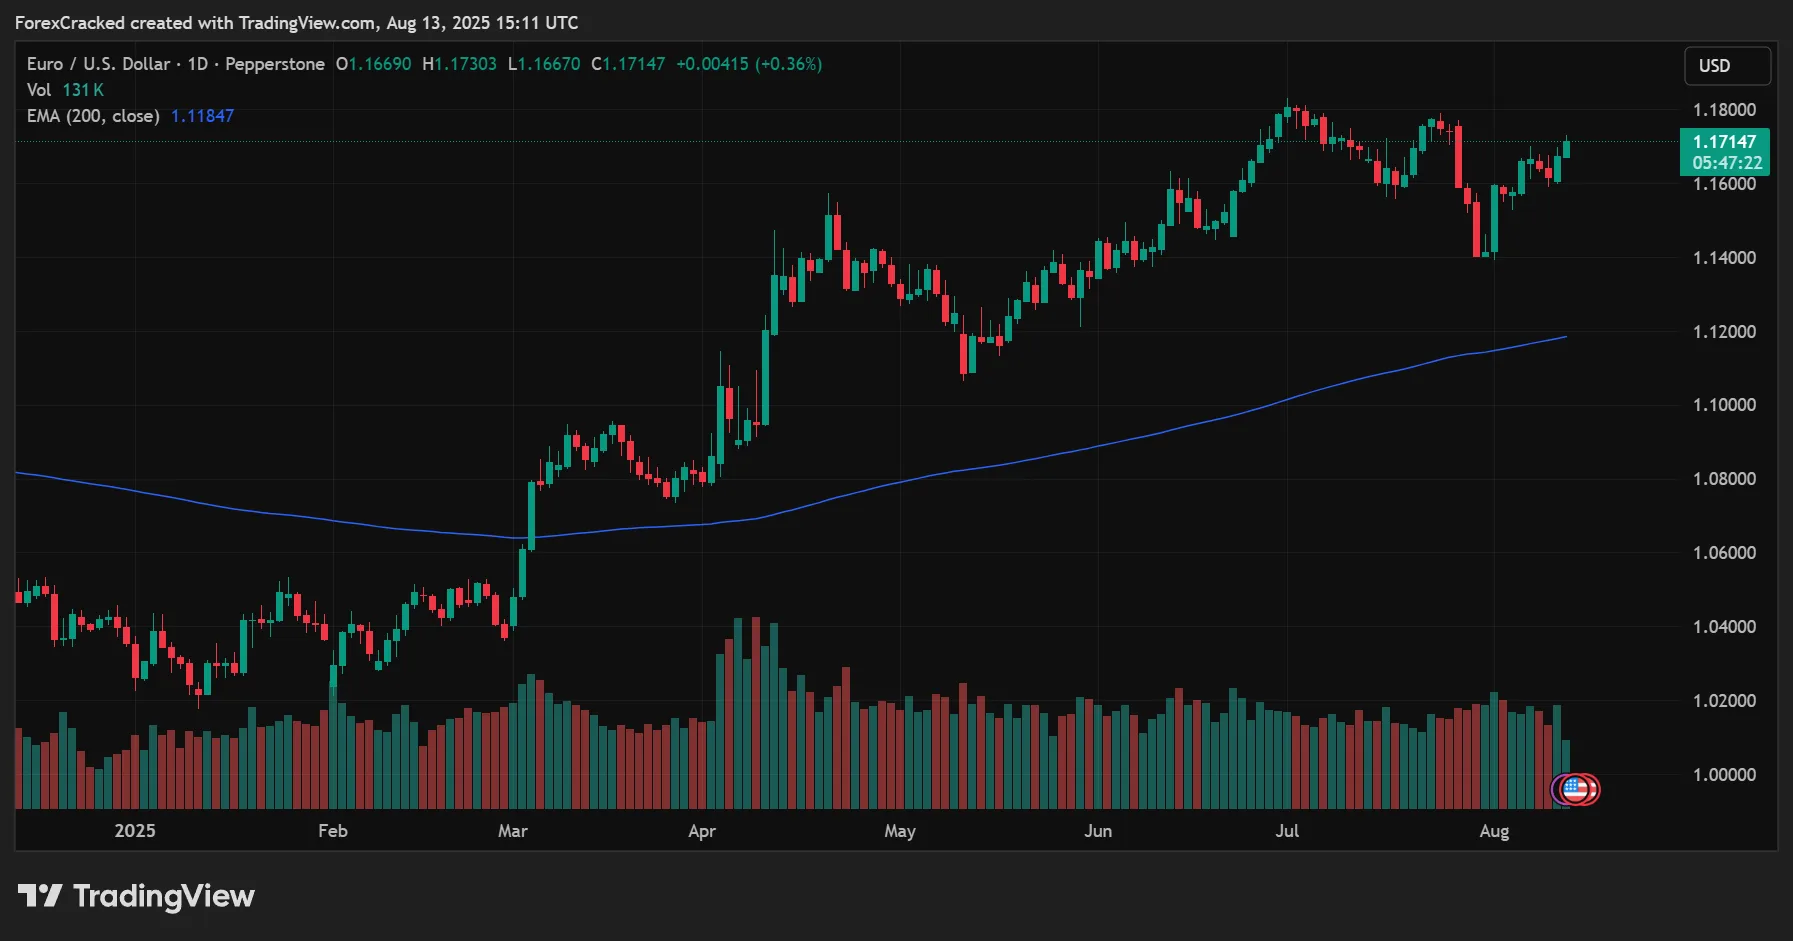
- Moving Averages (MAs) smooth out short-term fluctuations, revealing the underlying trend direction.
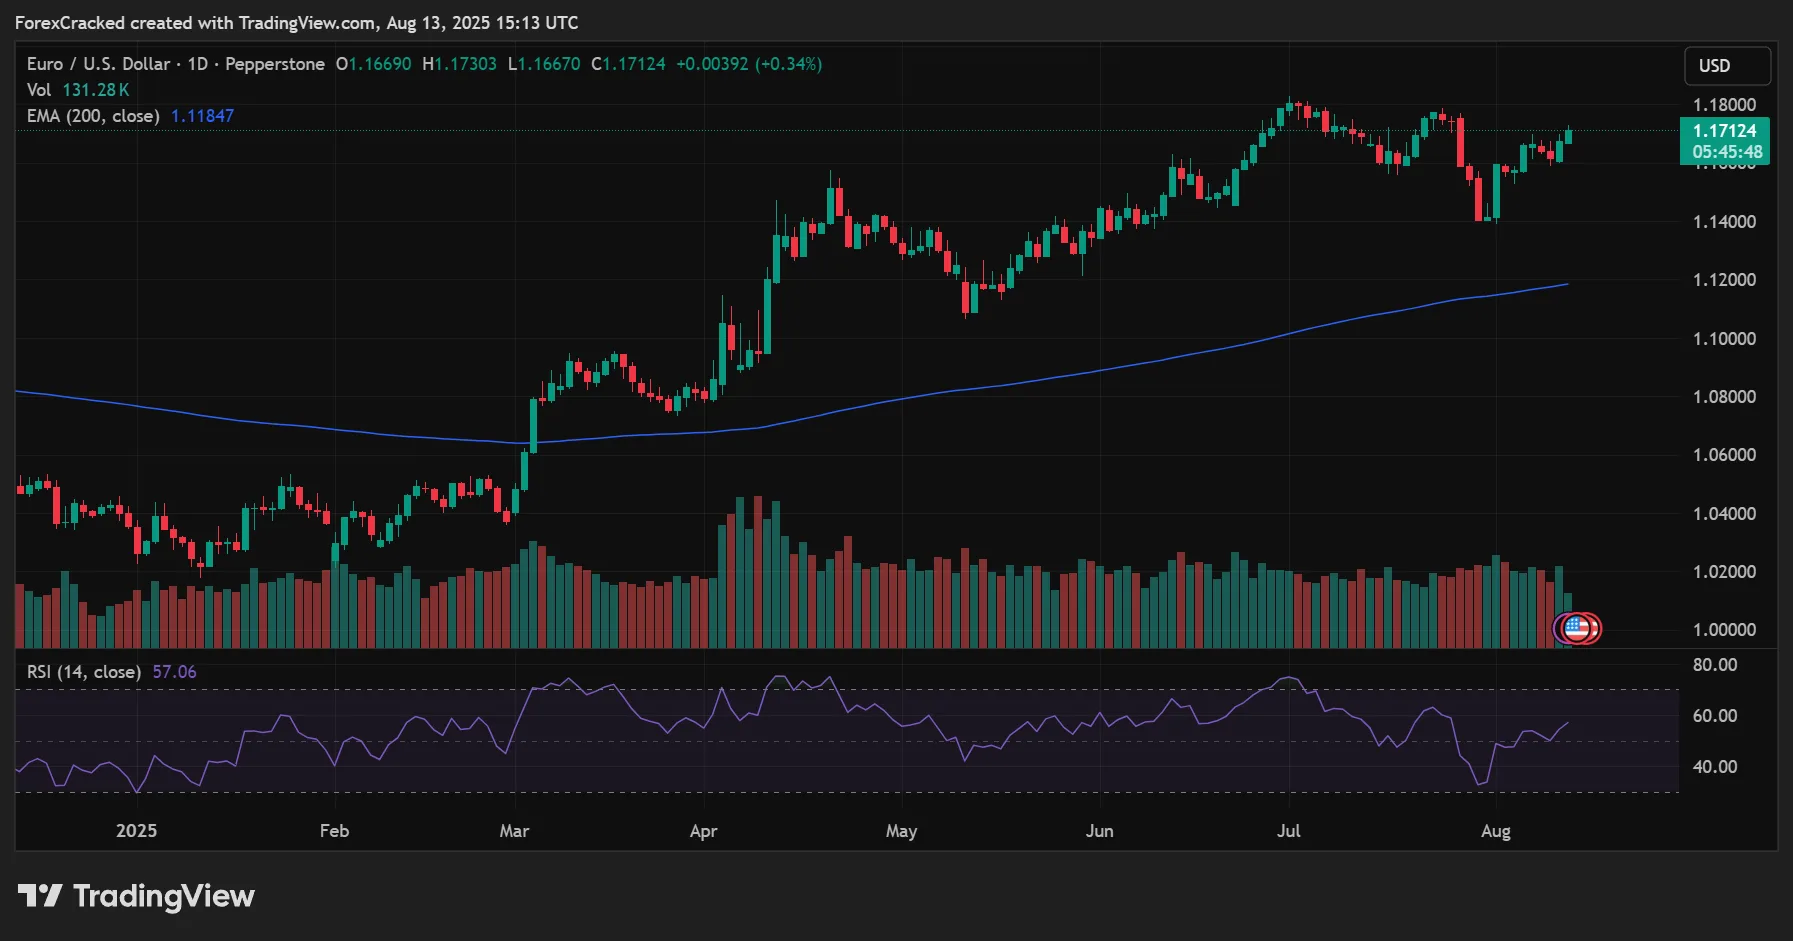
- Oscillators like RSI or Stochastic measure price relative to a recent range, highlighting overbought or oversold conditions.
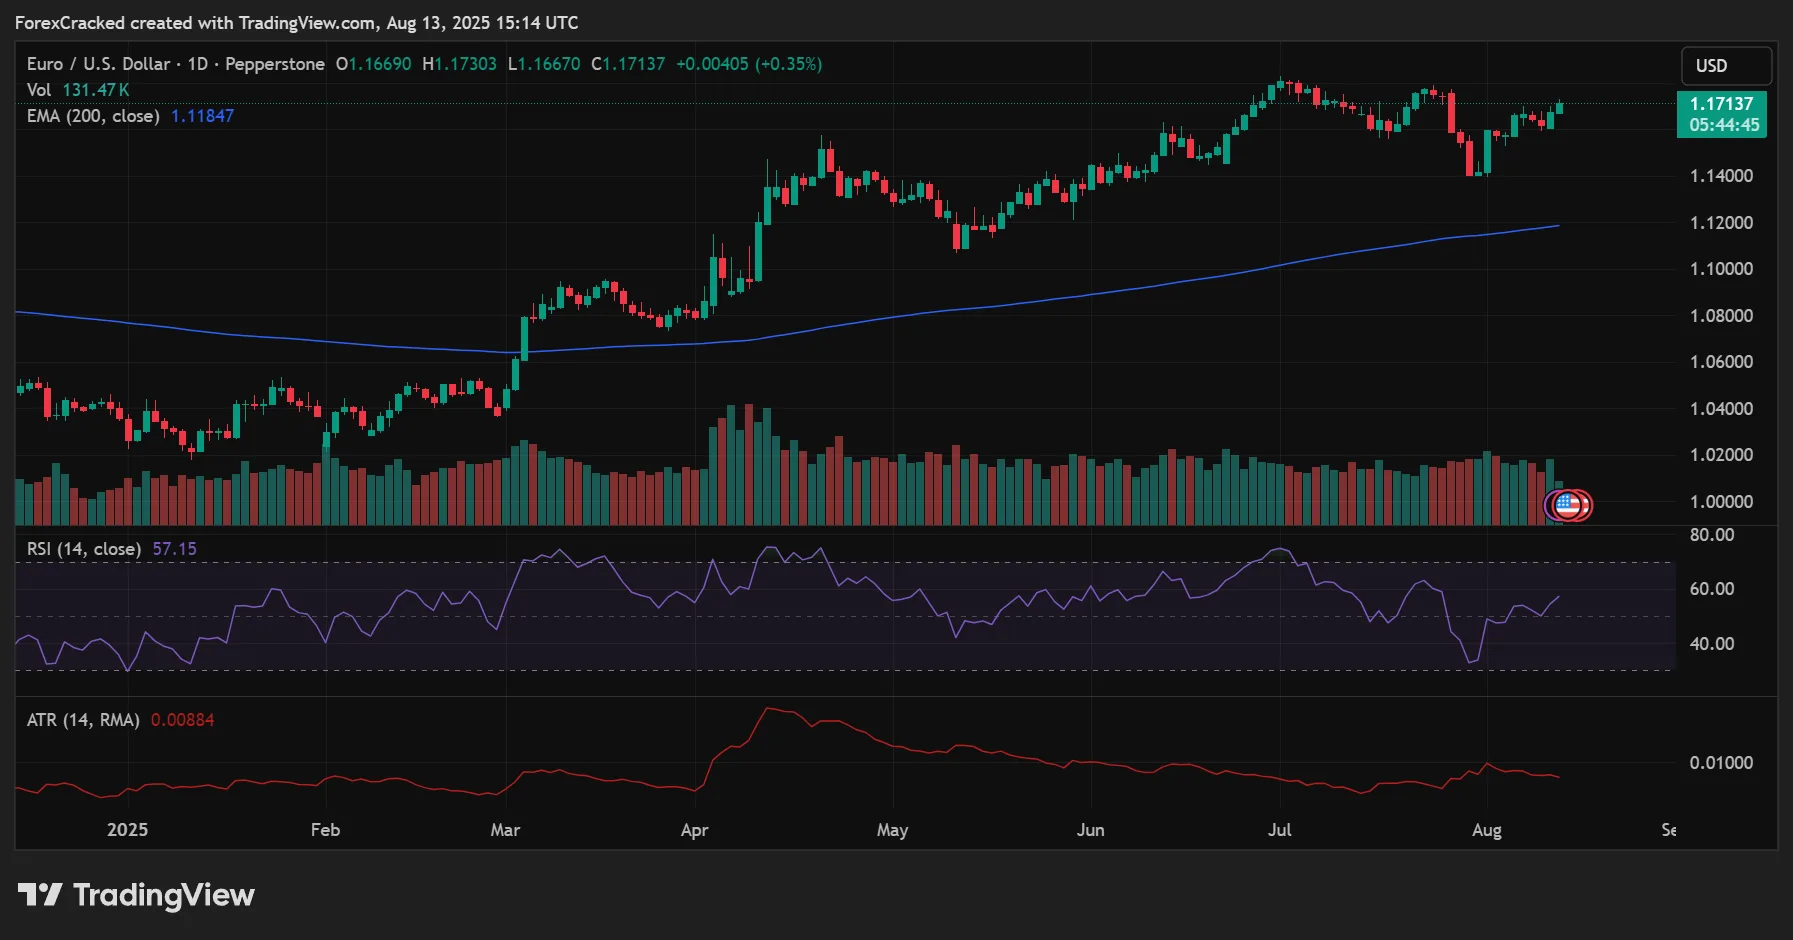
- Volatility tools such as ATR or Bollinger Bands track how much price is expanding or contracting, signaling potential breakouts or quiet periods.
Because they’re based on past data, indicators don’t “know” the future they simply translate raw numbers into patterns and metrics you can act on.
Leading vs Lagging Indicators
Indicators generally fall into two categories:
- Leading indicators (e.g., RSI, Stochastic) react quickly to price changes and can signal potential reversals early. They’re useful for spotting turning points but can produce false alarms.
- Lagging indicators (e.g., moving averages, MACD) react more slowly, helping confirm trends after they’ve begun. They filter out noise but may enter late.
A balanced strategy often uses both a leading indicator for timing entries and a lagging indicator to validate the overall trend.
Why No Indicator Works in Isolation
No single indicator is perfect. Markets are dynamic, and what works in one condition might fail in another. That’s why experienced traders use indicators in combination with price action, support/resistance analysis, and sound risk management.
In short: Indicators are powerful tools, but they work best as part of a complete trading plan, not as stand-alone decision-makers.
Types of Forex Indicators
Forex indicators can be grouped into four main categories: trend, momentum, volatility, and support/resistance. Each category plays a different role in your trading strategy, and combining them can give you a more complete market picture.
Trend Indicators – Identifying Market Direction
Trend indicators help you see whether the market is moving up, down, or sideways, filtering out short-term noise.
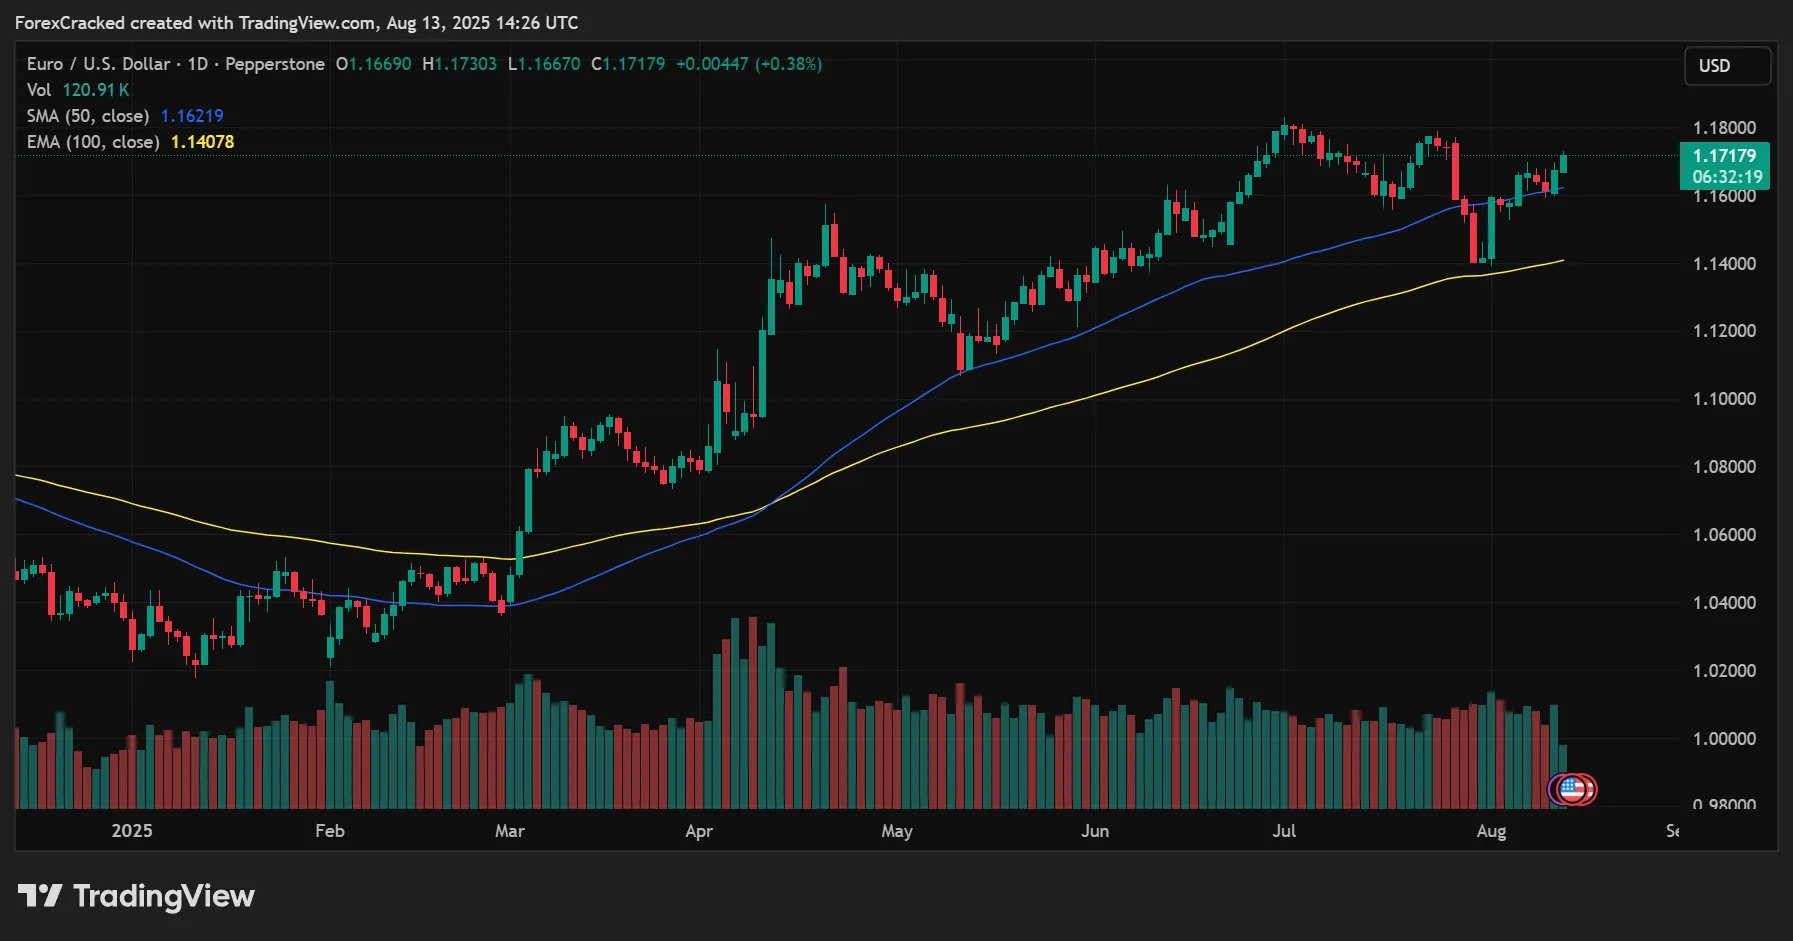
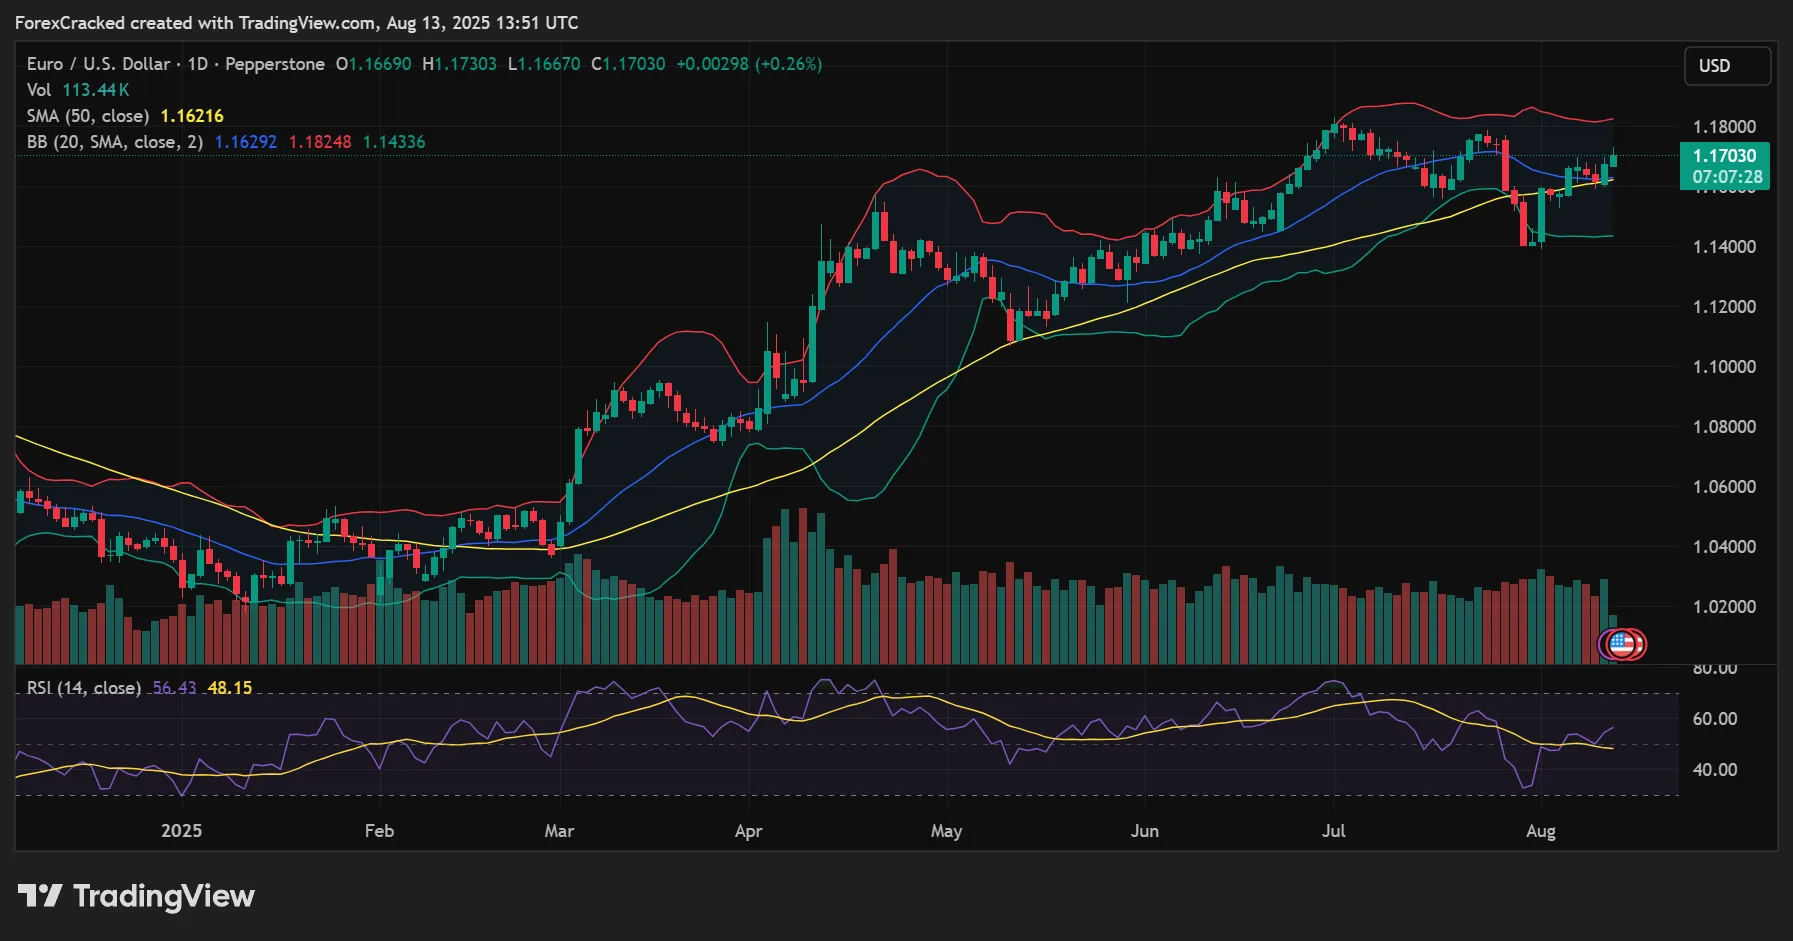
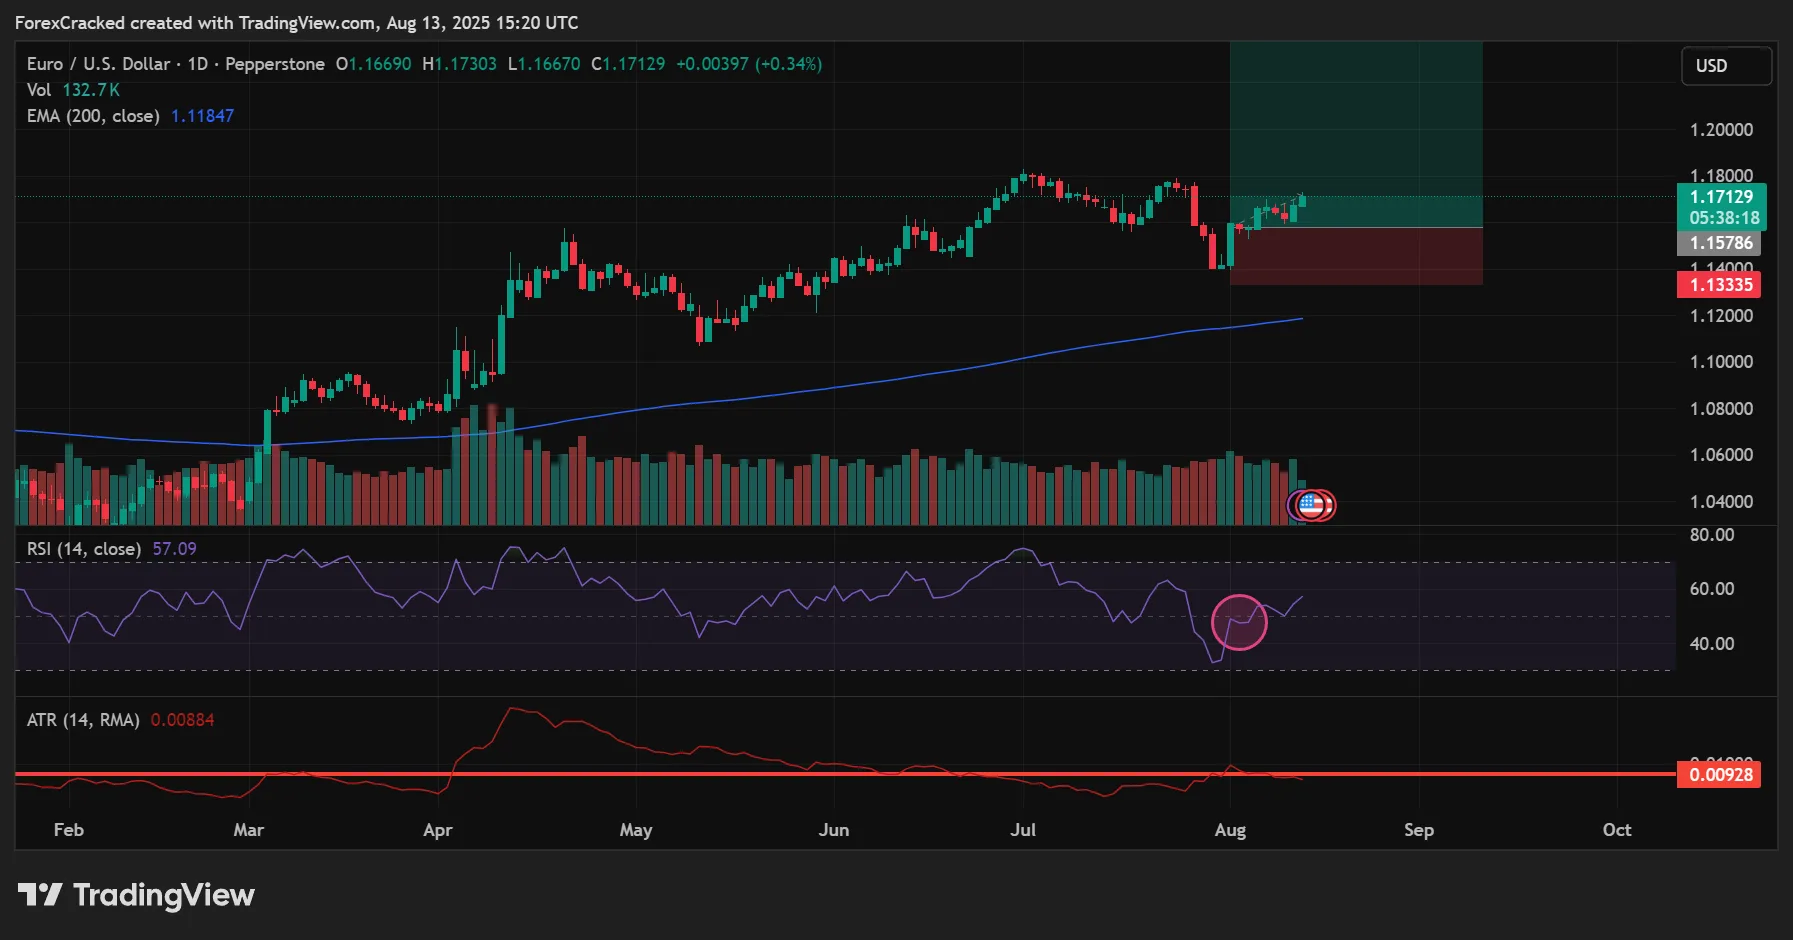
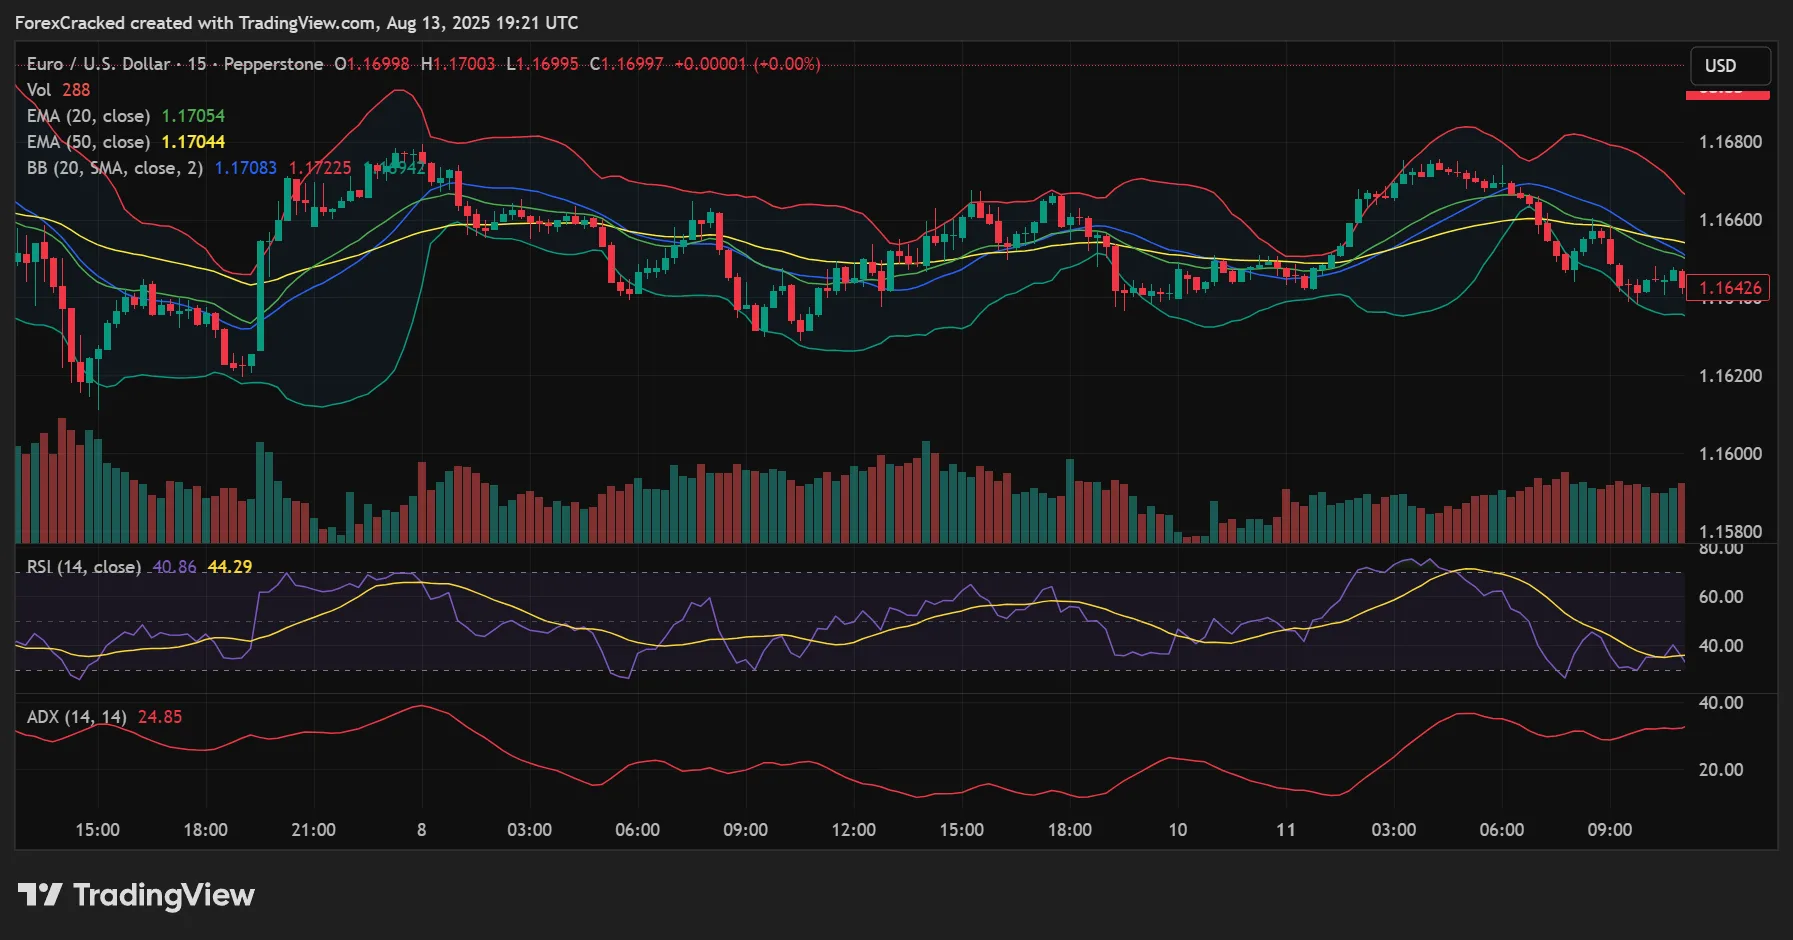
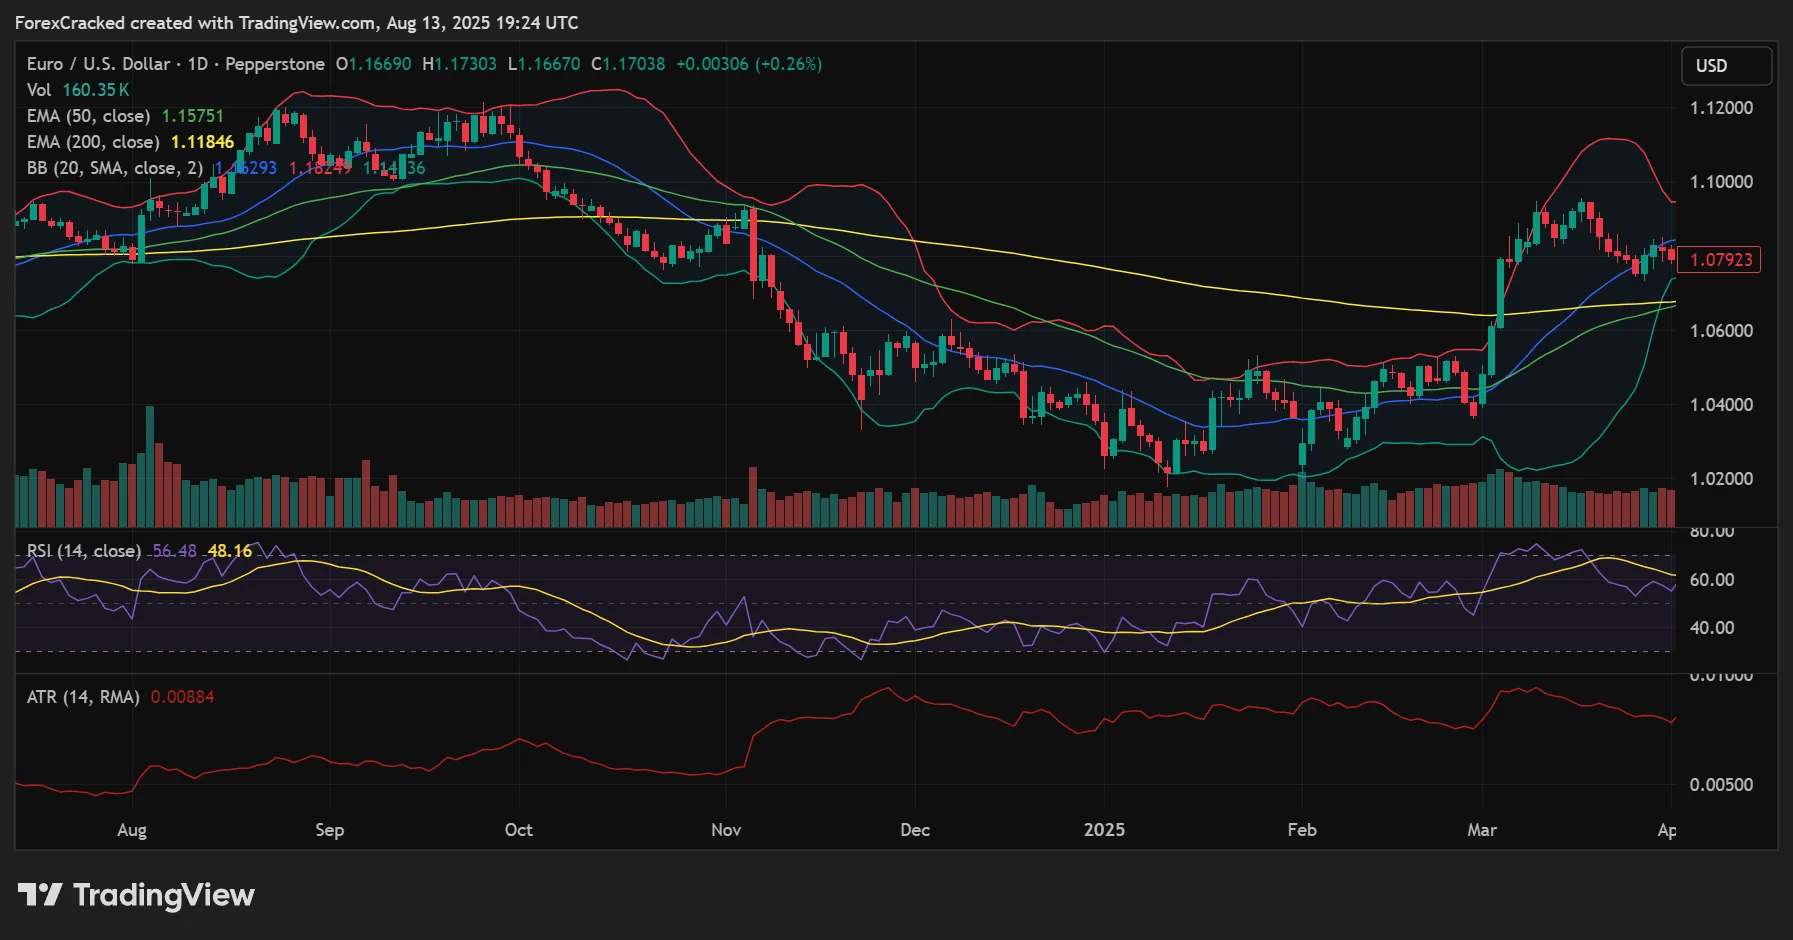
Moving Averages (SMA/EMA) – A Simple Moving Average (SMA) gives equal weight to all periods, while an Exponential Moving Average (EMA) reacts faster to recent price changes. Common setups include 20, 50, and 200 periods to define short-, medium-, and long-term trends.
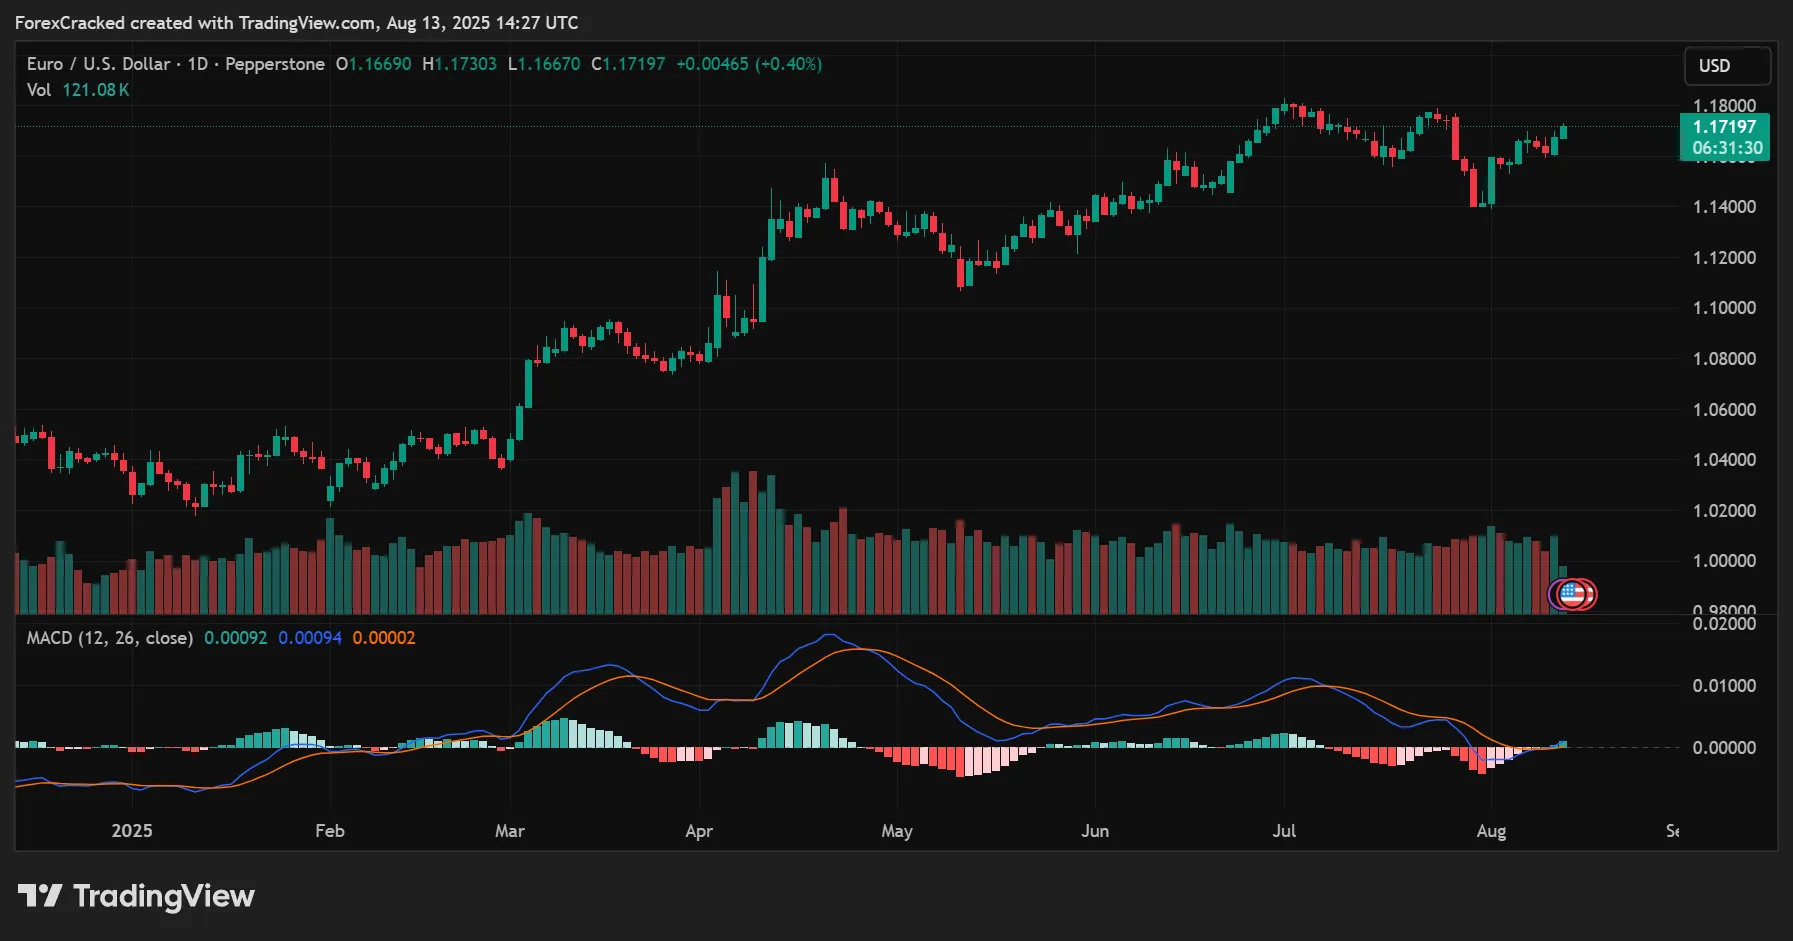
MACD (Moving Average Convergence Divergence) – Combines trend-following and momentum elements. Watch for the MACD line crossing above/below its signal line, zero-line crossovers, and bullish/bearish divergences.
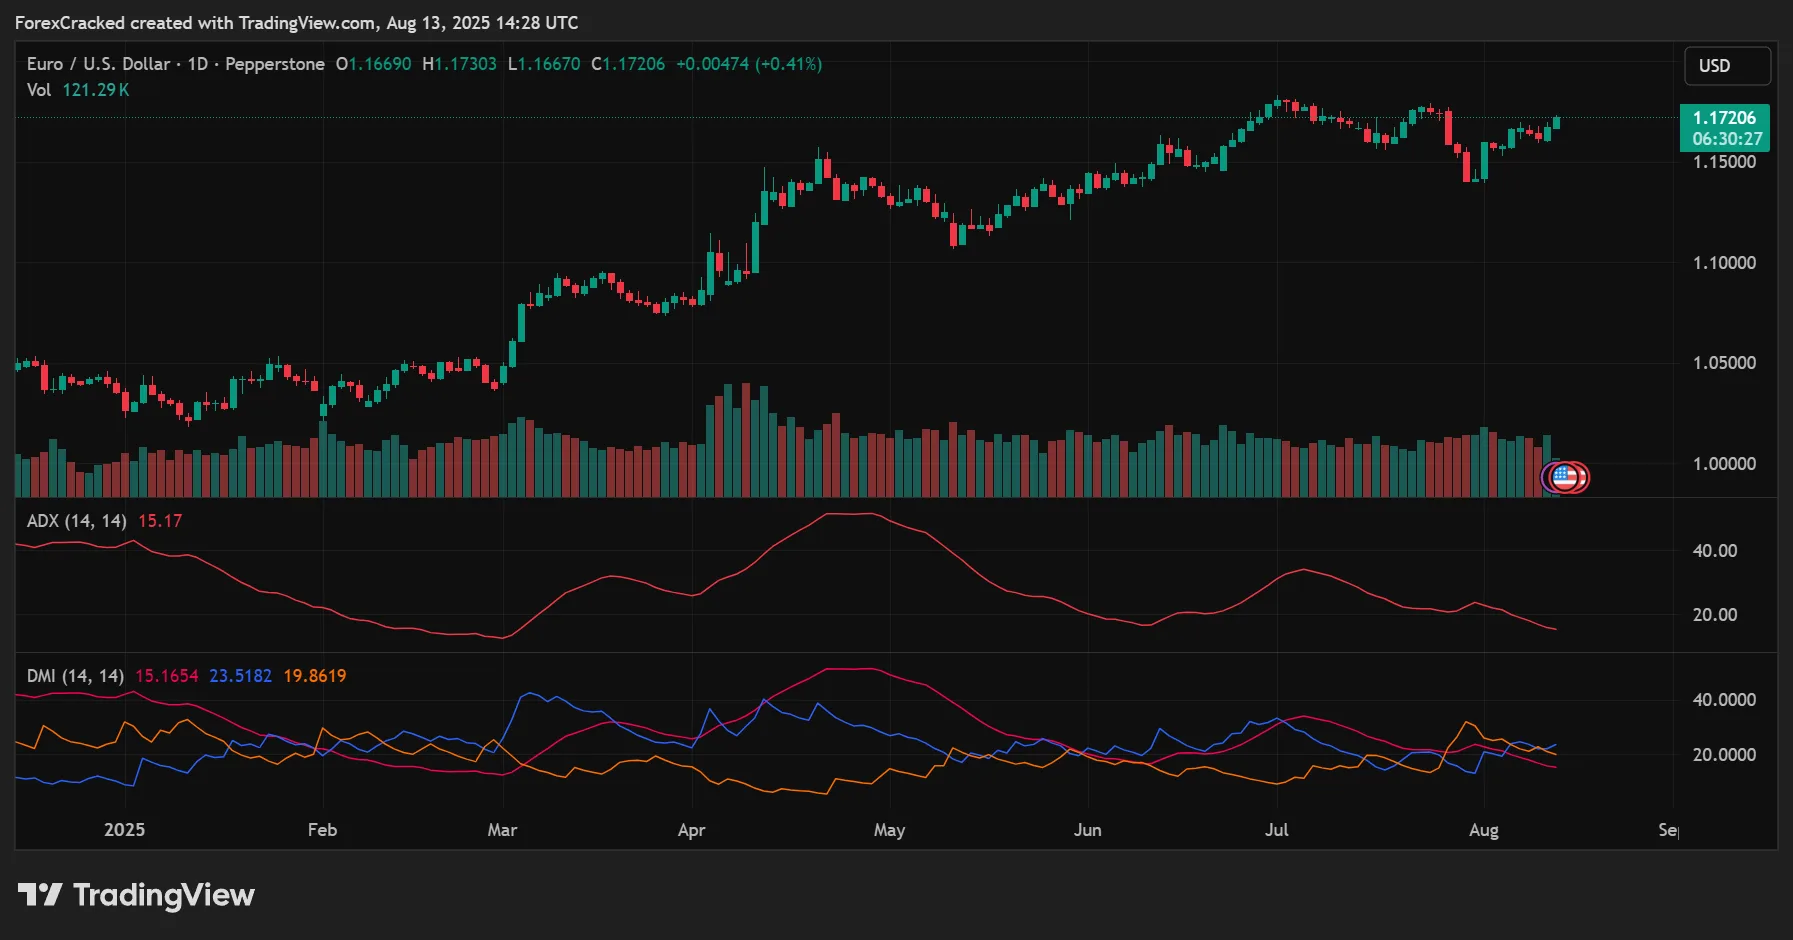
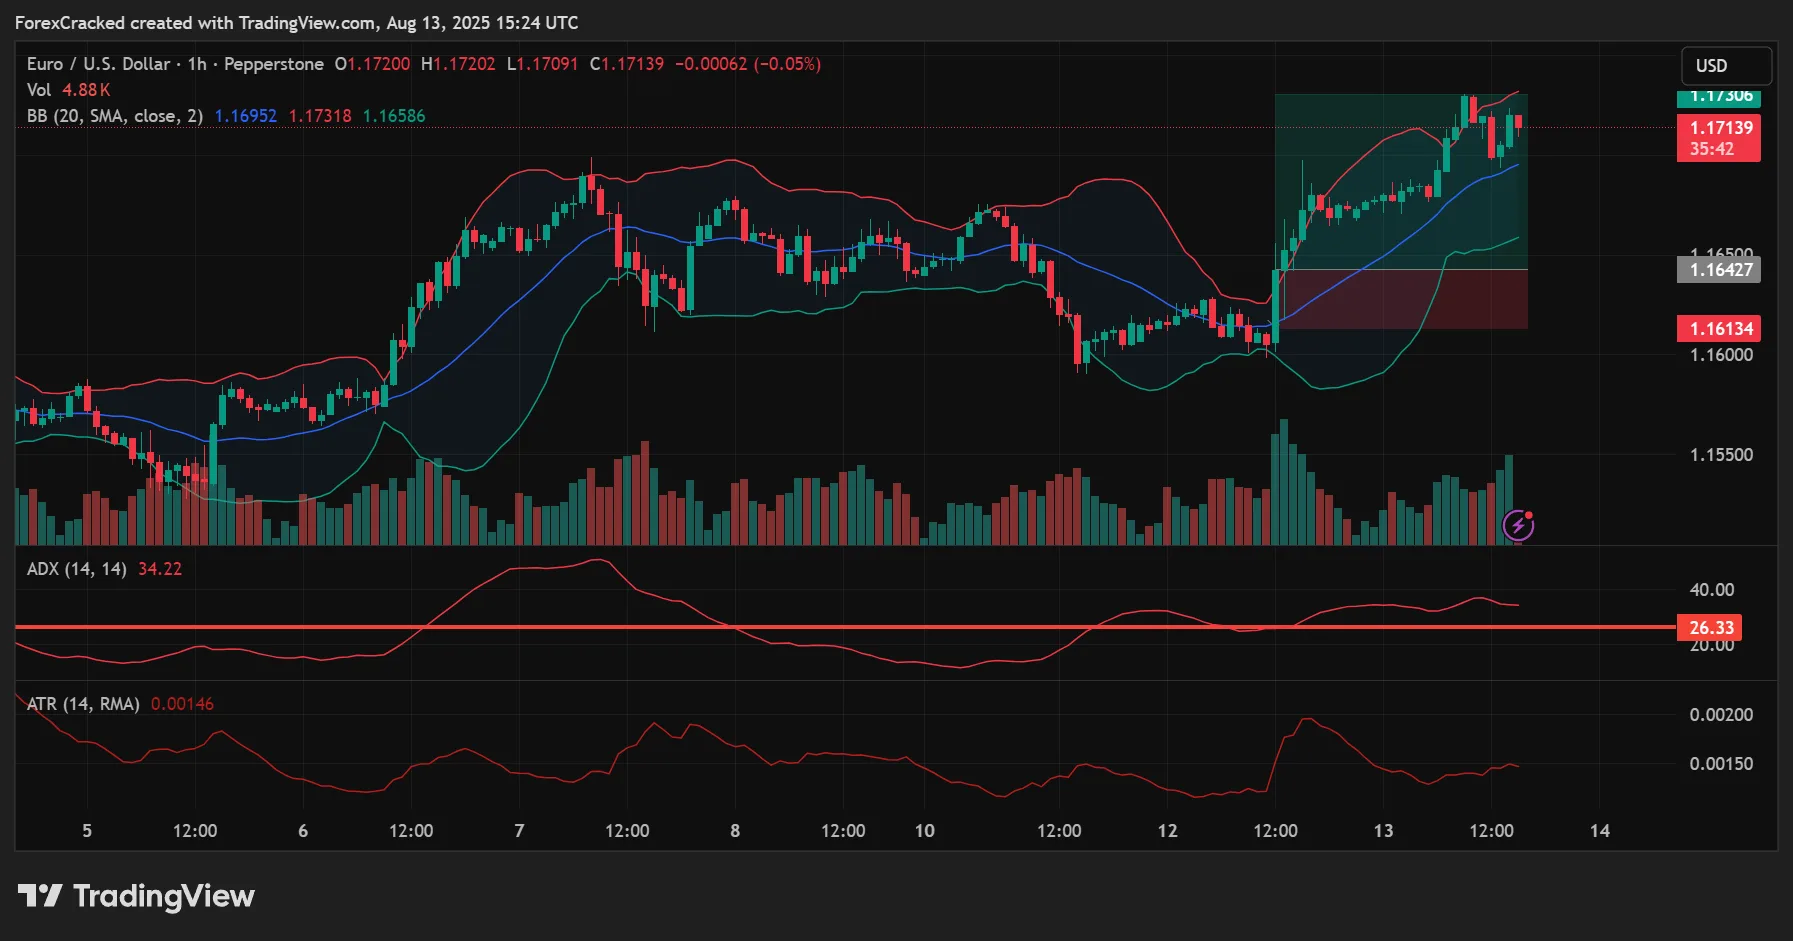
ADX/DMI (Average Directional Index / Directional Movement Index) – Measures trend strength. A reading above 25 often indicates a strong, tradable trend, while a low reading suggests a range-bound market.

Parabolic SAR – Displays dots above or below price, flipping sides when trend direction changes. Popular for setting trailing stops in trending markets.
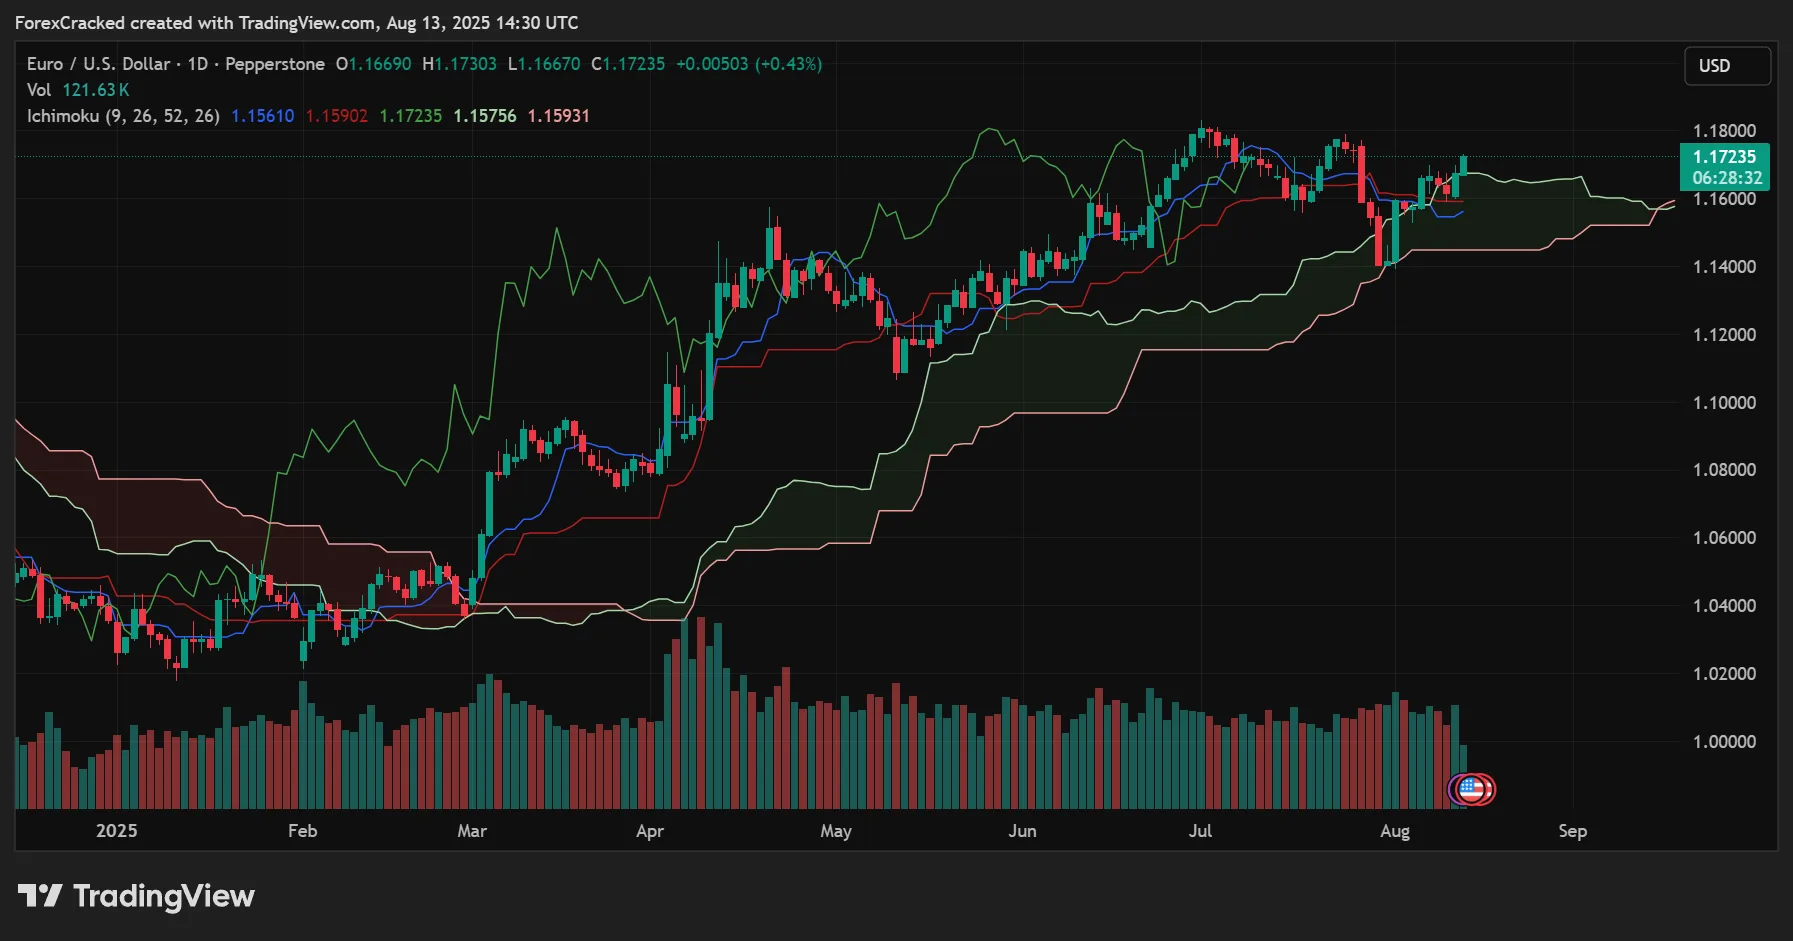
Ichimoku Cloud – A multi-component system showing trend, support/resistance, and momentum in one view. The “cloud” area helps you spot potential future S/R zones.
Momentum Indicators – Measuring Strength of Movement
Momentum indicators show how fast or slow price is moving, helping you time entries and exits.
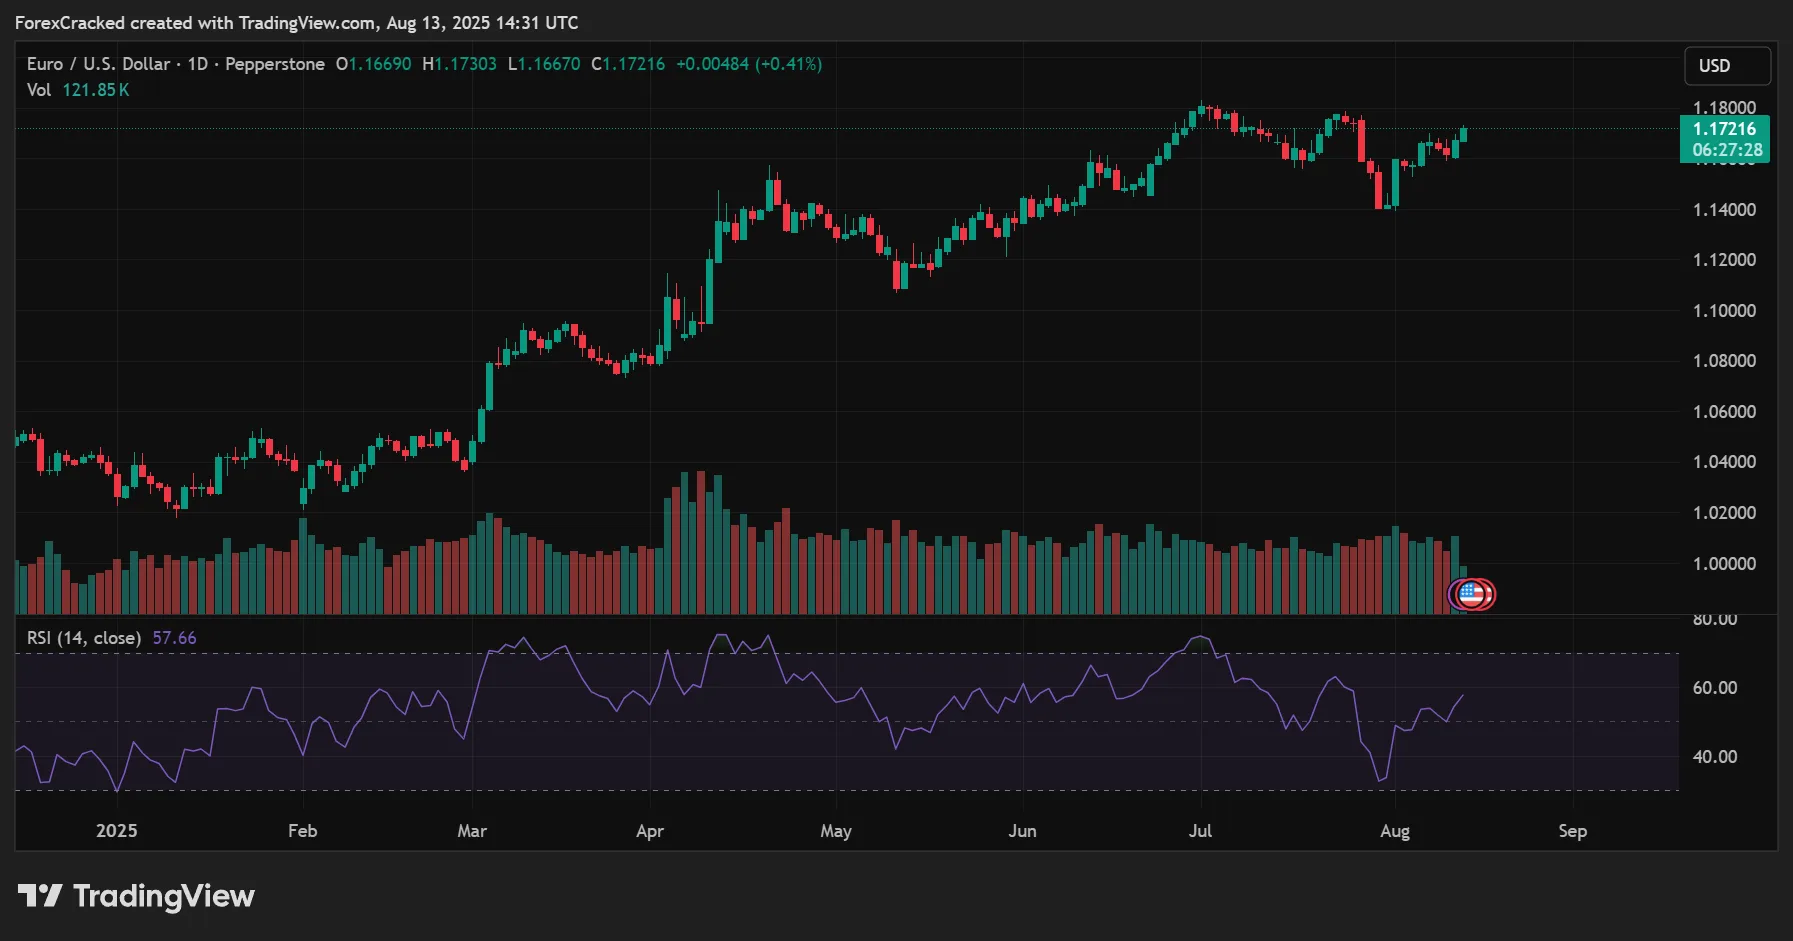
RSI (Relative Strength Index) – Typically set to 14 periods, RSI above 70 indicates overbought conditions, while below 30 signals oversold. Divergences between RSI and price can warn of possible reversals.
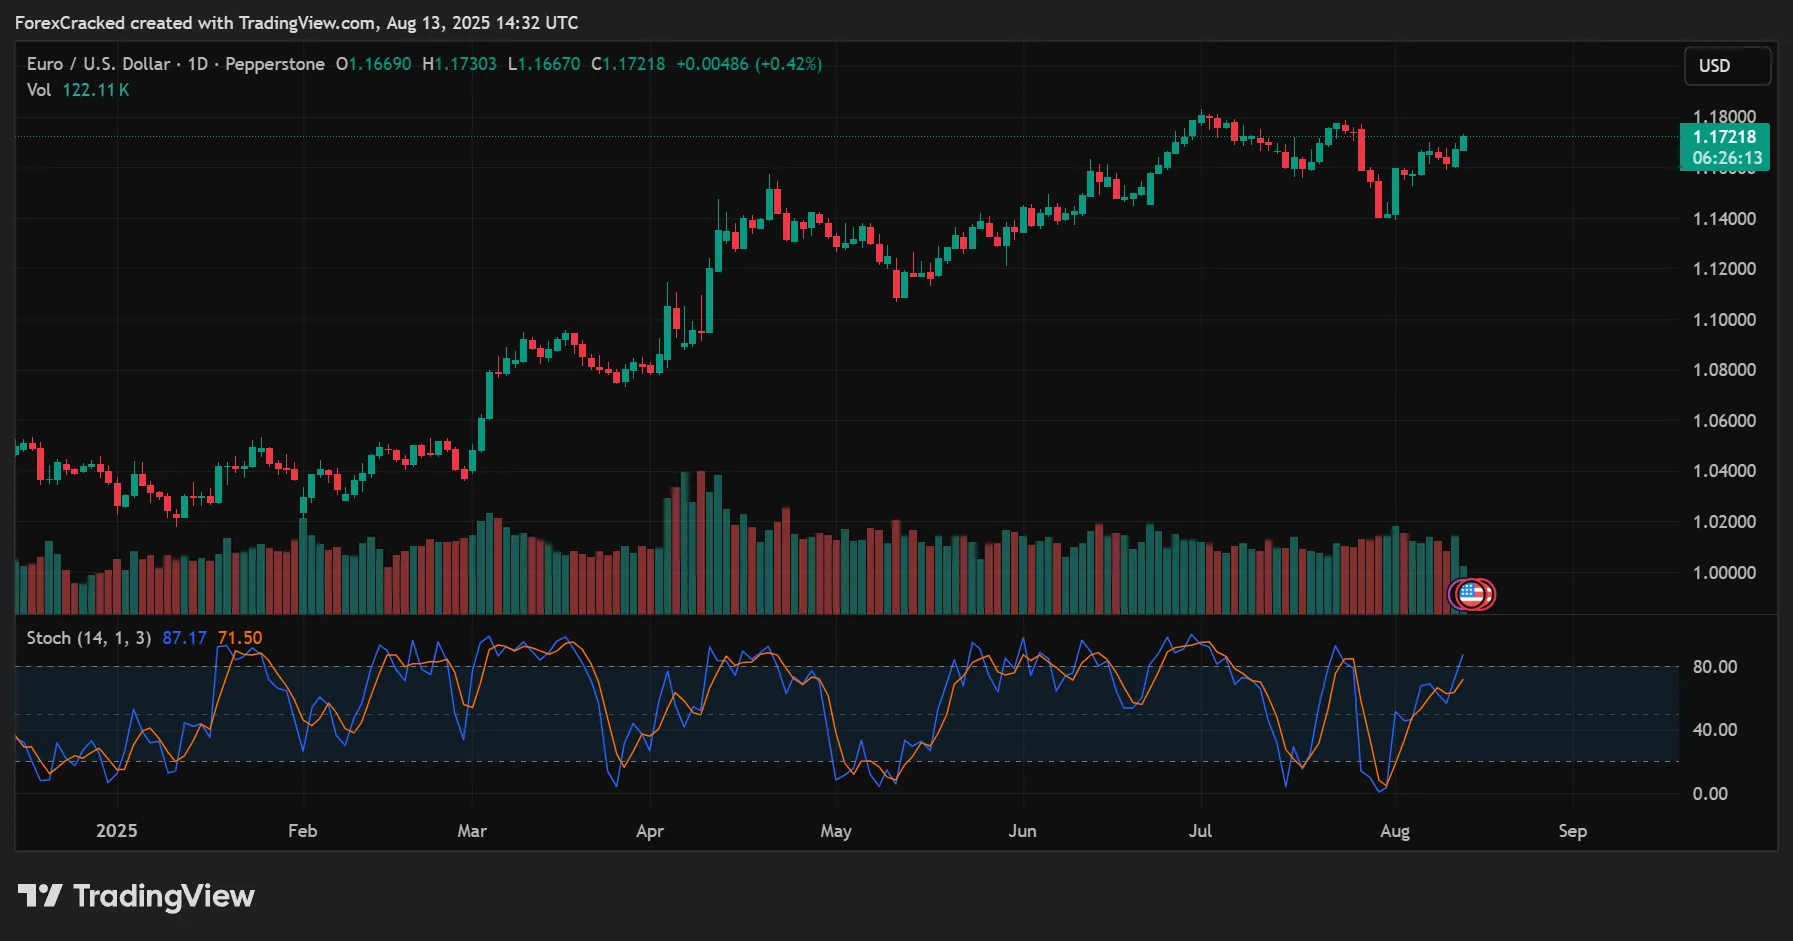
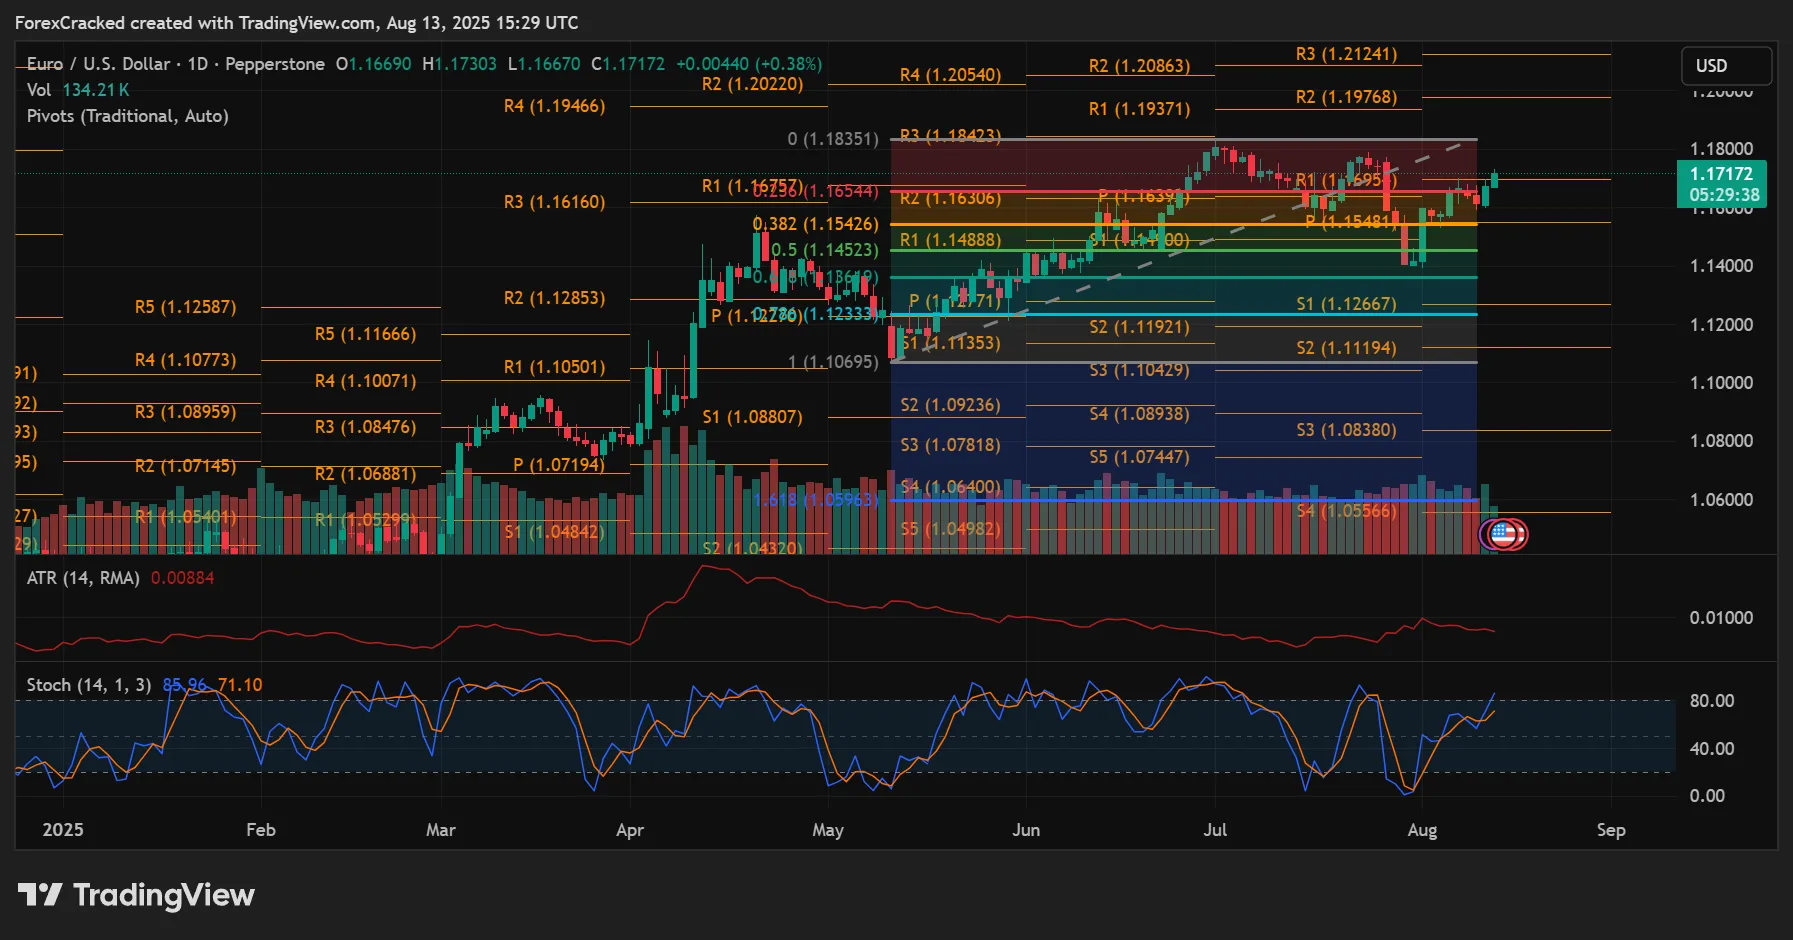
Stochastic Oscillator – Compares the closing price to its recent trading range. Readings above 80 are often overbought, and below 20 are oversold. Crossovers between the %K and %D lines can indicate shifts in momentum.
Volatility Indicators – Understanding Market Energy
Volatility tools help you gauge how much the market is moving, which is essential for stop-loss placement and trade sizing.
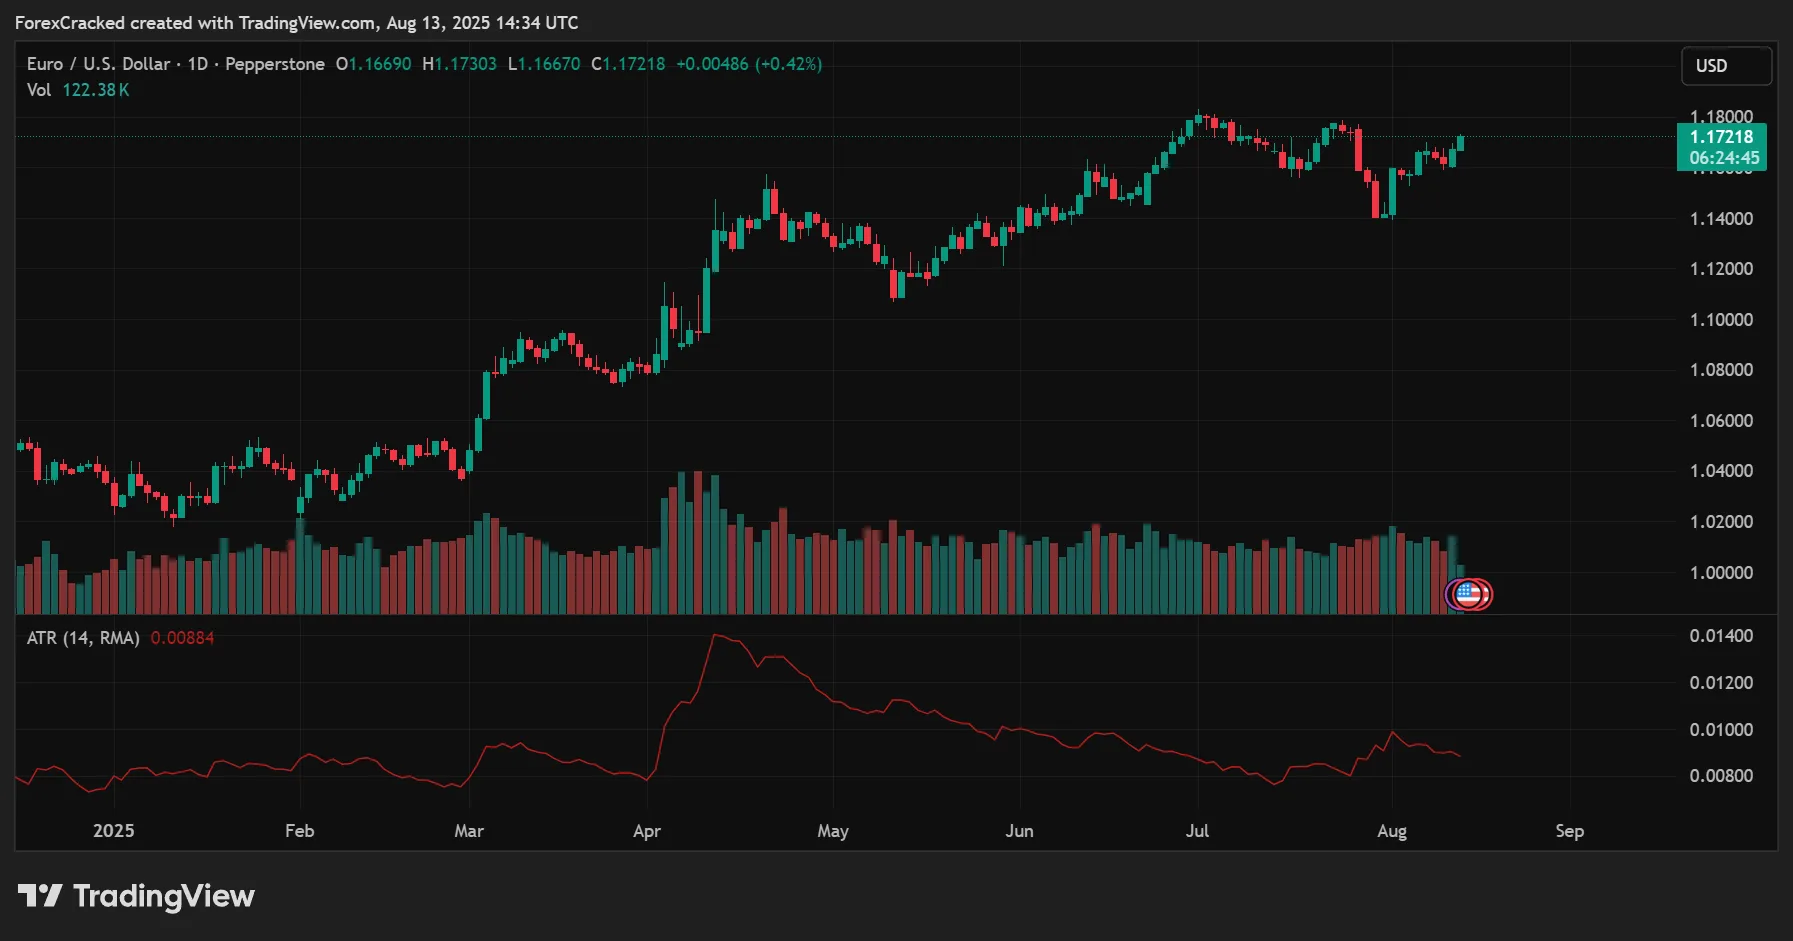
ATR (Average True Range) – Measures the average price movement over a set period (commonly 14). Higher ATR means more volatility, while lower ATR suggests calmer conditions. Traders often use ATR multiples for stops and targets.
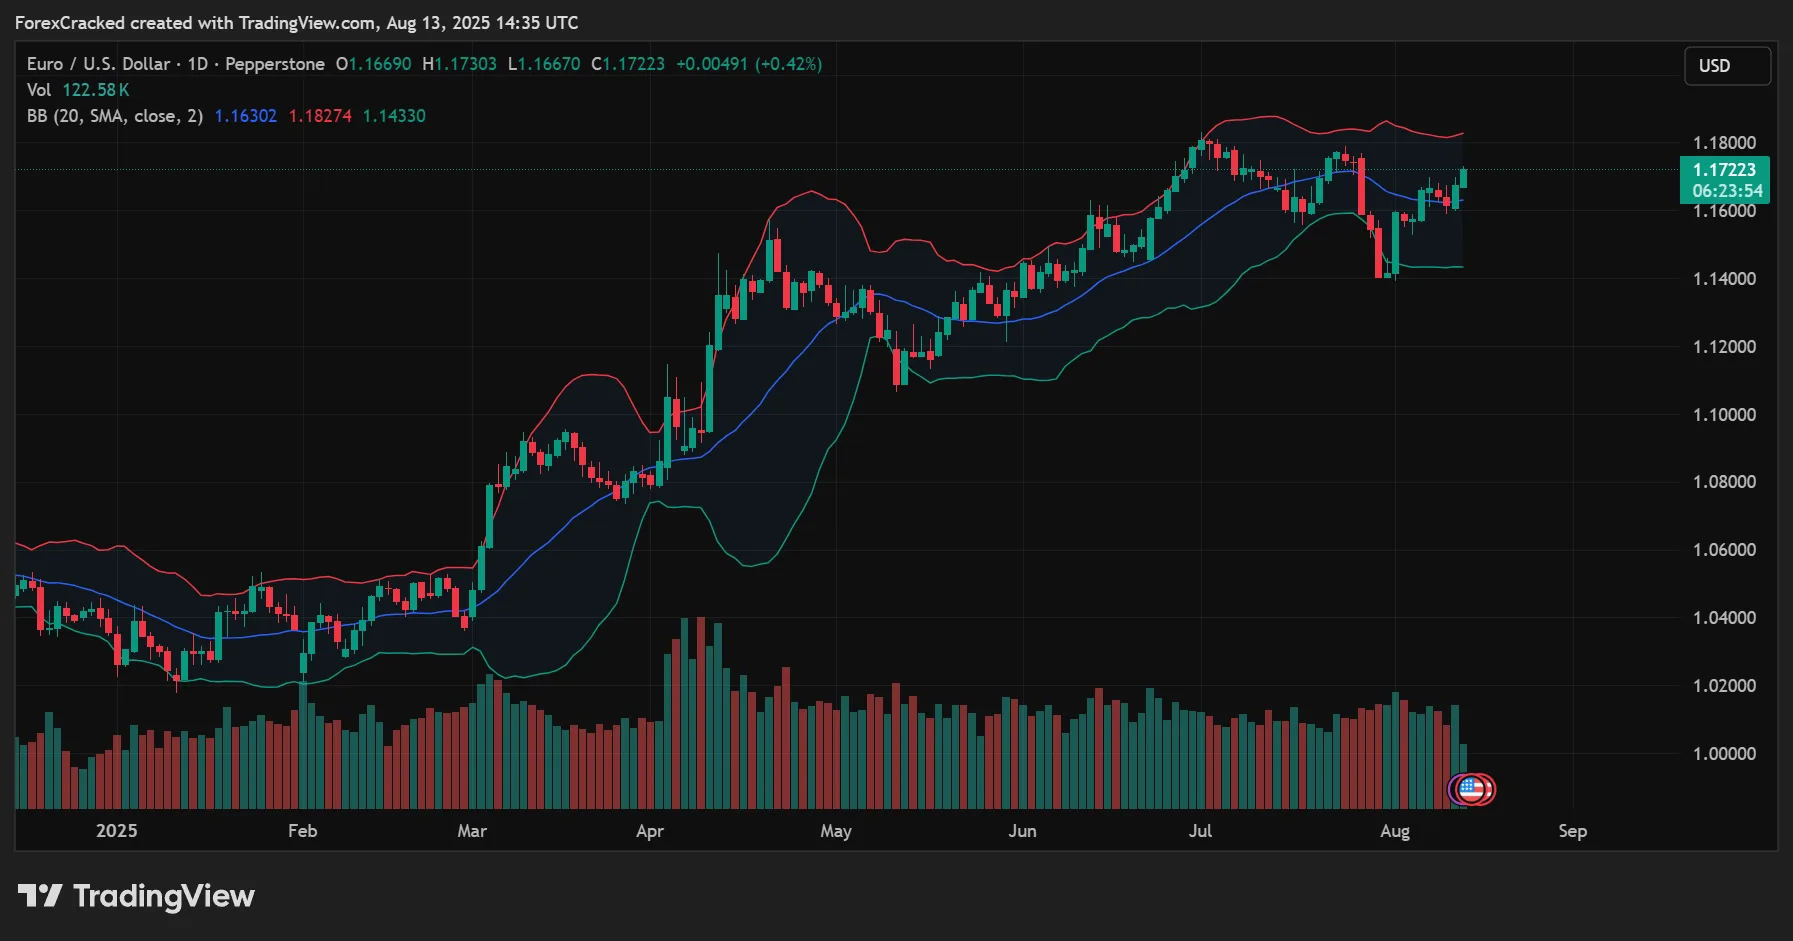
Bollinger Bands – Consist of a middle SMA with upper and lower bands set a certain number of standard deviations away (default is 20 SMA with ±2σ). Bands widen during high volatility and contract during low volatility, creating “squeeze” setups that often precede breakouts.
Support & Resistance Tools – Mapping Key Price Levels
Support and resistance tools help you anticipate where price might stall, reverse, or accelerate.
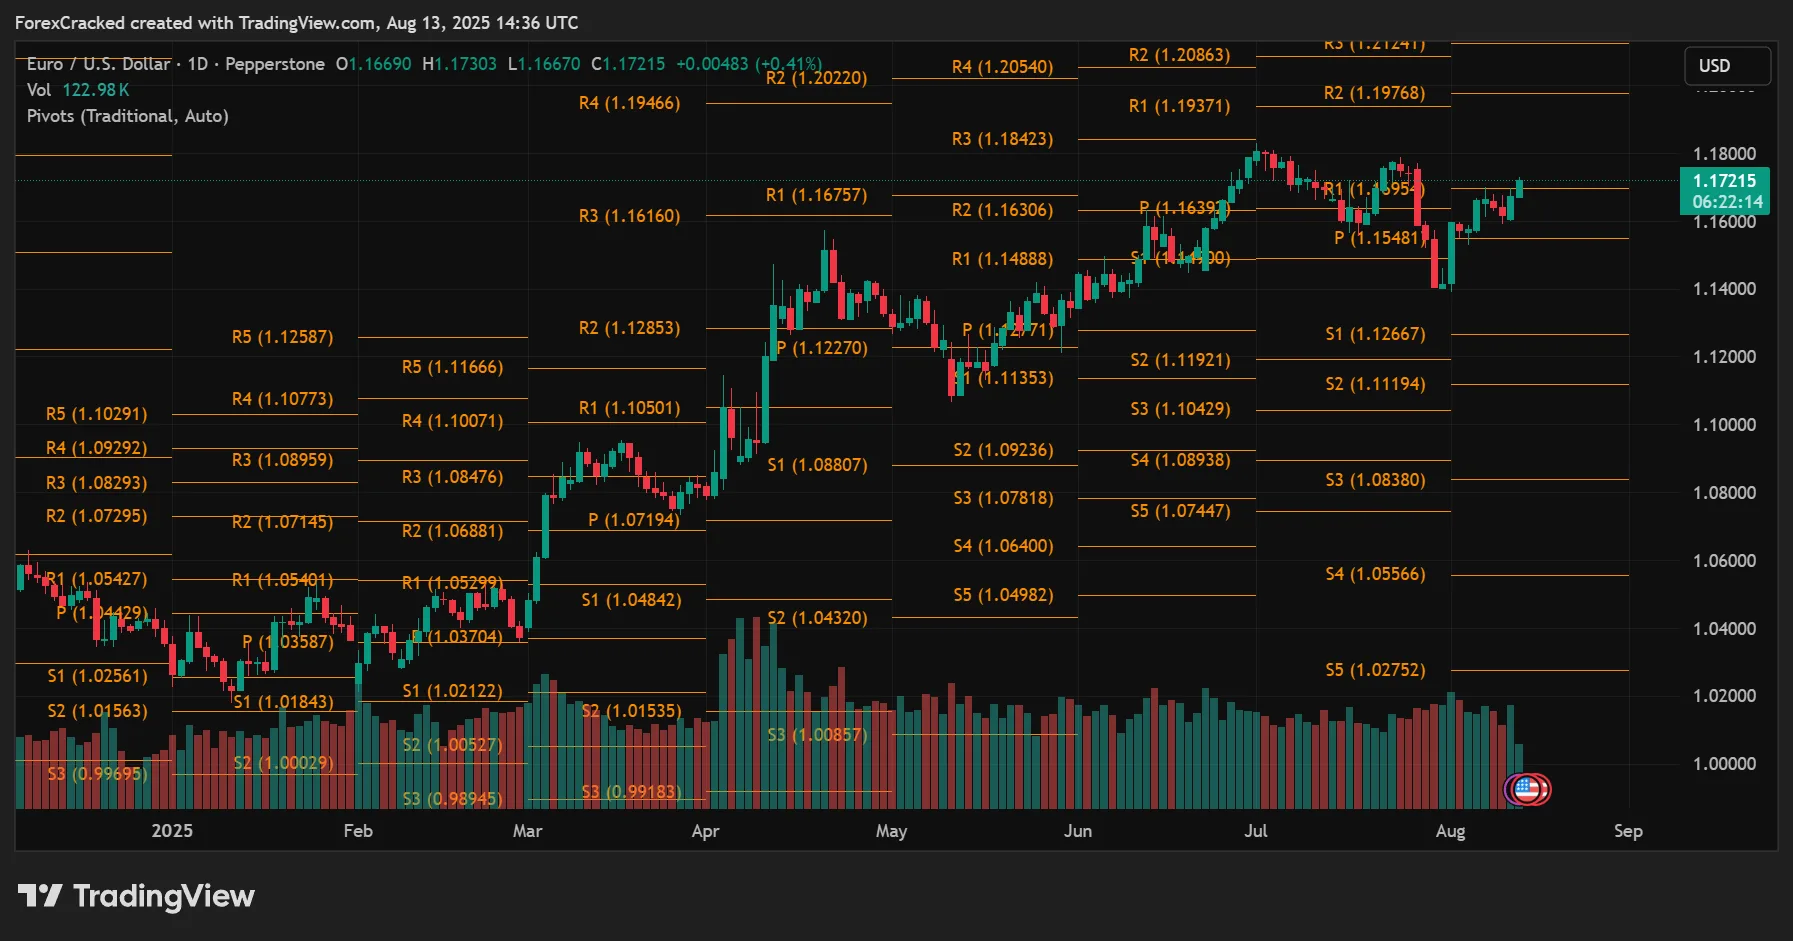
Pivot Points – Calculated from the previous period’s high, low, and close to generate intraday or weekly levels. Widely used for identifying potential turning points.
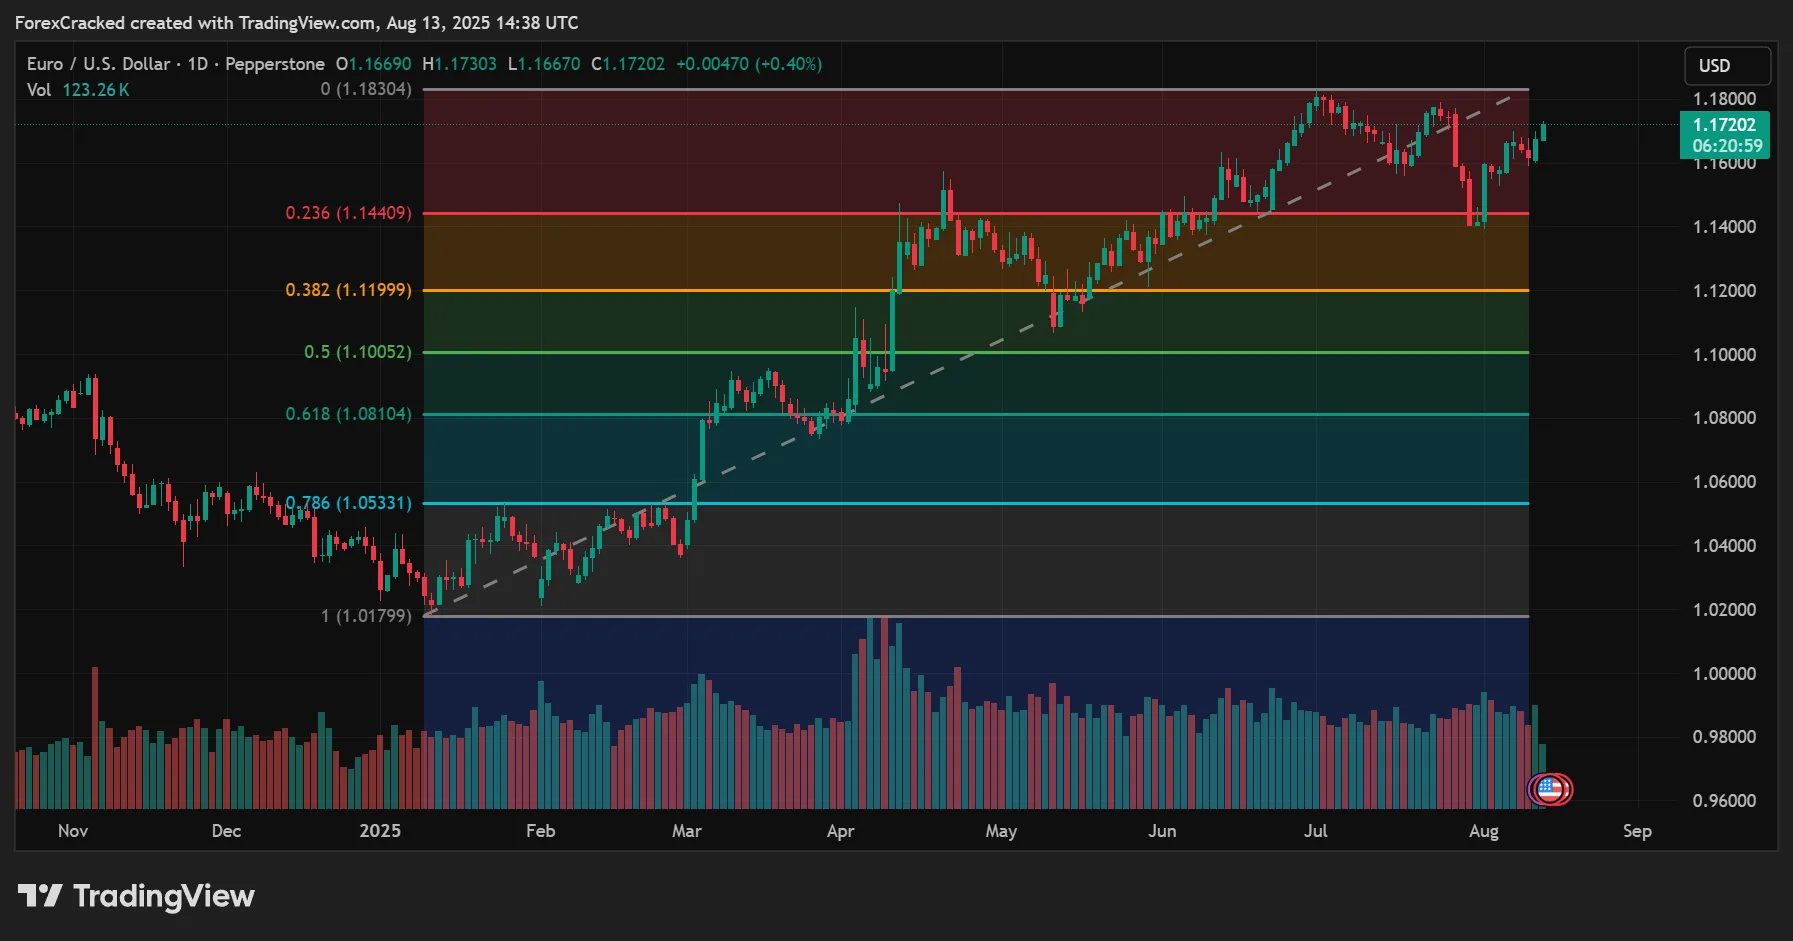
Fibonacci Retracement – Based on ratios derived from the Fibonacci sequence, common levels like 38.2%, 50%, and 61.8% mark potential pullback zones within trends.
This breakdown makes it easy to see which indicators help you spot direction, which measure strength, which track volatility, and which map key levels. Used together, they can form a balanced, well-rounded trading plan.
Quick Indicator Cheat-Sheet
| Indicator | Type | Key Insight | Common Settings | Best Use |
|---|---|---|---|---|
| SMA / EMA | Trend | Overall direction | 20, 50, 200 | Filter trades |
| MACD | Trend+Momentum | Trend shift | 12, 26, 9 | Crossovers, divergence |
| RSI | Momentum | OB/OS | 14 | Pullback timing |
| Stochastic | Momentum | OB/OS & reversals | 14, 3, 3 | Entry signals |
| ADX | Trend strength | Trend quality | 14 | Filter ranges |
| Bollinger Bands | Volatility | Relative extremes | 20, 2σ | Squeeze breakouts |
| ATR | Volatility | Movement size | 14 | Stops/targets |
| Parabolic SAR | Trend | Trailing stops | Default | Exit trends |
| Ichimoku | All-in-one | Trend + S/R | Default | Trend trading |
| Pivot Points | S/R | Daily levels | Classic | Intraday setups |
| Fibonacci | S/R | Retracement zones | 38.2%, 50%, 61.8% | Pullback entries |
The “2+1” Forex Indicator Stack – A Simple, Balanced Approach
One of the biggest mistakes new traders make is indicator overload cluttering charts with too many tools that often repeat the same information. This not only slows decision-making but can also lead to conflicting signals. The “2+1” Indicator Stack is a simple framework that keeps things clean, effective, and beginner-friendly.
Step 1: Choose One Trend Filter
A trend filter helps you quickly determine the market’s overall direction so you trade with the flow instead of against it.
- Examples: EMA 50, EMA 200, or ADX with a 14-period setting.
- Why it matters: A strong trend filter keeps you aligned with higher-probability trades and reduces the temptation to chase counter-trend moves.
Step 2: Add One Momentum Tool
A momentum indicator shows how strong the current move is and helps you time entries more precisely.
- Examples: RSI (14), Stochastic Oscillator (14,3,3).
- Why it matters: Even in a solid trend, markets breathe momentum tools help you spot pullbacks or overextended moves, so you can buy low in an uptrend or sell high in a downtrend.
Step 3: Include a Risk Management Tool
This is the “+1” in the stack an indicator dedicated to controlling risk and setting realistic targets.
- Example: ATR (Average True Range) with a 14-period setting.
- How to use it: ATR tells you the average movement size, so you can set stops far enough to avoid random noise while still protecting your capital. Many traders use 1–2× ATR for stop placement and target sizing.
Why the “2+1” Stack Works
By combining one trend indicator, one momentum indicator, and one volatility-based risk tool, you cover the three essentials:
- Direction – Are we trending up, down, or sideways?
- Timing – Is this the right moment to enter?
- Risk – How far can price realistically move before hitting your stop or target?
This approach gives you a clear, uncluttered chart and helps you focus on quality trades instead of being distracted by redundant signals.
Three Practical Forex Indicator Playbooks
The best way to understand indicators is to see them in action. These three practical trading playbooks show how to combine different indicator types into complete trade setups. Each one covers trend, timing, and risk so you can use them straight away or adapt them to your style.
Trend-Pullback Long – Riding the Established Uptrend
This setup works best in strong, established trends and aims to enter on a temporary pullback.
- Trend Filter: Price is trading above both the EMA 50 and EMA 200, confirming a bullish market.
- Entry Trigger: RSI dips into the 40–50 zone (mild pullback) and then turns upward, signalling renewed buying interest.
- Stop-Loss Placement: Set your stop 1.5–2× ATR below the most recent swing low. This allows breathing room while still protecting capital.
- Exit Strategy: Target prior swing highs or a fixed reward multiple such as 2R. You can trail the stop behind swing lows for extended runs.
Why it works: You’re aligning with the dominant trend, entering at a discount, and using volatility-based stops to avoid random shakeouts.
Squeeze-Breakout – Capturing Volatility Expansion
This setup targets breakouts from quiet, compressed market conditions.
- Setup Condition: Bollinger Bands contract, indicating reduced volatility and a potential energy build-up.
- Entry Trigger: A candle closes outside the band with ADX rising above ~25, confirming momentum is strong enough to sustain the move.
- Stop-Loss Placement: Place your stop near the mid-band (20 SMA) or at 1× ATR from entry.
- Exit Strategy: Use 1.5R–2R profit targets, or trail the stop to capture larger trends if the breakout extends.
Why it works: The squeeze identifies when volatility is at a low, and the breakout signals the start of a new, fast-moving phase.
Pivot + Fibonacci Confluence – High-Probability Reversal Zones
This setup focuses on trading from key market levels where multiple technical tools align.
- Setup Condition: Price pulls back to a daily pivot point that also lines up with a 38.2%–61.8% Fibonacci retracement from a recent swing.
- Entry Trigger: Stochastic Oscillator crosses in the direction of the trend from overbought/oversold levels, confirming a potential bounce or rejection.
- Stop-Loss Placement: Set your stop just beyond the next pivot level or 1–1.5× ATR past your entry.
- Exit Strategy: First target is the prior swing point; trail stops to lock in gains if the move extends.
Why it works: Confluence between pivot points and Fibonacci retracements increases the probability of price reacting at those levels, while the Stochastic adds timing precision.
Best Forex Indicator Settings by Timeframe
The right indicator settings depend on your trading timeframe. Shorter timeframes need faster-reacting indicators for quick decision-making, while longer timeframes benefit from slower settings that filter out noise.
Scalping Settings (M1–M5 Charts)
Scalpers need rapid signals to catch small, fast price moves.
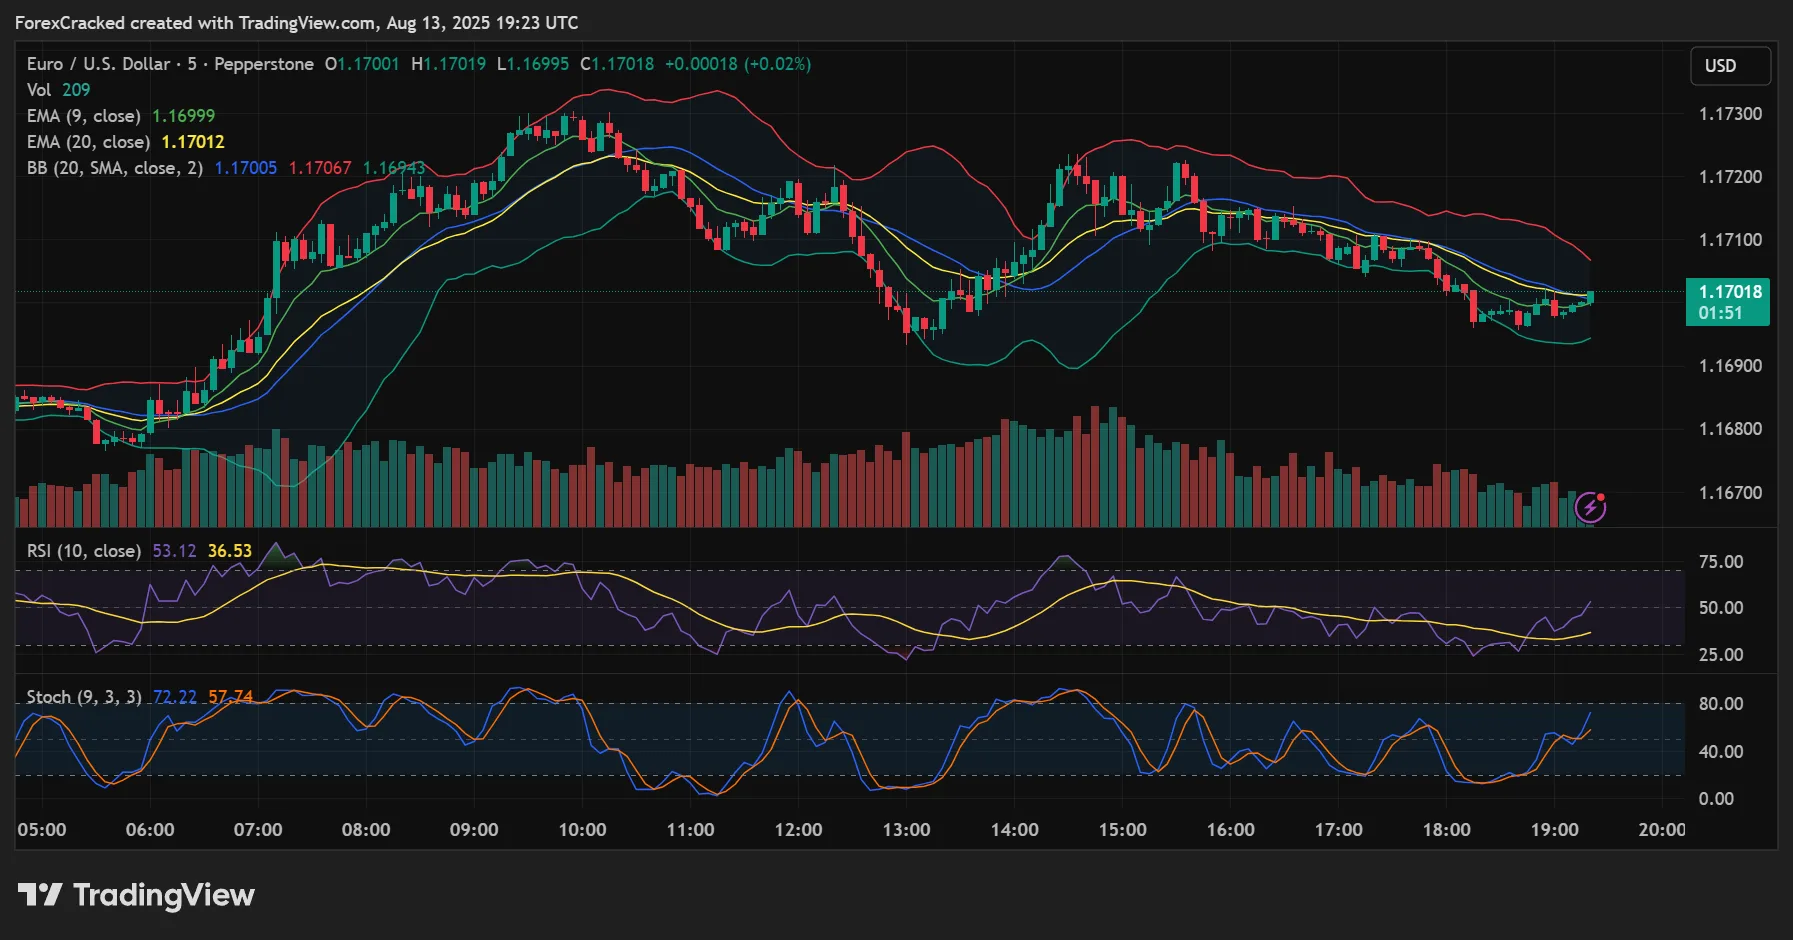
- EMA 9 & EMA 20: Two fast-moving averages for spotting quick trend shifts.
- RSI 7–10: Shorter RSI period for more sensitivity in detecting overbought/oversold conditions.
- Stochastic Oscillator 9,3,3: Ideal for timing precise entries and exits in rapid market swings.
Tip: Scalping demands strict risk control combine these settings with a tight ATR-based stop to protect profits from sudden reversals.
Day Trading Settings (M15–H1 Charts)
Day traders aim to capture intraday trends without overreacting to small fluctuations.
- EMA 20 & EMA 50: Provide a reliable trend filter for intraday trading.
- RSI 14: Balanced default setting to gauge momentum without too many false signals.
- Bollinger Bands 20,2: Detects squeezes and breakouts on an intraday scale.
- ADX 14: Confirms if the market has enough trend strength to justify a trade.
Tip: Use the EMAs for bias, RSI for timing pullbacks, and BB/ADX for breakout confirmation.
Swing Trading Settings (H4–D1 Charts)
Swing traders hold trades for days or weeks, so they use slower, more stable settings.
- SMA 50 & SMA 200: Classic moving averages for defining medium- and long-term trend direction.
- RSI 14: Reliable for spotting trend pullbacks and divergence on higher timeframes.
- ATR 14: Essential for setting stops/targets that account for larger market moves.
Tip: Higher timeframes naturally filter market noise focus on major S/R levels and use ATR for realistic risk placement.
Risk Management Rules When Using Forex Indicators
Indicators can guide trade entries, but risk management determines whether you keep your profits and survive long term. These three rules combine common indicator tools with simple, proven risk control methods.
ATR-Based Stop-Loss Placement
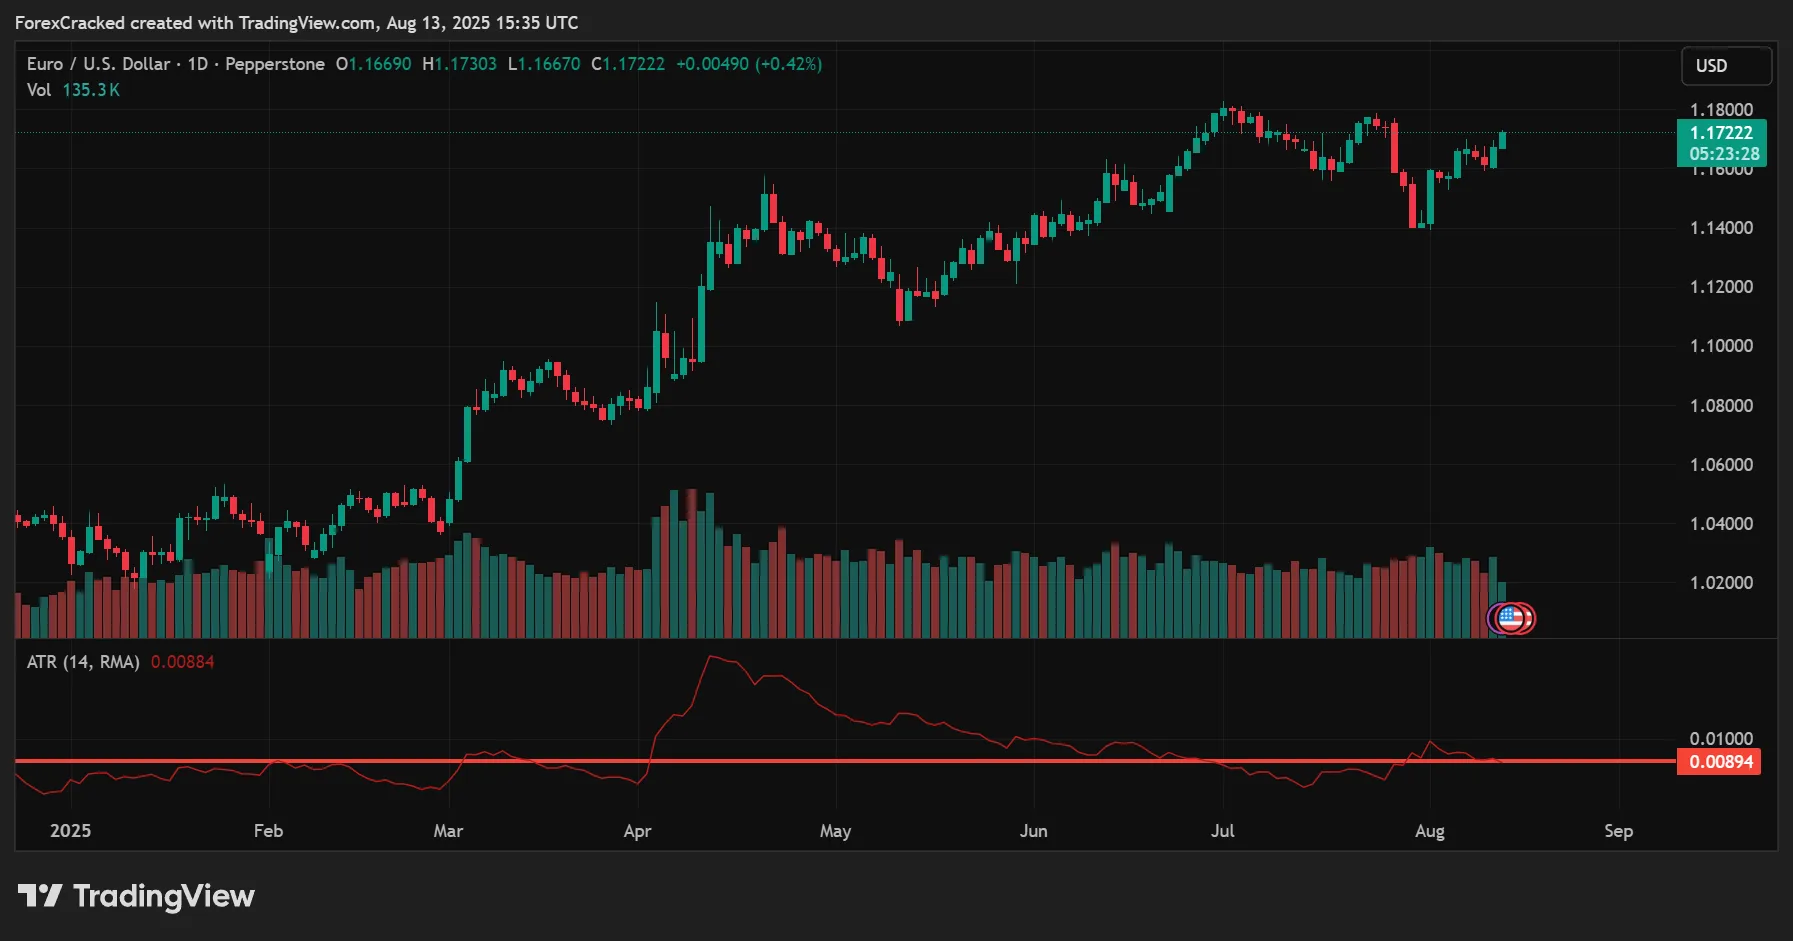
ATR (Average True Range) measures the average price movement over a set number of periods, giving you a realistic sense of volatility.
- How to set it: Multiply the ATR value by 1–2 and place your stop beyond the nearest market structure (swing high/low).
- Example: If ATR is 20 pips and you use 1.5× ATR, your stop is 30 pips past the swing point.
- Why it works: This method adjusts your stop to current market volatility, reducing the chance of being stopped out by normal fluctuations.
Parabolic SAR as a Trailing Stop
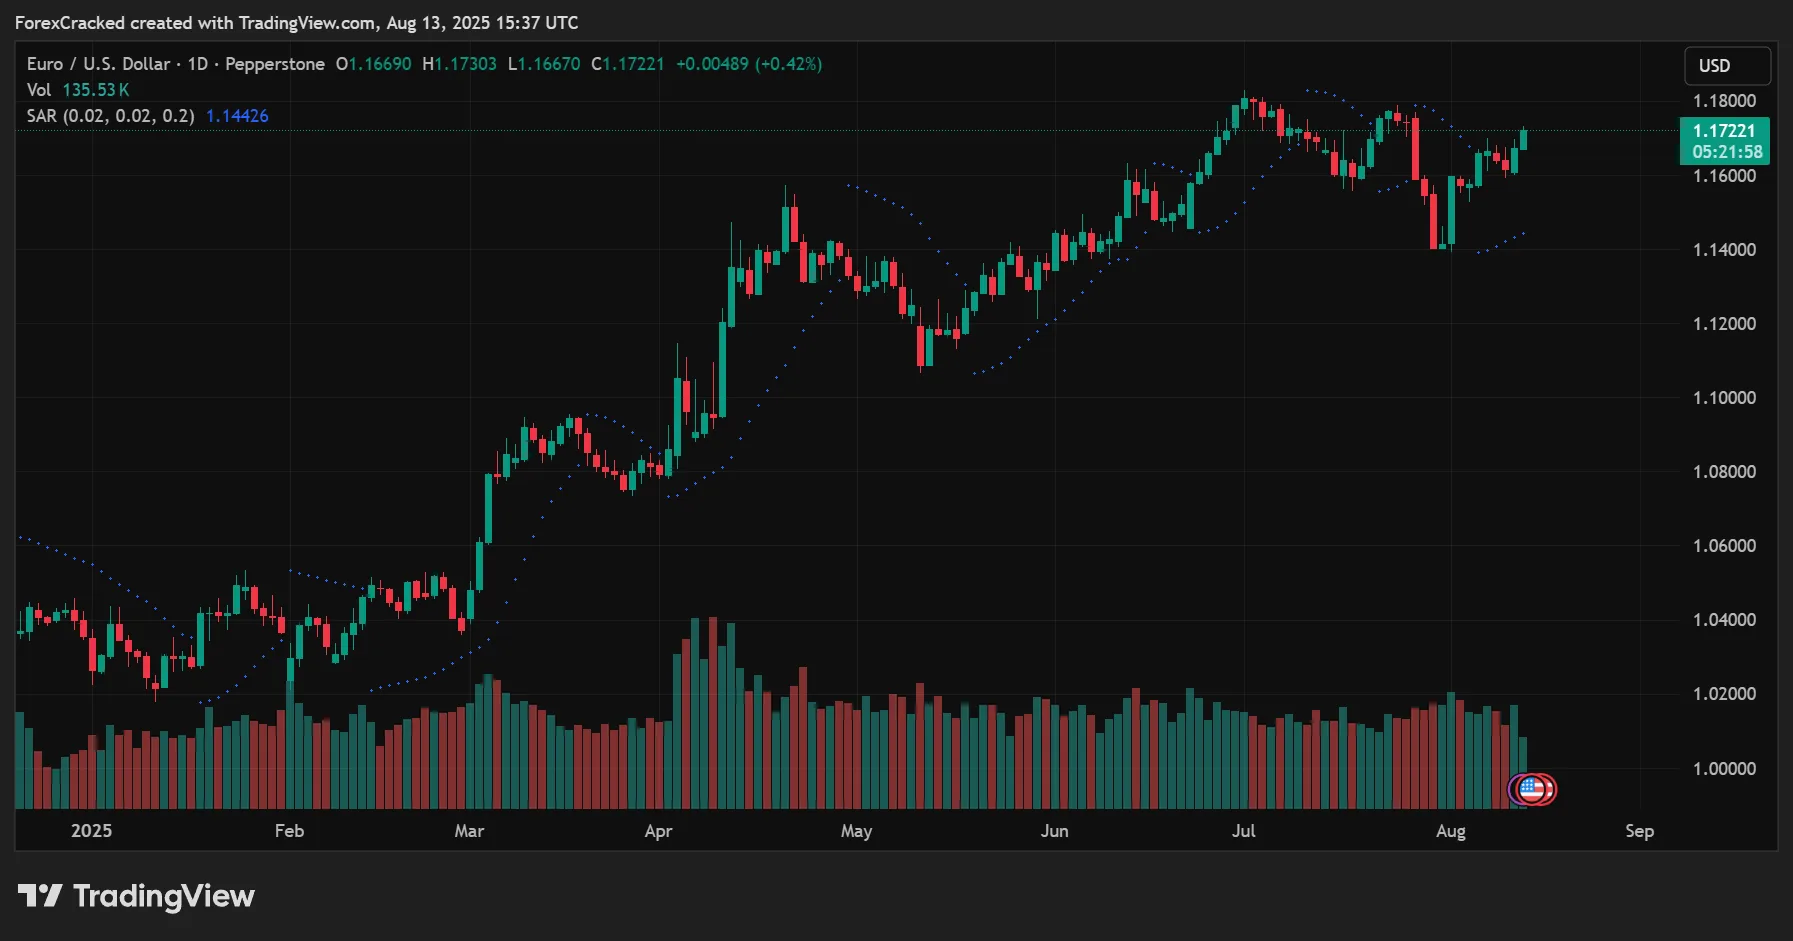
The Parabolic SAR is designed to trail price in trending markets, moving your stop progressively as the trade goes in your favor.
- Best use: Only in strong, clean trends where SAR dots consistently trail the move.
- When to avoid: Sideways or choppy markets SAR flips too often, leading to unnecessary exits.
- Benefit: Locks in profits automatically while giving the trade room to breathe.
Tick Volume as a Context Filter
In spot forex, there’s no centralized volume data, but tick volume the number of price changes in a period can be a useful proxy for market participation.
- Interpretation: Higher tick activity often aligns with stronger, more sustained moves.
- Application: Use volume spikes to confirm breakouts or to gauge if a trend move has momentum behind it.
- Caution: Volume varies by broker; treat it as a supporting clue, not a primary signal.
Bottom line: These three tools ATR for stop placement, SAR for profit locking, and tick volume for confirmation can work together to protect your capital and maximize gains without overcomplicating your trading plan.
Backtesting Tips for Forex Indicators

Before you risk real capital, backtesting lets you see how your indicator-based strategy would have performed in past market conditions. Done properly, it helps you refine your rules, spot weaknesses, and build confidence in your trading plan.
Test Across Multiple Market Conditions
Markets don’t behave the same way all the time. Your strategy should be tested in:
- Trending markets – to see if it can ride sustained moves.
- Range-bound markets – to check if it avoids false breakouts.
- High-volatility periods – to measure resilience during sudden price swings.
This ensures your approach isn’t only profitable in one specific environment.
Keep Parameters Simple to Avoid Overfitting
Overfitting happens when you tweak your settings too much to fit past data perfectly, but the strategy fails in live markets.
- Use round numbers: e.g., RSI 14 instead of 13.7.
- Avoid excessive filters: More rules can make the system fragile.
- Test robustness: Slightly adjust parameters to see if results remain consistent.
Maintain a Detailed Trading Journal
A trading journal is your personal performance database. Record:
- Date, time, and pair traded.
- Indicator settings and signals used.
- Entry/exit prices, stop-loss, and target.
- Outcome and lessons learned.
Reviewing your journal regularly reveals patterns both strengths to repeat and mistakes to avoid.
Bottom line: Backtesting is not about finding a perfect setup it’s about creating a strategy that’s consistent, adaptable, and easy to execute in real market conditions.
Frequently Asked Questions (FAQs)
1. Which forex indicator is considered the most accurate?
There’s no single “most accurate” forex indicator; effectiveness depends on your strategy, market conditions, and how you use the indicator. Most successful traders combine tools like moving averages, RSI, MACD, or Bollinger Bands to cover trend, momentum, and volatility flashes.
2. Can I trade forex without using indicators?
Absolutely, many traders prefer price action or fundamental analysis. Indicators simply add structure and confirmation to your process. Whether you rely on RSI, moving averages, or chart patterns, choose what helps you make clearer, more confident entries.
3. What are the best indicator combinations for different trading styles?
- Day trading – Try moving averages with RSI or Bollinger Bands and MACD for breakout signals.
- Swing trading – Use multi-EMA setups with RSI and volume or VWAP for clearer direction.
- Universal rule (2+1 stack): Employ one trend filter, one momentum tool, and one risk tool (e.g., ATR) a balanced trio for almost any style.
4. Why do indicators sometimes give misleading signals?
You’re in the wrong market condition e.g., moving averages lag in ranging markets, RSI gives false oversold signals during strong trends, or MACD crosses after most of the move is over.
Settings are too tight or over-optimized causing noise or fitting historical data but not generalizable.
Test broadly, keep settings simple, and always combine signals with price structure.
5. How do I choose indicator settings (periods and lengths)?
A good guideline: shorter periods make indicators more responsive but noisier; longer periods smooth them but lag behind price.
Popular moving average settings: 50‑day, 100‑day, 200‑day for long-term; 5‑, 10‑, 20‑day for shorter trends. Always adjust for your trading timeframe and market volatility.
6. Is tick volume meaningful in forex?
In the decentralized spot forex market, volume typically refers to tick volume the number of price changes in a period. It’s a useful proxy for activity and momentum, though not as precise as volume in centralized markets. Interpret it as context, not confirmation.
- Checkout our Crunchbase profile
Conclusion
Forex indicators aren’t about collecting as many as possible they’re about choosing the right mix for trend, momentum, and risk so you can trade with clarity and confidence. By using tools like the 2+1 Indicator Stack, applying proven setups, and following solid risk management, you can turn raw market data into actionable decisions. Keep testing, refining, and combining your indicators with price action, and they’ll become a powerful part of your trading edge.
