The pivot Points Indicator is an MT4/MT5 indicator designed to automatically draw important Pivot Levels in MT4 and MT5 terminals. The Forex market is a dynamic, fast-paced environment where many factors are continuously at play. To navigate this complex landscape, traders employ various tools and strategies to guide their trading decisions. One such tool is the Pivot Point Mt4, an essential element of technical analysis that identifies potential support and resistance levels.
This Auto Pivot Points Indicator supports several calculation methods for Pivot Points, including Classical, Camarilla, Woodie, Fibonacci, and CPR. This flexibility allows traders to choose the best calculation method with their specific trading strategy.
Table of Contents of Auto Pivot Points
This Pivot Points MT5 can be used on any Forex currency pair and other assets such as commodities, Cryptos, Binary Options, Stock markets, Indices, etc. You can also use it on any time frame that suits you best, from the 1-minutes to the Month charts.
This is an entirely free Indicator without any restrictions made by the fxssi.com website. There are more useful free and paid indicators on this website. So check out their other indicators and show some love for the FXSSI Indicators.
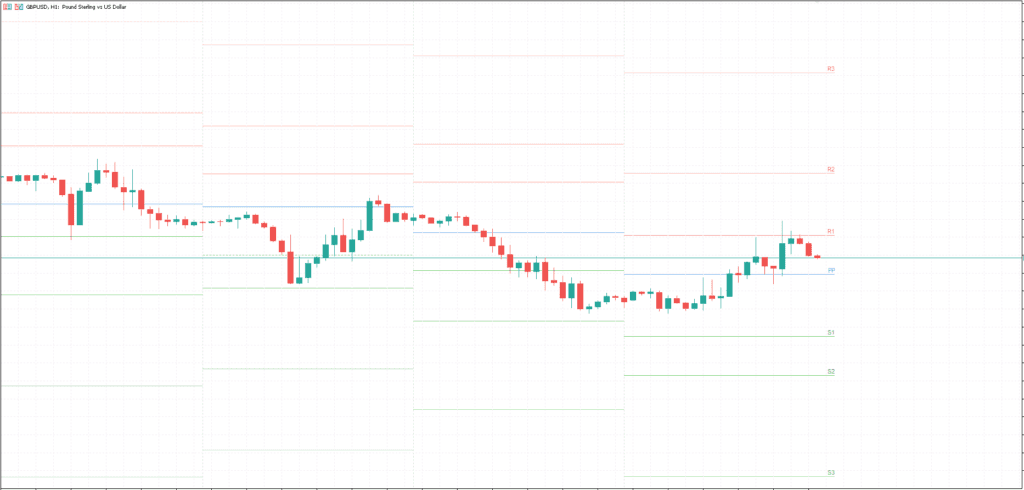
What are Pivot Points
Pivot Points are a technical analysis tool traders use to determine potential support and resistance levels. These are levels at which the price of an asset, such as a stock, might experience a significant movement, usually based on the previous day’s trading range.
There are several ways to calculate pivot points, but the most common method is the five-point system, which includes the pivot point (P), two resistance levels (R1 and R2), and two support levels (S1 and S2).
Here’s the calculation:
- Pivot point (P) = (High + Low + Close) / 3
- First level of resistance (R1) = (2 x P) – Low
- First level of support (S1) = (2 x P) – High
- Second level of resistance (R2) = P + (High – Low)
- Second level of support (S2) = P – (High – Low)
“High,” “Low,” and “Close” are the highest price, lowest price, and closing price of the previous trading period, respectively.
Traders use these pivot points to predict potential price movement and to identify when to enter and exit trades. If the asset’s price is above the pivot point, it indicates bullish sentiment, while a price below the pivot point is seen as bearish. Traders also consider the support and resistance levels as potential places where prices may bounce or break through.
How is it used in Forex Trading
Pivot Points are widely used in forex (foreign exchange) trading, just like in other forms of trading, such as stocks or commodities. The main idea behind using pivot points in forex trading is to determine potential turning points in the market, which are levels where the market sentiment could change from bullish to bearish or vice versa.
Here’s a general guide on how to use pivot points in forex trading:
- Identify the Pivot Point: First, calculate the pivot point using the formula mentioned in the previous response. The high, low, and close prices used in the calculation are typically taken from the last day’s trading in the forex market.
- Determine Support and Resistance Levels: After calculating the pivot point, you can calculate the support and resistance levels. These levels can serve as potential entry or exit points. They can also act as alerts for trend continuation or reversal.
- Use the Pivot Point to Assess Market Sentiment: If the current price is higher than the pivot point, it could indicate that the market is in a bullish (upward) trend. Conversely, if the current price is lower than the pivot point, the market could be considered bearish (downward).
- Plan Your Trades: You can use these levels to plan your trades. For example, some traders choose to go long (buy) when the price approaches a support level or go short (sell) when the price approaches a resistance level.
- Use in Conjunction with Other Indicators: Pivot points are often used in conjunction with other indicators in a comprehensive trading strategy. For example, a trader might combine pivot points with moving averages, stochastic oscillators, or MACD (Moving Average Convergence Divergence) to confirm potential trading signals.
Remember that while pivot points can be a helpful tool, no technical indicator is perfect, and they all have their limitations. As such, it’s important to use risk management strategies and not rely exclusively on one type of indicator for trading decisions.

Calculation Modes of this Pivot Points Indicator
Here, we delve deeper into these calculation methods:
1. Classical Pivot Points
The most commonly used method, Classical Pivot Points, are calculated using the high, low, and closing prices from the previous trading period. These points serve as a primary reference for traders and offer the broadest view of potential price movement.
2. Camarilla Pivot Points
Camarilla Pivot Points are an advanced system that uses a unique formula to provide more support and resistance than other methods. Often favored by short-term traders, this method is known for its high level of precision.
3. Woodie Pivot Points
This method gives more weight to the closing price of the previous period. Traders who follow the Woodie system believe that the closing price contains more information about market sentiment than the opening price, leading to more reliable signals.
4. Fibonacci Pivot Points
Fibonacci Pivot Points combine the concepts of pivot points with Fibonacci levels, a widely-used tool that helps identify potential retracement levels. This method often aids traders in identifying possible reversal points in the market.
5. Central Pivot Range (CPR)
The Central Pivot Range method expands on the concept of the Classical Pivot Point by calculating a range around the central pivot. This range includes the main pivot point and two other pivot levels above and below it, providing a more comprehensive market view.
CPR helps a trader to predict future market situations by analyzing over days whether the pivots are higher or lower or whether the range width is narrowing or widening.
Input Parameters
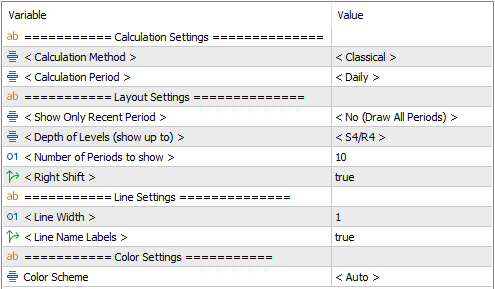
- Calculation Method – select the method of Pivot Points calculation: Classical, Camarilla, Woodie, Fibonacci. The formulas for each method are described above.
- Calculation Period – determines the period for which the High, Low, and Close values will be taken.
- Hourly;
- Daily;
- Weekly;
- Monthly.
- Number of Periods to show. The number of previous periods is to be displayed on the chart. This parameter is not considered if the option “Show only the current period” is set.
- Show Only Recent Period. Display one or more calculation periods.
- Depth of Levels – limits the number of displayed support and resistance lines on the chart.
- Right Shift – continue the line to the full length of the right indent on the chart.
- Color Scheme – automatic detection of the color scheme for the indicator. It is also possible to change the background color manually.
Download a Collection of Indicators, Courses, and EA for FREE
How to Use Pivot Points MT5
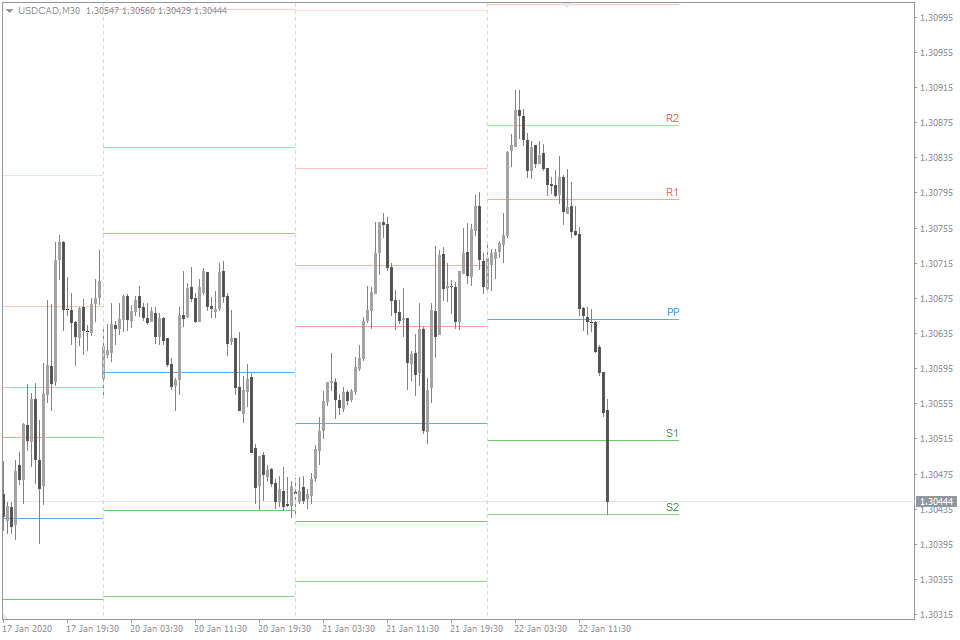
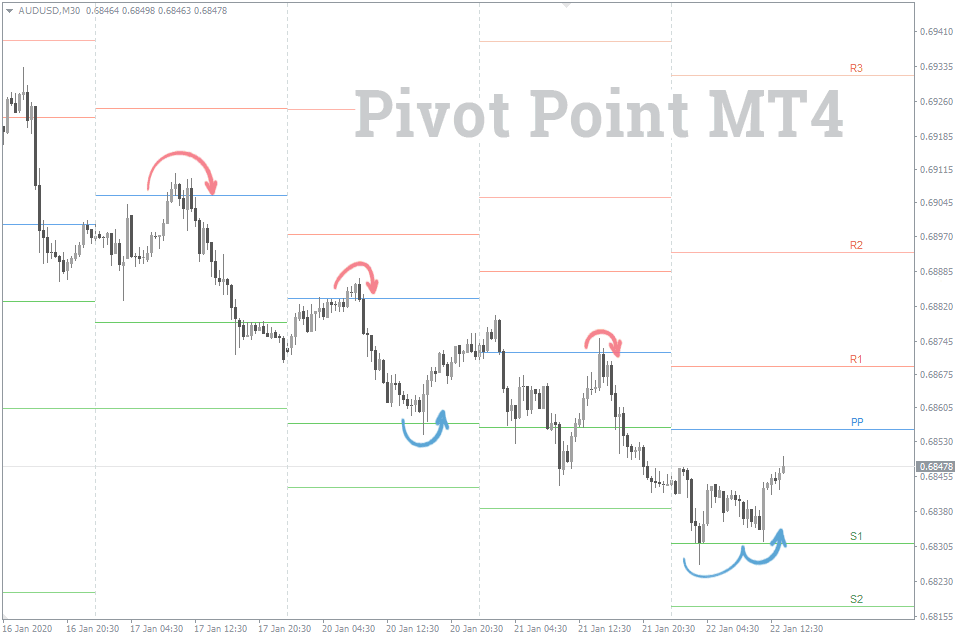
At the heart of trading with Auto Pivot Points is the fundamental concept that prices are more likely to revert to the previous day’s closing level rather than surpass the range of the previous day’s trading. This principle underlies why the daily time frame is the most commonly used calculation period for Pivot Points. In this scenario, each Pivot level serves the critical function of acting as support or resistance.
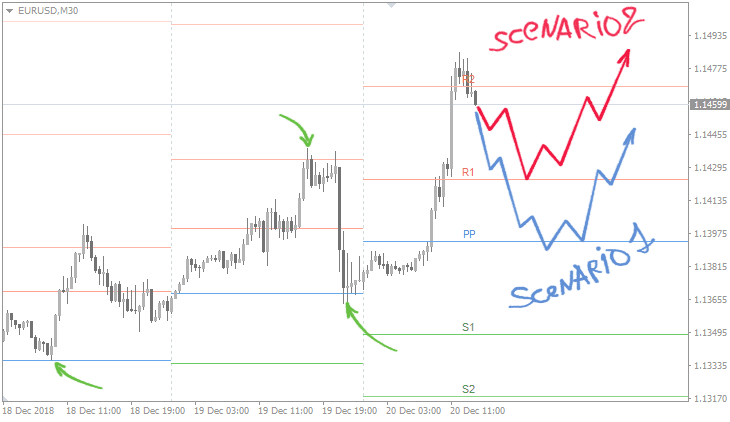
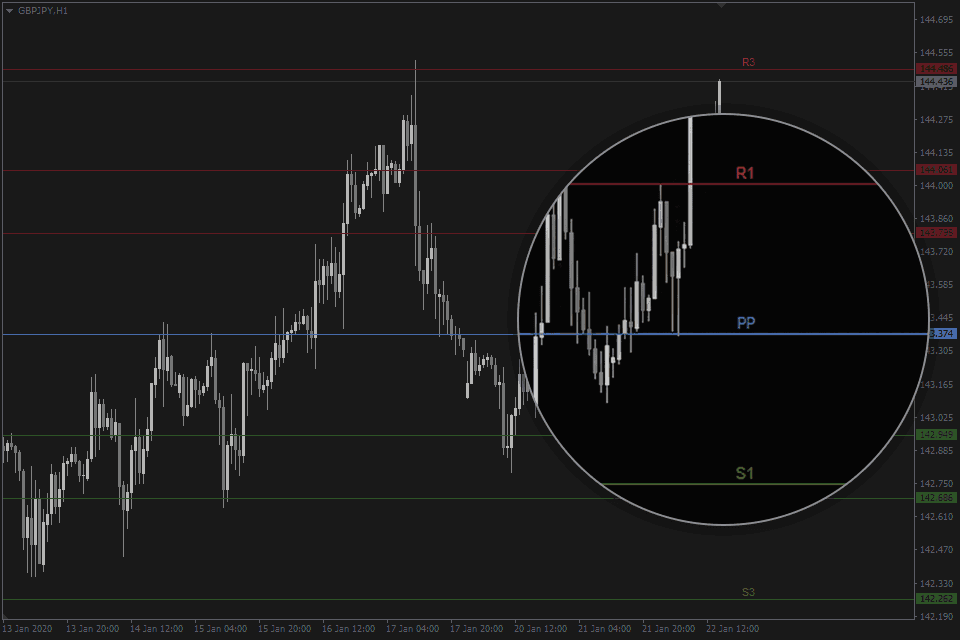
When analyzing a chart equipped with Pivot Points MT4, one can see many interactions between the price and these levels, validating their significance in market analysis.
A substantial advantage of the Pivot Points MT5 is its widespread use among traders. The higher the number of traders employing the same tool, the greater the likelihood that price movements will engage with it, thereby contributing to its predictive reliability. This phenomenon enhances the utility and relevance of Pivot Points as a reliable tool for assessing market trends.
- Read More Profitable Forex Pivot Trading Strategy
Conclusion of Pivot Points MT4
Understanding and utilizing the various Pivot Point calculation methods available in Pivot Points Indicator can provide traders with valuable insights into market trends and potential reversals. By incorporating these points into their trading strategies, they can make more informed trading decisions, better manage their risk, and potentially increase their chances of achieving profitable trades.


[…] CPR represents a significant evolution in pivot point analysis, offering traders a nuanced approach to daily price-level assessment. Incorporating top, […]
Thank you for this pivot point indicator, i have tried many and they are not compatible with mt5. but this one here is working fine.