
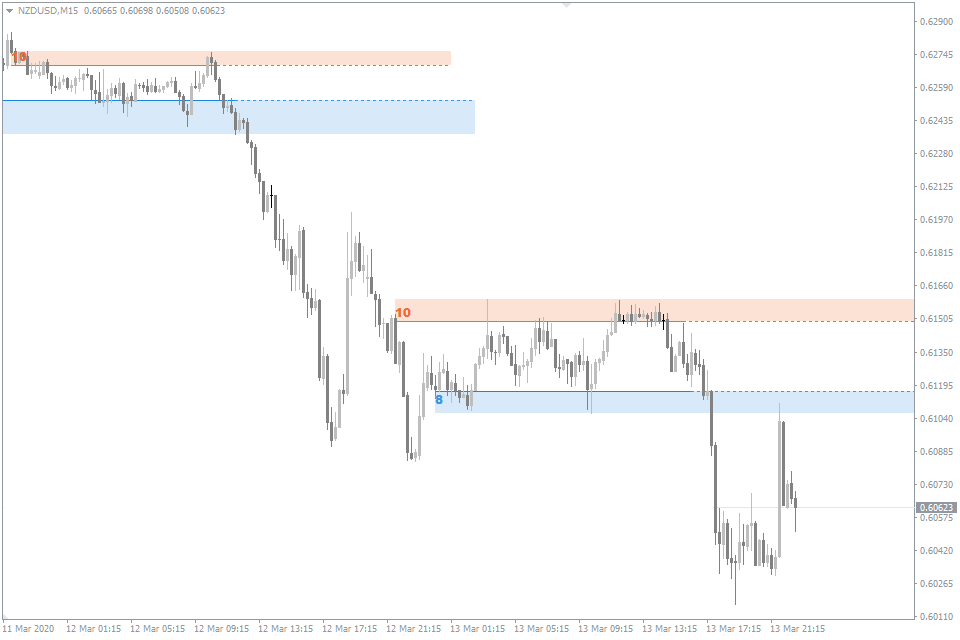
This Auto Support and Resistance Indicator is an Indicator for MT4 or MT5 that automatically spots Support and Resistance levels and plots them on the chart. The Support and Resistance Indicator aims to aid traders in their daily trading by automatically identifying and drawing rectangular areas on the MT4 and MT5 charts where the price has previously interacted.
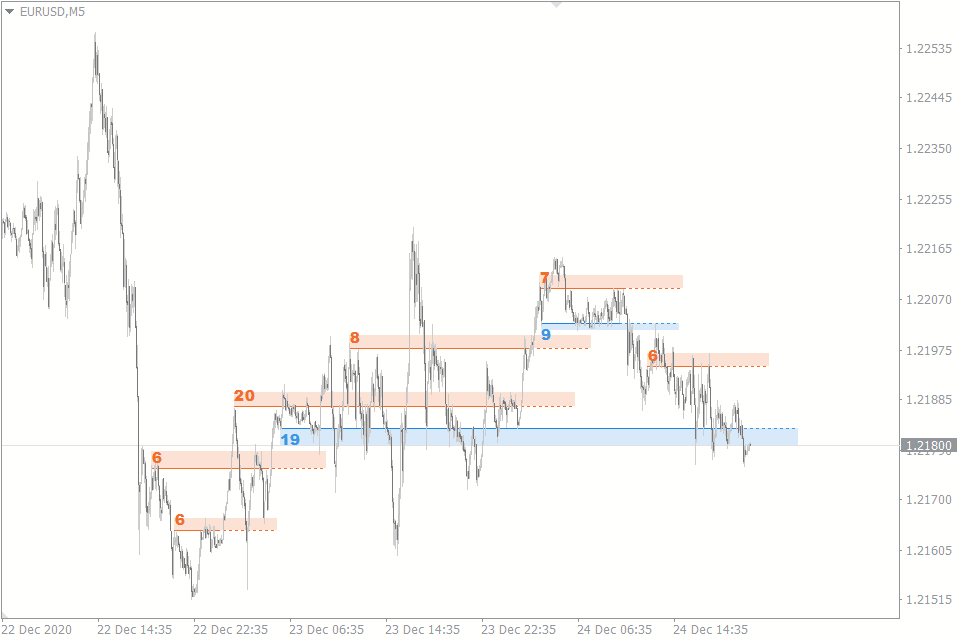
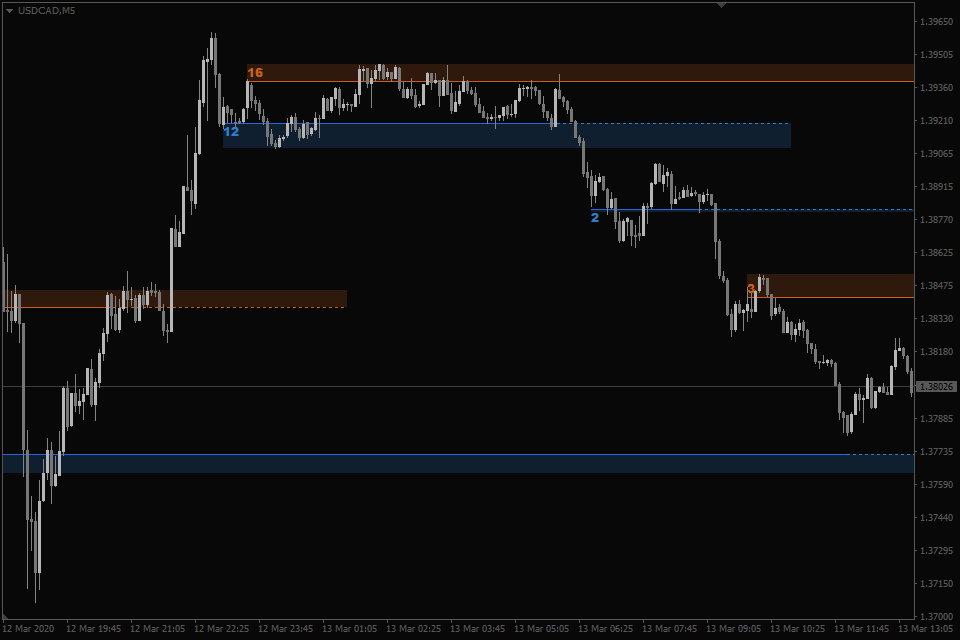
The height of these support and resistance areas is determined by the spread between the price highs and lows that the level passes through, with resistance levels in orange and support levels in blue.
One notable feature of the Auto Support Resistance Indicator is that it does not repaint. However, if new price highs or lows occur within an existing support or resistance area, its height can expand accordingly.
For a similar approach, you might also want to explore the Dollar Index (DXY) Indicator MT4/MT5 – Free Download which offers a complementary trading perspective.
Table of Contents
This Support and Resistance MT4 can be used on any Forex currency pair and other assets such as commodities, Cryptos, Binary Options, Stock markets, Indices, etc. You can also use it on any time frame that suits you best, from the 1-minutes to the Month charts. For optimal use, it is recommended to work with timeframes ranging from M15 to H1.
This is an entirely free Indicator without any restrictions made by the fxssi.com website. There are more useful free and paid indicators on this website. So check out their other indicators and show some love for the FXSSI Indicators.
What are Support and Resistance
Support and resistance are important concepts in technical analysis, a method of evaluating financial markets based on historical price and volume data analysis.
Support refers to a price level where buying interest is strong enough to prevent the price from falling further. In other words, support is a level where demand for an asset exceeds supply, which leads to a temporary halt or reversal of the downtrend.
On the other hand, resistance is a price level where selling pressure is strong enough to prevent the price from rising further. Resistance occurs when supply exceeds demand, which leads to a temporary halt or reversal of the uptrend.
In technical analysis, traders and analysts often use support and resistance levels to identify trades’ potential entry and exit points. For example, a trader may buy an asset when it reaches a support level, believing that the buying interest at that level will push the price higher. Conversely, a trader may sell an asset when it reaches a resistance level, expecting the selling pressure at that level to push the price lower.
Traders looking for additional tools should also check out the Synthetic VIX Forex Indicator MT4/MT5 FREE Download for enhanced market analysis.
How it used in Forex Trading
Forex traders widely use support and resistance levels to identify potential price levels where buying or selling interest may be strong, which can help them make trading decisions.
In forex trading, support, and resistance levels are typically identified using technical analysis tools such as charts and indicators. Traders may use different types of charts, such as candlestick charts or line charts, to identify key price levels.
Once a support or resistance level is identified, traders may use it to make trading decisions. For example, a trader may look to buy a currency pair when it reaches a support level, believing that the buying interest at that level will push the price higher. Alternatively, a trader may look to sell a currency pair when it reaches a resistance level, expecting the selling pressure at that level to push the price lower.
Traders may also use support and resistance levels to set stop-loss and take-profit levels for their trades. For example, a trader may set a stop-loss order just below a support level to automatically close the trade to limit losses if the price falls below that level. Similarly, a trader may set a take-profit order just below a resistance level so that the trade is automatically closed to lock in profits if the price reaches that level.
Overall, support and resistance levels are helpful tools for forex traders to help identify potential trading opportunities and manage risk. However, it’s important to note that these levels are not always accurate and can be broken by sudden market events, so traders should always use them in conjunction with other technical and fundamental analysis tools.
Who is Support and Resistance MT5 for?
Support and resistance levels are significant price reference points that assist traders in making Forex trades. Hence, the Support and Resistance MT4 indicator is highly compatible with any other indicator or trading system, making it useful in the trader’s toolkit.
Learning to draw support and resistance levels independently is crucial for novice traders. However, the Support and Resistance MT5 indicator can be valuable for those lacking sufficient skills.
Even experienced traders can benefit from the indicator, as it saves time that would otherwise be spent drawing the levels.
How the Support and Resistance MT4 Spots Levels
Regarding drawing support and resistance levels, there are various methods traders use. For instance, the Pivot Points indicator utilizes past candlestick data for this purpose. On the other hand, the Auto Support and Resistance Indicator identifies levels that have the highest number of price touches.
Since touch is a subjective concept, and everyone interprets it differently, the indicator employs a freely available Fractal indicator to identify touches representing extreme price levels. The Fractal indicator’s formula is independent of the timeframe, allowing the Auto Support Resistance indicator to function on any timeframe.
After detecting and labeling touches, the indicator algorithm identifies levels with the highest number of price interactions and displays them on the chart.
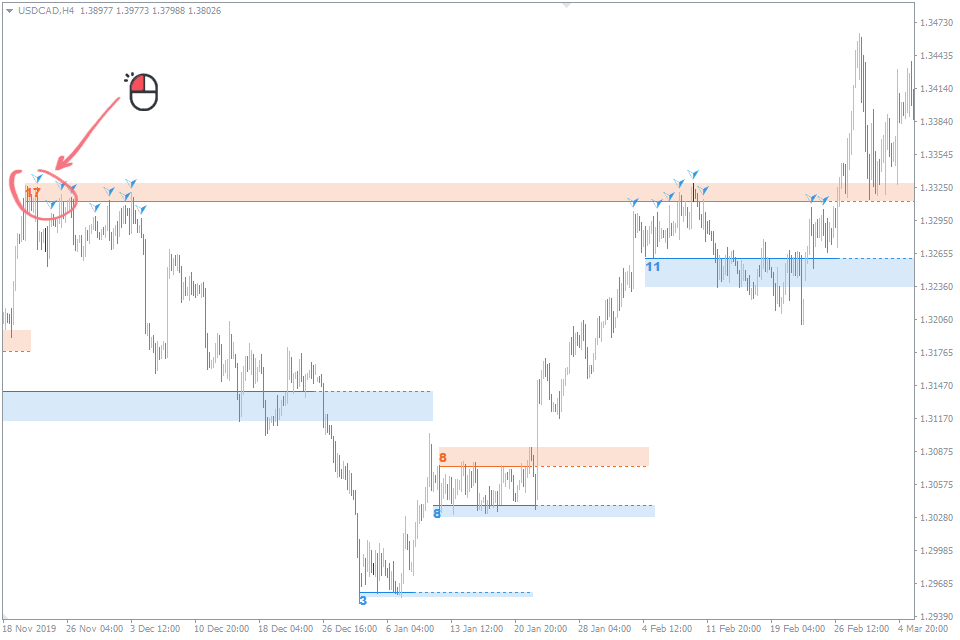
To see the price interactions with a certain level, click the weight number on the left side of the rectangle.
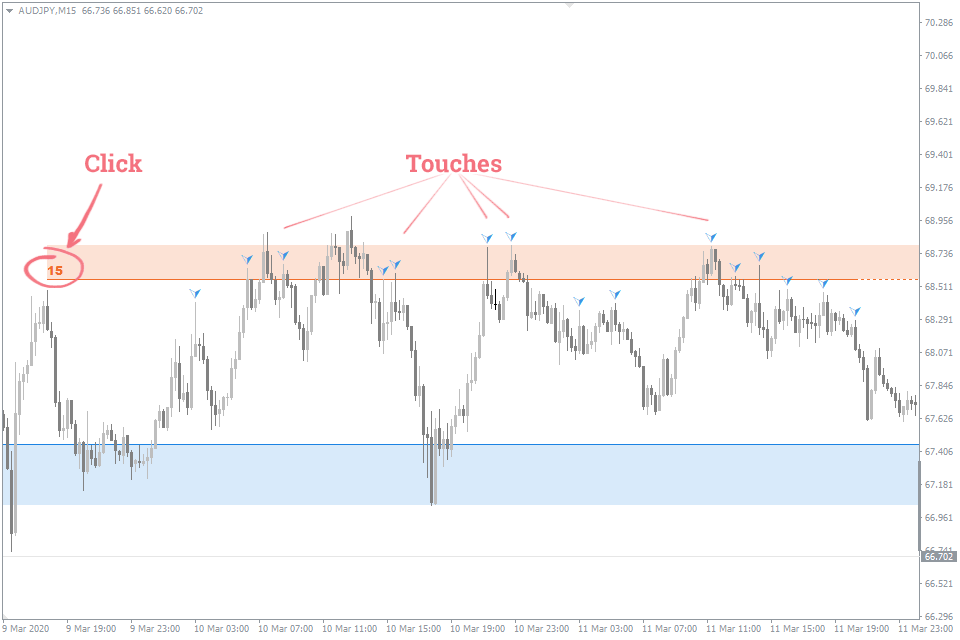
As you can see, some of the interactions are out of the filled rectangle, but this is not the indicator’s error. These touches are used to identify levels more precisely.
Support and resistance levels themselves occupy just under 50% of the area analyzed by the algorithm.


Auto Support Resistance Input Parameters
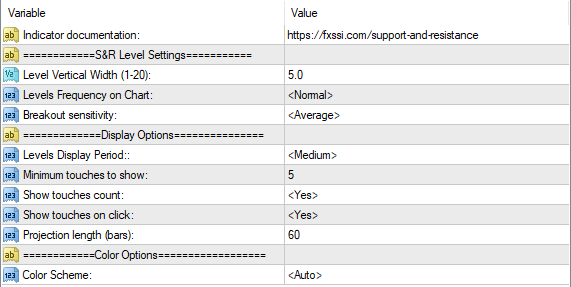
Level Settings
- The Level Vertical Width parameter controls the maximum height of support and resistance areas, with a default value of 5.0. Increasing the value extends the price range covered by the levels.
- Levels Frequency on chart determines the number of levels displayed on the MT4 and MT5 charts. The default setting is “Normal,” but traders can switch to “More” to display more levels or “Less” to display only the most significant support and resistance areas.
- Breakout sensitivity parameter sets the indicator’s sensitivity to level breakout. A high sensitivity level results in more frequent level interruptions, while a low sensitivity level leads to fewer interruptions. The default sensitivity is set to “Average.”
Display Options
- Levels Display Period sets the depth of history used to draw support and resistance levels, with a default value of “Medium.” Other options include “Short” for a history depth of 300 bars and “Long” for a depth of 1200 bars.
- Minimum touches to show sets the minimum number of times that the price must interact with a level before it is displayed. The default value is 5.
- Show touches count displays the number of times the price interacts with a level if set to “Yes,” while Show touches on click displays the price interactions with a level when the number is clicked.
- Projection length determines the length of the dashed line projection in bars.
Auto Trend Channels Indicator will change Channel colors automatically, depending on the background color of your chart.
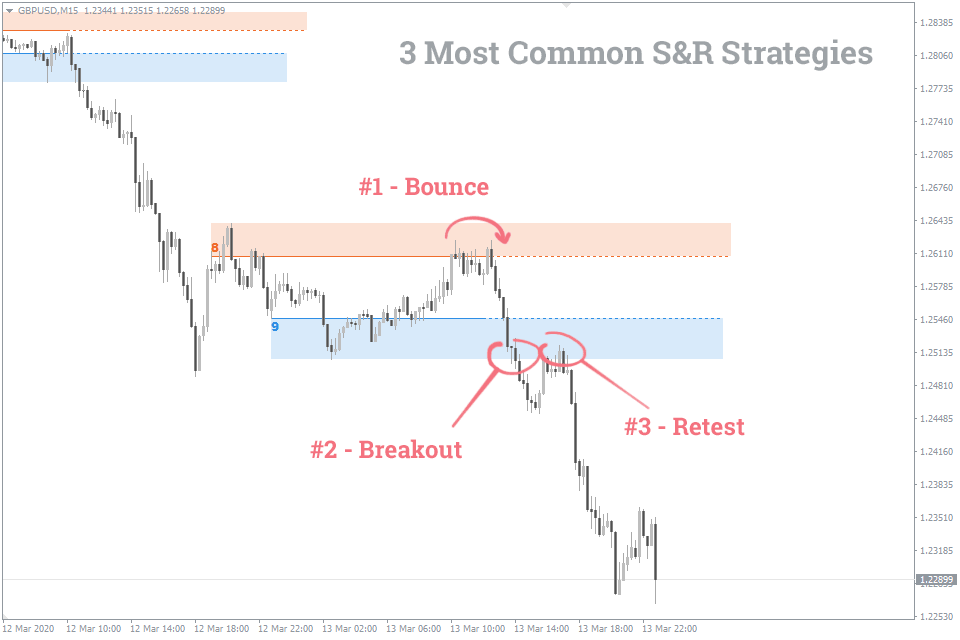
How to trade using the Auto Support and Resistance Indicator?
There are three major techniques of trading with strong support and resistance levels:
- Rebound (Bounce) from a level,
- Level breakout,
- Retest of the broken level.
You can find three strategies using Support and Resistance down below:
- Support And Resistance Forex Trading Strategy
- Support Turned Resistance Forex Trading Strategy
- How to Trade Forex Using Support and Resistance Levels: A Step-by-Step Guide
You may also be interested in Auto Trend Channels Indicator. It facilitates one of the most challenging tasks for a trader: identifying the primary trend. The indicator spots the precise trend lines and automatically draws them on the chart.
- More Free Indicators by this Developer FXSSI
You may also find the Trend Force Forex Indicator MT4 Free Download useful as a complementary tool for your trading setup.
[…] Support and Resistance Indicator: This indicator is crucial for identifying significant price levels where the market might experience turns or pauses, enhancing entry and exit decision accuracy. […]
[…] Indicador de soporte y resistencia : este indicador es crucial para identificar niveles de precios significativos donde el mercado podría experimentar giros o pausas, mejorando la precisión de las decisiones de entrada y salida. […]
[…] Trend Channel Lines: The indicator’s upper and lower lines provide dynamic support and resistance, adapting in real-time to market […]
[…] with the Professional Indicator. This compatibility encourages traders to draw their trend lines, support and resistance levels and craft a personalized trading system that resonates with their trading […]