
This Auto Trend Channels Forex Indicator is an Indicator for MT4 or MT5 that spots the Trend Channels and automatically plots them on the chart. rend Channels are one of the most popular forex market Analyses used by thousands of traders worldwide. I use this indicator for my trading, that why I wanted to share this with fellow traders.
If you often rely on trend lines in your daily trading, the given indicator will make it much easier to work with them and relieve you of the need to spot and manually draw the lines every time.
The AutoChannels indicator is a trend channel tool for the MT4 and MT5 platforms. It automatically identifies and displays price channels on the chart based on the current price movement.
The channel comprises two parallel lines that serve as support and resistance levels for the price. The Trend Channels MT4 shows channels for short-term (M1-M30) and long-term (H1-MN) timeframes.
The Trend Channels Indicator can adjust the angle of the channel if new highs or lows are reached, ensuring an accurate representation of the price movement.
This AutoTrendChannels Indicator can be used on any Forex currency pair and other assets such as commodities, Cryptos, Binary Options, Stock markets, Indices, etc. You can also use it on any time frame that suits you best, from the 1-minutes to the Month charts. Optimal timeframes to work with are M15-H1
This is an entirely free Indicator without any restrictions made by the fxssi.com website. There are more useful free and paid indicators on this website. So check out their other indicators and show some love for the FXSSI Indicators.
What is Trend Channels
Trend channels are a technical analysis tool used in the stock market and other financial market analyses to identify and track price trends. They are used to plot upper and lower bounds for the price of a security, commodity, or currency based on recent price movements and can help traders determine if a market is trending upwards or downwards and whether prices are likely to continue in that direction or not.
Trend channels are drawn by plotting a straight line that connects a series of highs or lows and then extending the line at a slope parallel to the initial trend line. By connecting these lines, traders can form a channel within which price action tends to remain and use it as a reference for buying or selling decisions.
It’s important to note that trend channels are not perfect, and prices can often break out of the channel, which is why traders often use other technical indicators in conjunction with trend channels to help confirm market trends and make informed trading decisions.
How it used in Forex Trading
In forex trading, trend channels are used as a way to identify and track price trends in currency pairs. Forex traders use trend channels to help determine the trend’s direction and identify potential trading opportunities.
Here’s how trend channels can be used in forex trading:
- Identifying trends: By plotting upper and lower bounds for price movements, trend channels can help traders identify if a currency pair is in an uptrend, downtrend, or range-bound market.
- Setting entry and exit points: Forex traders can use trend channels to set entry and exit points for their trades. For example, if a currency pair is in an uptrend, a trader may look to buy near the lower bound of the trend channel and sell near the upper bound.
- Managing risk: By using trend channels to set stop-loss levels, forex traders can manage their risk and limit potential losses. For example, a trader may set a stop-loss just below the lower bound of the trend channel in a long trade.
- Confirming trade signals: Trend channels can also be used to confirm trade signals generated by other technical indicators. For example, if a forex trader is considering a long trade based on a moving average crossover signal, they may wait for the currency pair to reach the upper bound of a trend channel before entering the trade.
It’s important to note that auto trend channels are not a perfect indicator, and price can often break out of the channel. Forex traders often use other technical indicators in conjunction with trend channels to help confirm market trends and make informed trading decisions.
Whom is Auto TrendChannels indicator for?
Trend channels are a fundamental tool for technical analysis and can be easily integrated with any indicator or trading system. For those new to trading, Trend Channels MT4 can provide valuable insights into price movements, particularly in trending directions. It also lets traders keep a close eye on trends in higher timeframes while trading in lower ones.
By following the techniques outlined below, you can master the art of analyzing price movements within the channel and put your knowledge into practice.
For experienced traders, trend channels mt5 serve as a useful reminder, saving time that would otherwise be spent drawing local and global channels. Additionally, traders who utilize wave principles in their analysis can greatly benefit from using the Auto TrendChannels indicator.
How are Trend Channels Drawn by AutoTrendChannels Indicator
To draw a price channel in each time frame, Trend Channels Indicator analyzes the minimum number of bars in price history (typically 200 bars) and identifies key highs and lows that form the initial version of the channel. If the price exceeds the boundaries of the channel, the angle of the lines is adjusted to remain parallel to the previous trend.
A lack of a channel in any time frame on the chart could mean that the bar history settings prevent the construction of a channel with parallel lines. It is also possible for there to be multiple price channels within the one-time frame, which occurs when the price experiences significant changes over a certain period, leading to inconsistent extreme points.
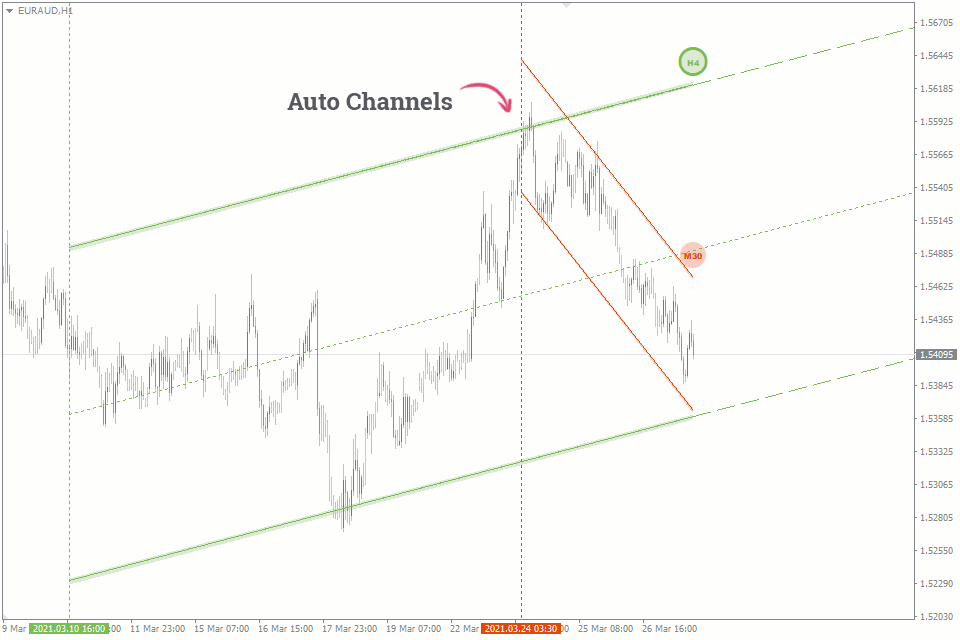
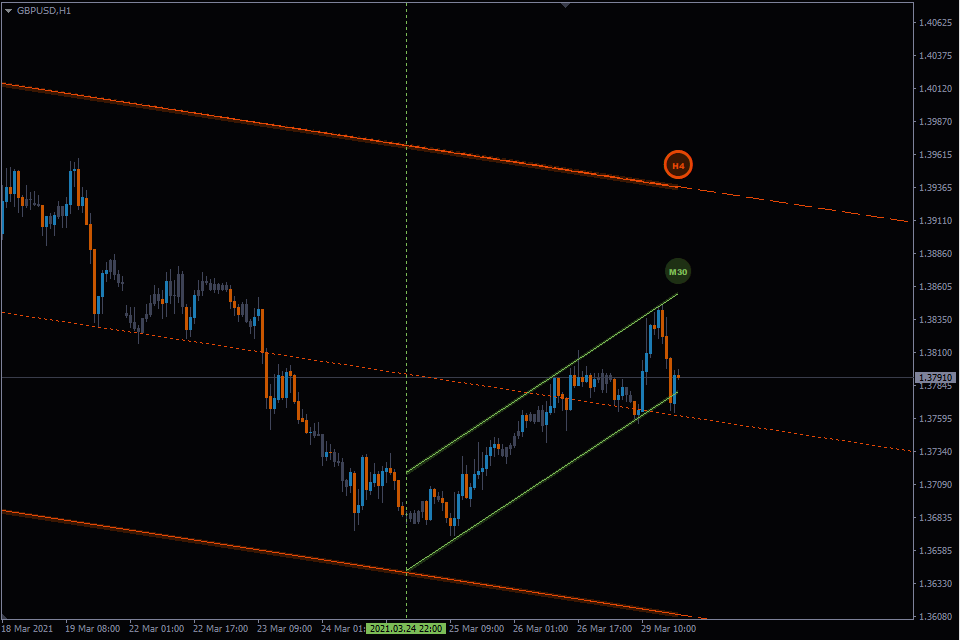
Once the Auto Channels indicator is installed, the channel will be displayed as two parallel lines of the same color, extending from its starting point to the current price.
- Ascending channel (the green line).
- Descending channel (the red line).
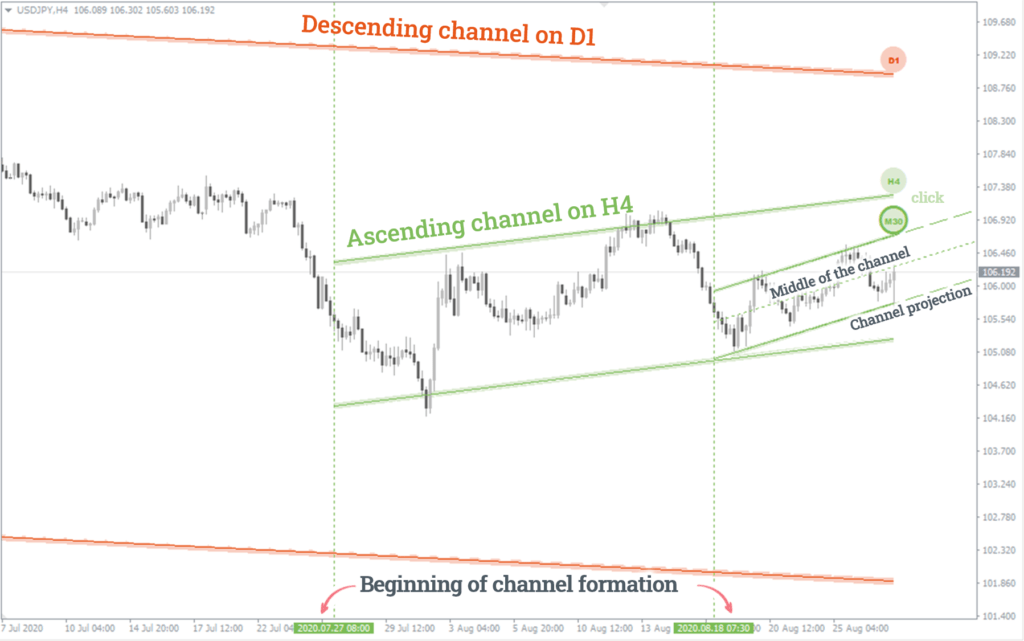
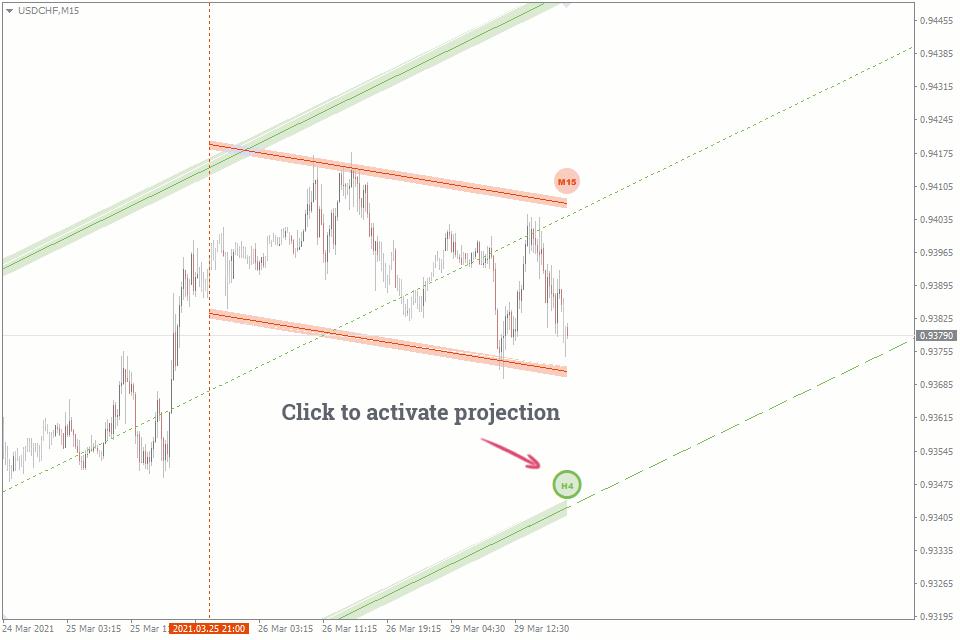
Each channel is accompanied by a marker that indicates the time frame it belongs to. You can view the channel’s projections and midline by clicking on the marker. It is important to note that the midline may not always be centered, as the algorithm may not select High and Low prices that are equidistant from each other.
For improved visual clarity, the boundaries of the channels are displayed with different thicknesses, depending on the time frame in which they were drawn. For example, the boundary of a channel in the H1 time frame will be thicker than the boundary of a channel in the M15.
So, each channel on the chart consists of:
- Channel lines (solid with different thickness).
- Perspective projection lines (thick dashed line).
- Middle lines of the channel (thin dotted line).


AutoTrendLines Input Parameters
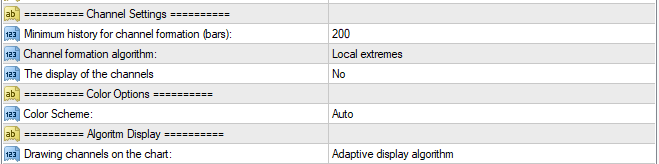
- Minimum history for channel formation (bars) – sets the minimum history depth in bars required for a channel formation.
- Channel formation algorithm – how accurately price extremes will be taken into account.
- The display of the channels – parameters for displaying line thickness.
- Drawing channels on the chart – the filtering of channels for timeframes:
- The Adaptive display algorithm mode is designed to minimize unnecessary information on the price chart. To achieve this, the algorithm displays only those channels that are relevant in each timeframe. For instance, H1 will display channels M30, H1, and higher, while channels M1 and M5 won’t be visible as they are irrelevant. If you switch the chart to M5, you will see both M1 and H1 channels.
- The All Channels will display all the channels found for a given currency pair regardless of the selected timeframe.
Auto Trend Channels Indicator will change Channel colors automatictly, depending on the background color of your chart.
How to trade using the Trend Channels Indicator?
Since the boundaries of the channel are the support and resistance levels, most of the trading methods using channels can be divided into two main groups:
- Bounce (reversal) of the price to the inside of the channel.
- Retest of the boundary after the channel breakout.
Channels are also often used in wave based strategies analysis.
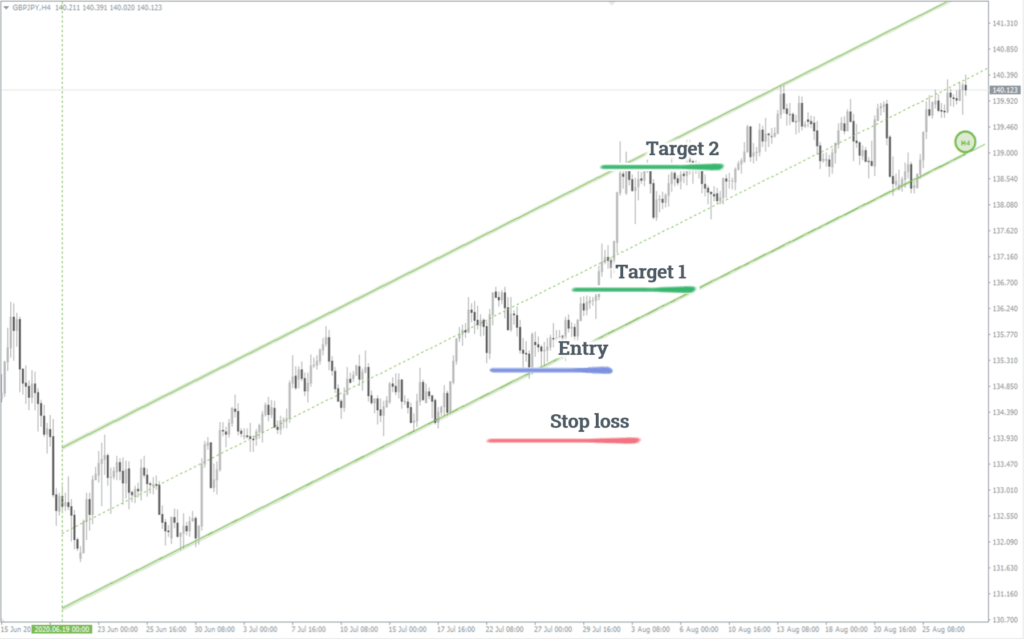
Bounce trading
Bounce trading involves anticipating price movements within the channel. When the price hits the lower boundary, traders buy, and when it reaches the upper boundary, they sell.
To manage risk, it is recommended to place the Stop Loss behind the boundaries of the price action channel. The Take Profit can be set at the previous high or low, depending on the channel’s direction (ascending or descending), or at the expected boundary on the opposite side. Alternatively, traders can use the method for setting Stop Loss and Take Profit described in the strategy guide “Following the ‘Smart Money‘.”
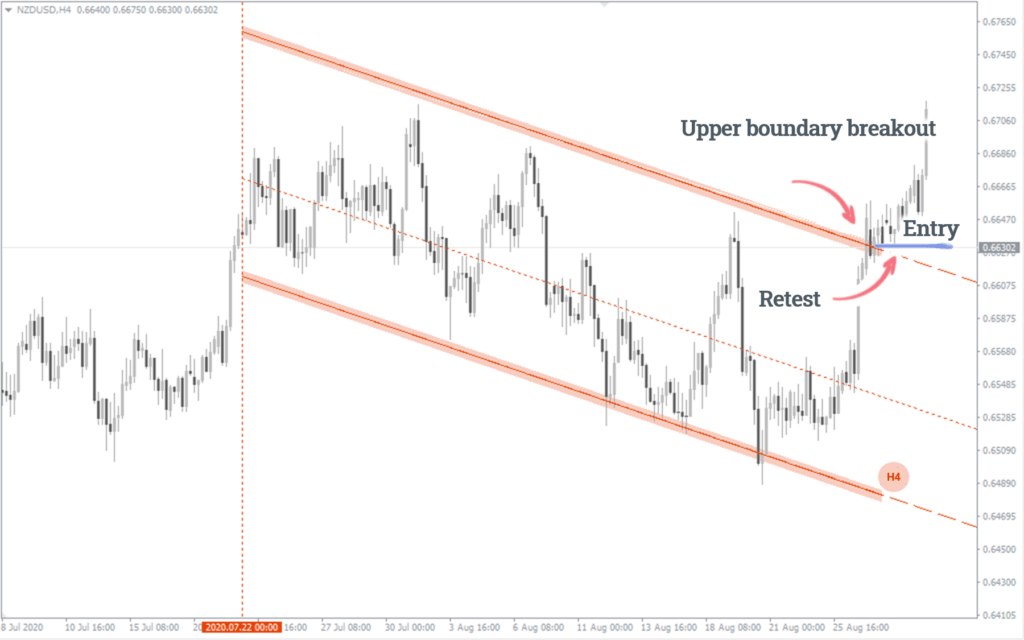
Retest trading
Retest trading refers to when the price breaks one of the channel boundaries and does not return within it. As the channel boundaries serve as support or resistance levels, a breakout changes their “polarity”, meaning that support becomes resistance in a downside breakout, and resistance becomes support in an upward breakout.
Typically, the price will correct itself and approach the breakout boundary before bouncing off it, creating a retest. This is an opportunity to make a trade in the direction of the breakout, regardless of whether the channel is ascending or descending.
Thus, retest trading includes:
- Sell entry point occurs when the channel boundary retest is happening, after its upside breakout.
- Buy entry point occurs when the channel boundary retest is happening, after its downside breakout.
It’s important to keep in mind that the price channel drawn in a higher timeframe carries more weight than channels in lower timeframes. As a result, the likelihood of a price rebound from the boundary in higher timeframes, both inward and outward (after a breakout), is higher.
The trendline indicators are wack and inaccurate .. drawing trendlines is easier to understand when done manually