

This is typical head and shoulders but turned upside down. It also happens on all timeframes and all market instruments (forex, stocks, commodities etc.), so it has the potential to make you money every single day. Let’s start by looking at the main features of an inverse head and shoulders
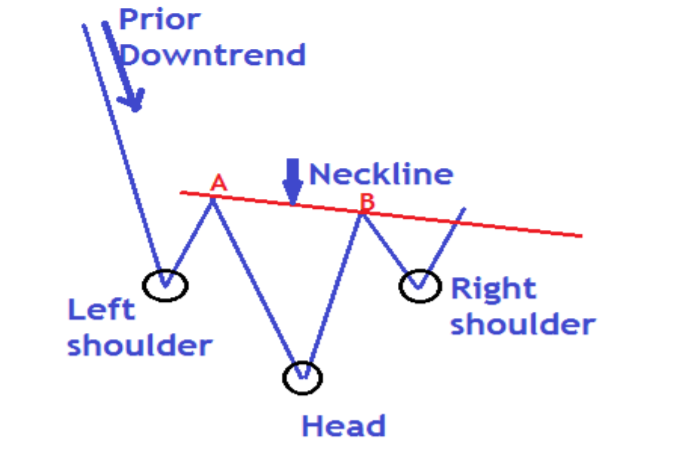
The above illustration shows five features of an Inverse Head & Shoulders pattern that must be present to confirm the pattern has formed.
- Prior downtrend
- Right shoulder
- Head
- Left shoulder
- Neckline
We will look at each part individually and then later put them together with some examples.
Step 1: Prior Downtrend
This is the very first part. There must be a clear prior downtrend. As a general rule, the longer the downtrend lasts, the stronger the reversal is likely to be
Step 2: Left shoulder
At this point, the market moves up to form a higher high. This gives a bottom, which is the left shoulder. But at this point, there isn’t anything substantial to confirm the pattern
Step 3: Head
From the high of the left shoulder, the market advances and makes a lower low, which marks the inverse head’s peak. It then moves up and forms another high. This completes the head structure. At this point, we have the left shoulder and the head of the structure. The pattern is now starting to take shape.
Step 4: Right shoulder
The fall from the high of the head forms the right shoulder. This bottom is higher than the head (a higher low).
Neckline:
The neckline is drawn by connecting high points A and B. High point A marks the end of the left shoulder and the beginning of the head. High point B marks the end of the head and the beginning of the right shoulder. Typically the neckline is not horizontal.
Psychology on the Inverse head and shoulders pattern (Why does it form?)
The prior downtrend indicates a lot of strength in the sellers, pushing prices lower. As the sellers are tiring, there is a general shift of strength from the sellers to the buyers. At this point, prices start to rise as more buyers come in. This is how the left shoulder gets to be formed.
At the high of the left shoulder, we have more sellers who are not yet convinced of the rising prices and take advantage of rising prices even to sell more. This leads to prices pushing even much lower to form the tip of the head. Most of the sellers exit their positions, which causes a lot of panic buying that completes the head structure. So if you just sold at the tip of the head, you would now get trapped. The inverse head is a ‘bear trap’
At the high of the head, a few sellers come in to take advantage of the high prices. This causes a slight fall in the prices up to the tip of the right shoulder. Remember, we are having very few sellers in the market this time. That’s why the tip of the right shoulder is higher than the tip of the head.
So the right shoulder is fully formed when almost all the remaining sellers exit positions, and now more buyers enter the market, pushing prices higher.
At this point, we are waiting for a neckline break to confirm the buy entry. The neckline break is only confirmed the candle breaks and closes above the trendline
How to make entries on the Inverse Head and Shoulders
On the Inverse head and shoulders, there are 2 ways to make entries;
Aggressive entry and Conservative entry
Let’s look at the example below. This was on gold 30 minute chart that we traded.
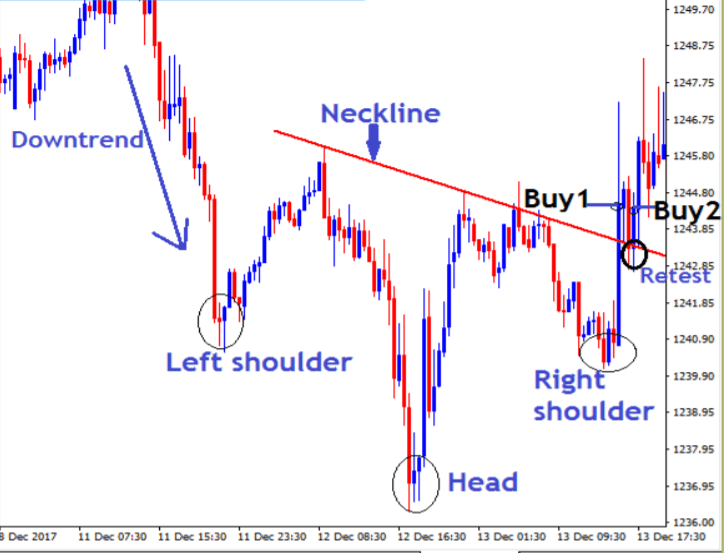
An aggressive entry (Buy 1)
An aggressive way to enter the inverse head and shoulders is to enter as soon as the candle breaks through and closes above the neckline. Just as shown at buy one entry
A conservative entry (sell 2)
A more conservative way of trading the neckline break is to wait until the price has broken through the neckline and then retested it as support. Just as shown on the buy two entry
This is based on the fact that a broken resistance becomes new support and vice versa. So when the candle closes above the neckline. Wait for the price to come back to the neckline for a retest and find support, then you can enter a buy position. Like we mentioned above, waiting for a retest accomplishes two things:
- It helps validate the recent break
- It offers a more favorable risk-reward ratio
This combination is why I almost always opt for the conservative method, and it is the same method I used to enter this buy position. Of course, there is a greater chance of missing an entry by waiting, but the potential reward for doing so is equally significant.
Read More : How to Trade Forex Head and Shoulders Pattern
Setting Stop loss (SL) on inverse head and shoulders
There are two ways of setting stop losses that I will share with you here. Like conservative and aggressive entries, we can also put our stop losses aggressively or conservatively.
Let’s first take a look at our buy positions on a chart with SL set

Conservative Stop loss setting (Stop loss 1)
Here you set the stop loss just below the right shoulder. As shown on Stop-loss one on the chart above,
this gives the market enough breathing space between the entry and stop loss but cuts your potential profit in half or worse since the Stop is very wide.
Setting Aggressive Stop Loss (Stop loss 2).
I really prefer to use the aggressive stop loss. Simply because it allows for a much better risk to reward ratio while still offering room for price to swing up and down.
When you set your stop above the last swing low, you’ve cut your stop loss distance from 44 pips down to 17 pips, yet keeping the same target. This earns you more money with a small risk.
The aggressive Stop loss 2 is one I used on the trade. This kind of stop-loss setting is logically applicable when using conservative entry (Buy 2).
How to set targets (Take profit) on inverse head and shoulders.
The most logical way is to use a measured objective. Let’s look at how that would have been done on our above trade.
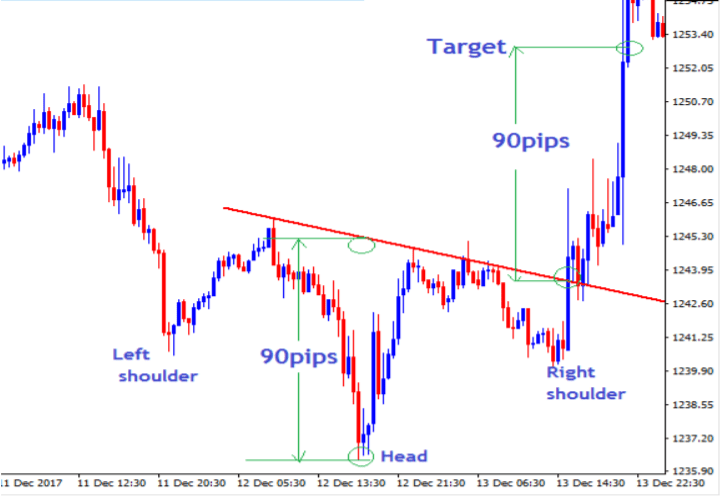
Note that on the GOLD chart above, we measured the vertical distance from the head’s peak to the neckline (90 pips). Then measured this same distance of 90 pips up from the neckline, beginning at the point where prices penetrate the neckline after the completion of the right shoulder.
The target is same whether you entered aggressively or made a conservative
entry.
Ok That’s It for The time , Lets Talk About how to trade forex Double Top pattern In next article
I wish everyone successful trading and consistent profits !!
Join Our Forex Forum and Community : Visit


working ea find bro
or indicator to