


Most scalpers lose money because they chase price instead of reading it. This strategy changes that. You’ll start by spotting the short term trend on the 15 minute chart, then drop to the 3 minute to time precise reversals or pullbacks getting in early and getting out before the crowd piles in.
In this guide, you’ll learn every step from trend analysis to entries, exits, risk management, and session timing (in ET). To make things even easier, I’ve included a bonus Reversal Detector Indicator that highlights candlestick reversals automatically, plus a quick note on why cTrader and FTMO make executing this setup effortless.
Table of Contents
Why This Strategy Works?
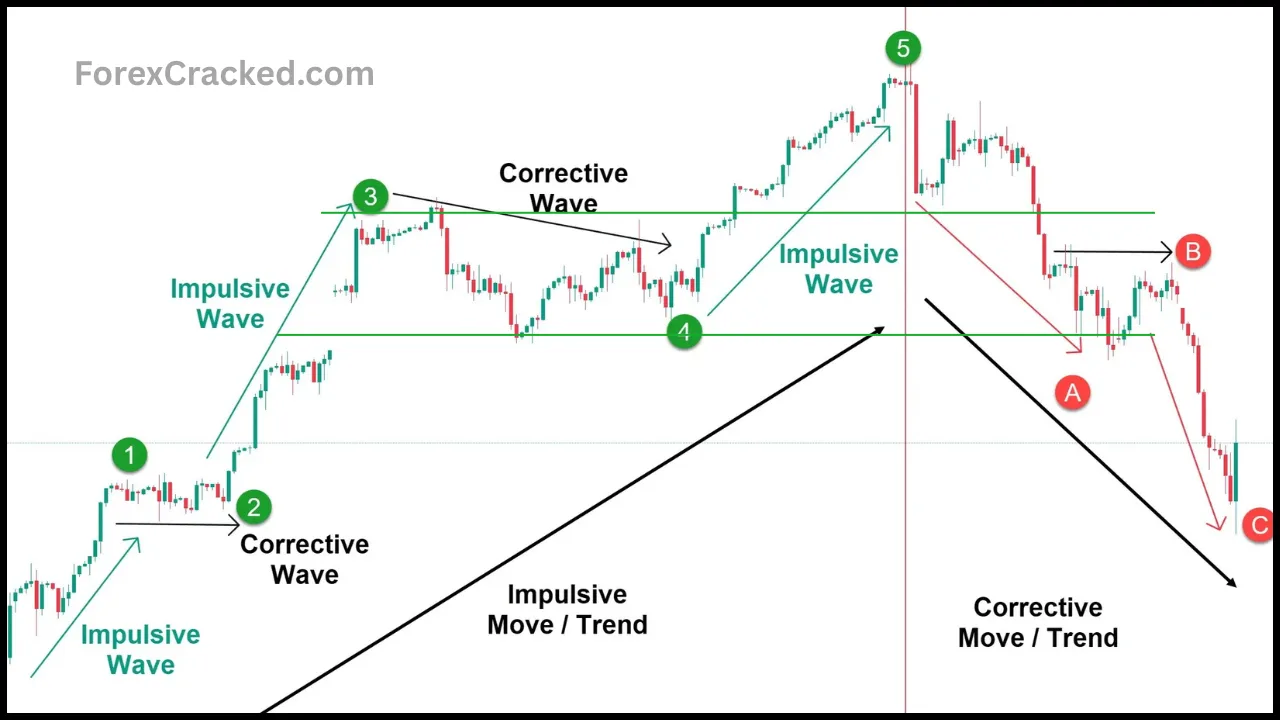
1. Price Moves in Waves Not Straight Lines
Every strong trend eventually pauses or pulls back. When price stretches too far from its recent balance, it often snaps back just like a rubber band losing tension. These reversal or correction moves create some of the cleanest short term opportunities for scalpers who know where to look.
2. Multi-Timeframe Alignment Gives You Precision
By combining the 15 minute chart for trend context with the 3-minute chart for entries, you’re reading the same market story at two different speeds.
- The 15m chart reveals overall direction, structure, and exhaustion points.
- The 3m chart shows when momentum shifts usually through reversal candles, failed breakouts, or micro structure changes.
This alignment keeps you trading with the broader flow, while timing entries at turning points the crowd hasn’t reacted to yet.
3. Structure Is Where Momentum Fades
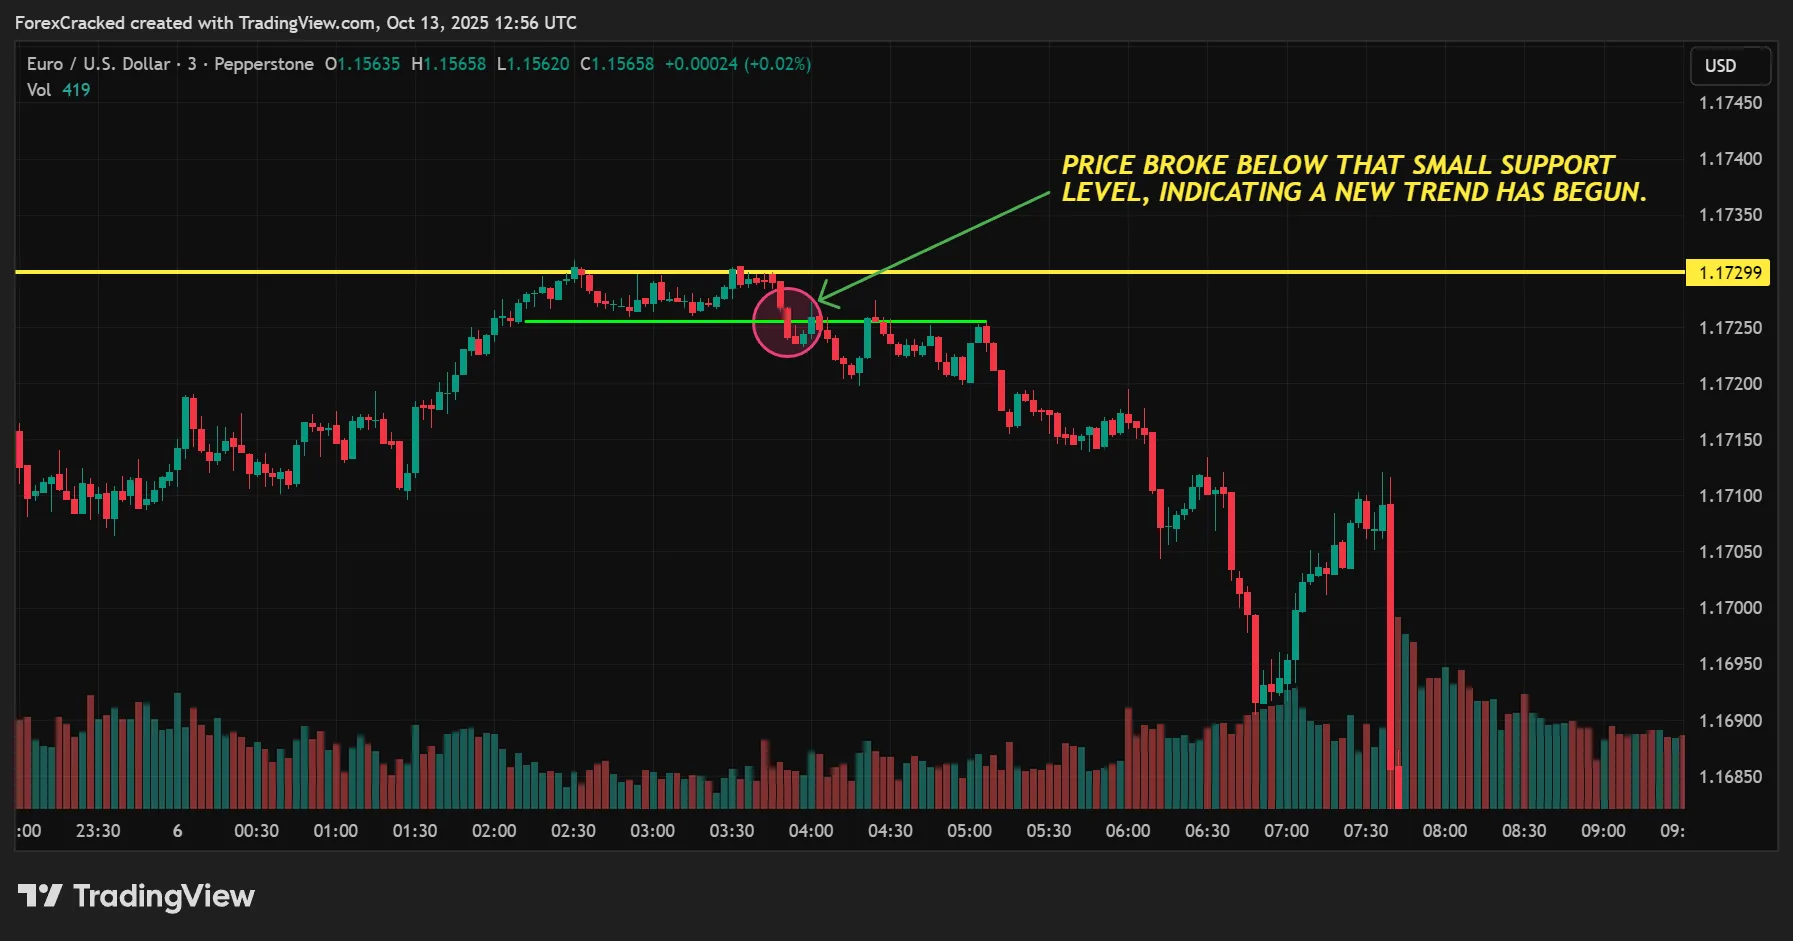
Markets respect structure previous highs, lows, and zones where volume built up. When price pushes into these key support or resistance areas, momentum tends to slow or reverse. By identifying these zones first on the 15m, then confirming reversals on 3m, you’re trading where probability is on your side, not in the middle of random noise.
4. Small Stops, Early Exits, Big Edge
The goal isn’t to catch the whole trend it’s to capture the clean middle of the move. Tight, structure based stops mean small losses when wrong, while taking profit before the next major level locks in gains before liquidity battles start. This balance between early entry and disciplined exit is what gives the method its edge.
Step-by-Step Rules for the Multi Timeframe Reversal Scalping Strategy
1. Build Context on the 15 Minute Chart (Trend Foundation)
Before anything else, zoom out to the 15 minute chart. This is where you understand the bigger picture behind your scalp.
- Identify structure: Map out the current trend using swing points higher highs and higher lows for an uptrend, or lower highs and lower lows for a downtrend.
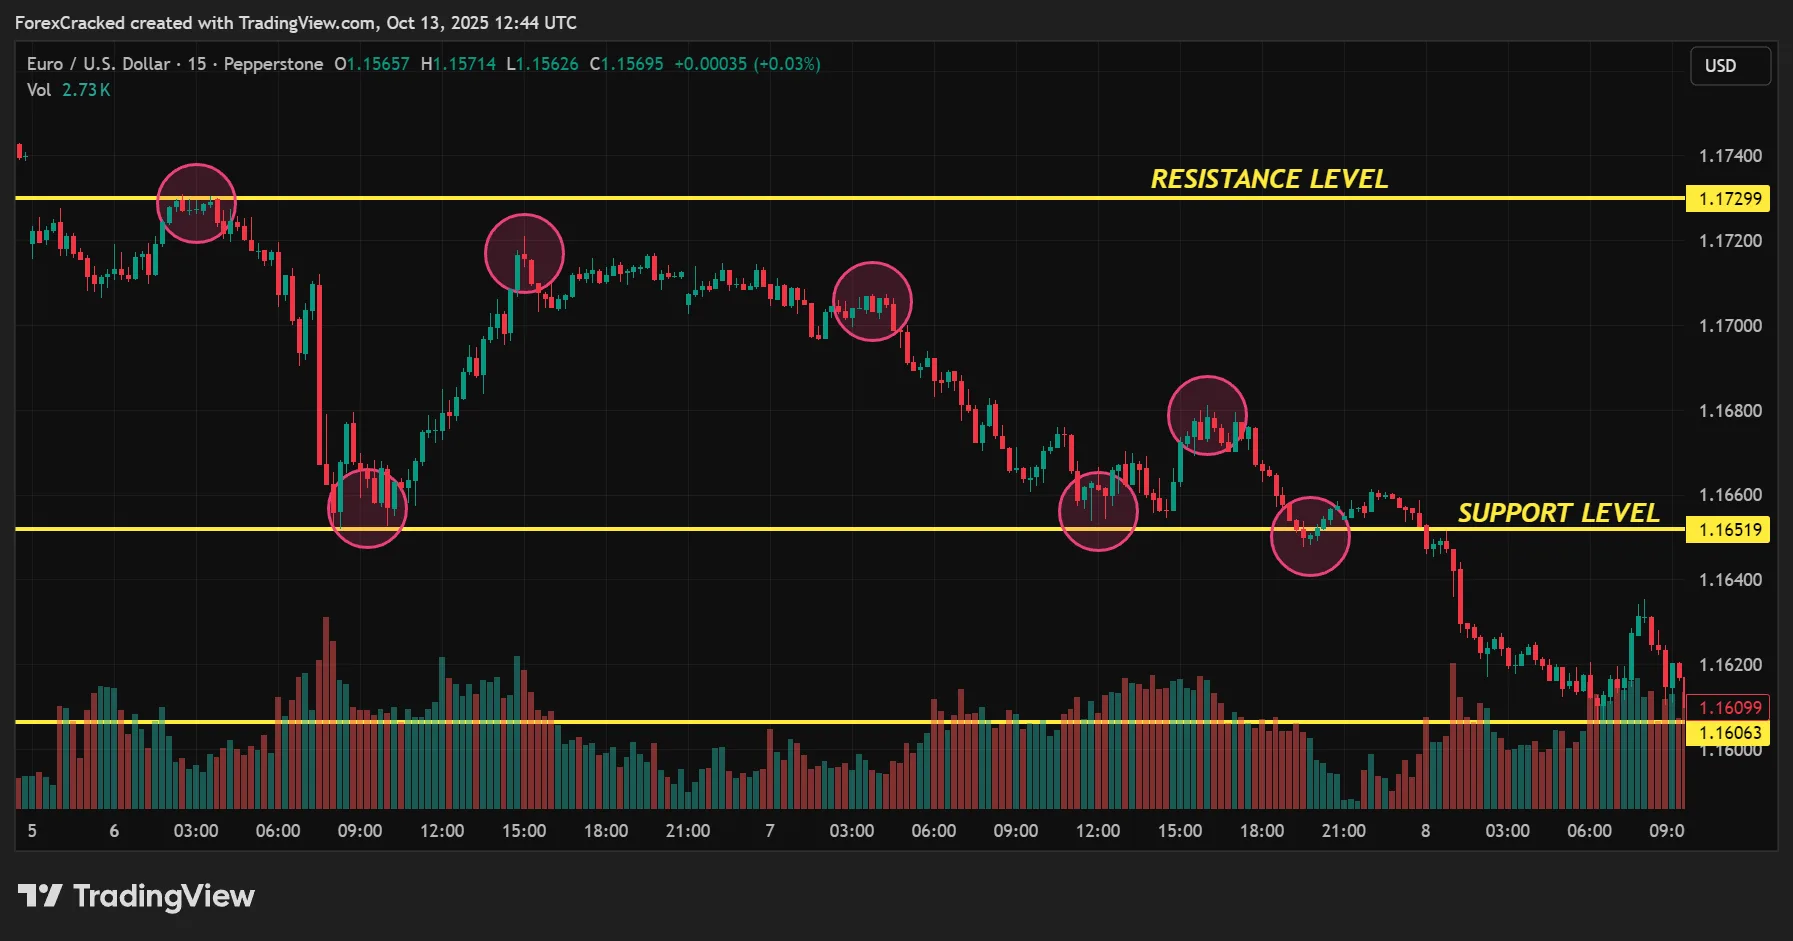
- Mark key zones: Highlight the major support and resistance levels that have been tested multiple times. These zones act like magnets for price and are the areas where reversals or strong reactions often occur.
- Assess extension: If the price has been trending for a long stretch and is now pressing into a strong level, note that it signals potential exhaustion and sets up the conditions for a reversal or pullback trade.
Tip: Always keep your chart clean. Fewer, more meaningful levels are better than cluttered lines.
2. Drop Down to the 3-Minute Chart (Precision Execution)
Once your 15m setup is clear, switch to the 3-minute chart to fine-tune your entries.
- Confirm direction: Make sure the 3m chart supports what you saw on the 15m the same broad trend structure should still be visible until price approaches your marked zones.
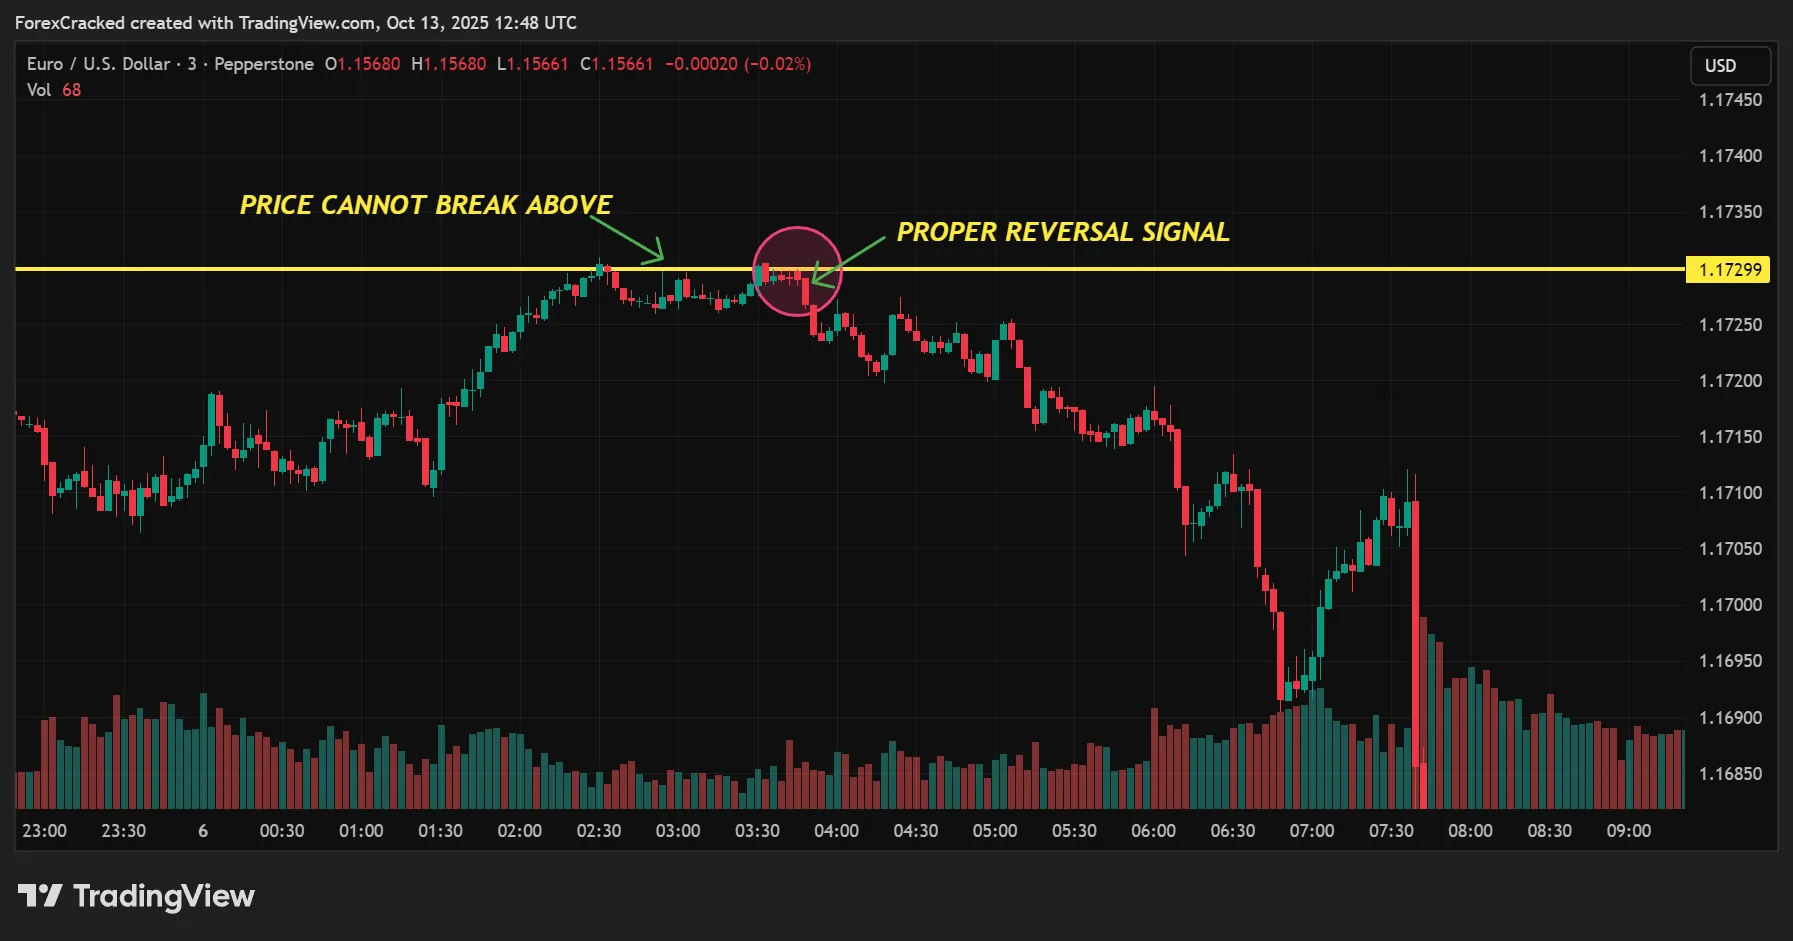
- Watch for reversal behavior: At or near a key level, look for candlestick reversal patterns (like engulfing candles, pin bars, or multi-bar rejections). Combine this with a micro structure shift, such as a failed attempt to make a new high/low or a small trendline break.
This helps you anticipate when the move is truly losing steam, instead of guessing.
3. Entry Trigger (Act on Confirmation, Not Emotion)
Now it’s time to take action only after confirmation.
- Trigger: Enter after you see a clear reversal or pullback signal form near your predefined level. Avoid jumping in early based on anticipation alone.
- Filter for quality: Prefer setups where the move into the level was fast and one sided, followed by strong rejection or engulfing patterns showing immediate momentum shift.
Remember: Great trades form at strong levels after exhaustion, not in the middle of random candles.
4. Stop Loss: Tight but Logical
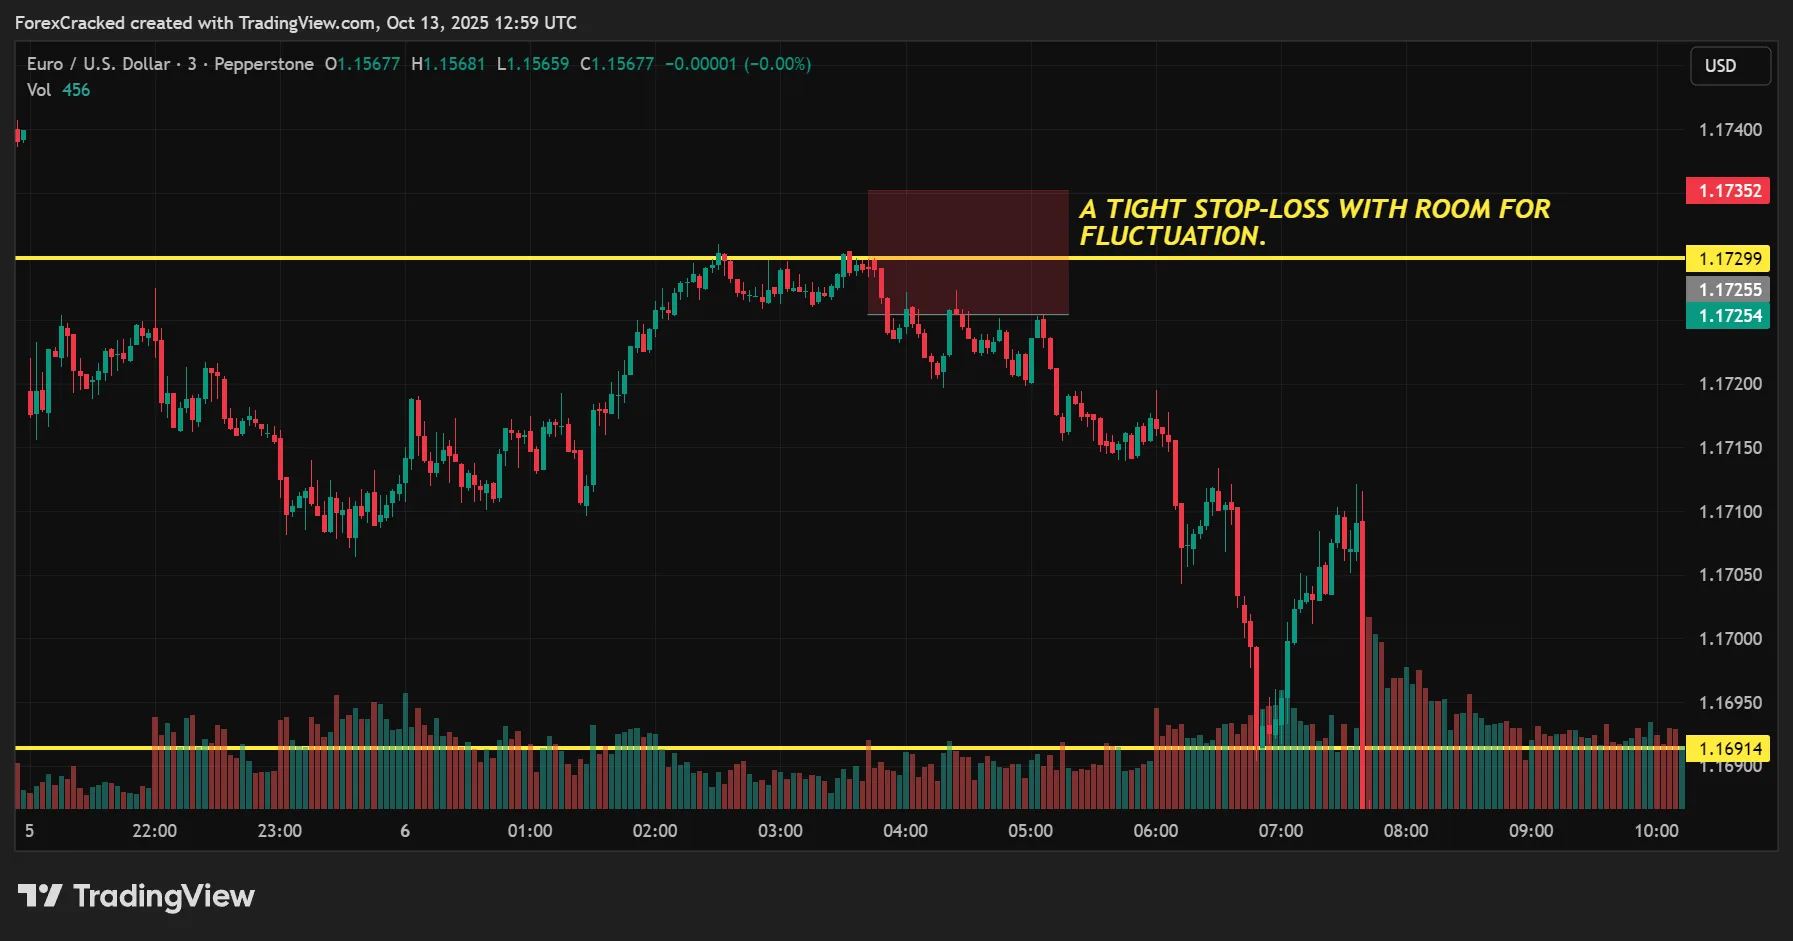
A good scalper survives by cutting losses quickly.
- Place your stop loss just beyond the level that confirmed your entry (below support for longs, above resistance for shorts).
- Leave enough breathing room for normal market noise but not so wide that your risk-to-reward (R:R) drops below 1:2.
This keeps your losses small while giving each trade enough space to work naturally.
5. Take Profit: Get Out Before the Crowd
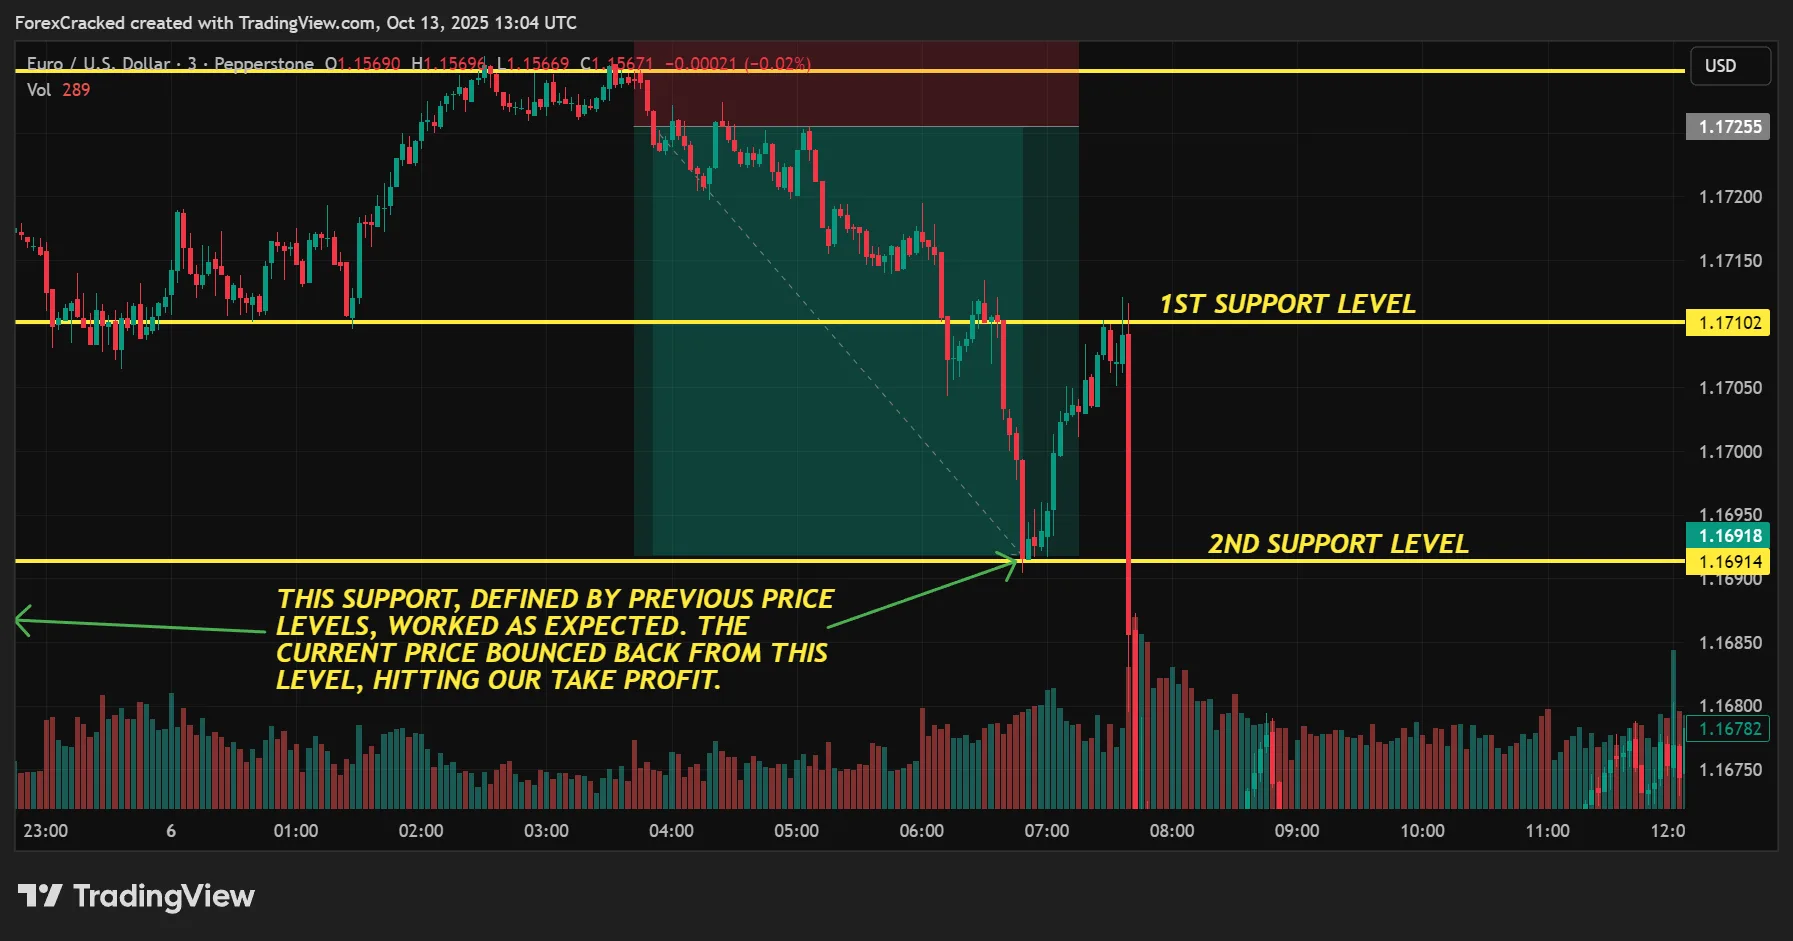
The goal here is to capture the clean part of the move, not to predict the entire trend.
- Set your take-profit at the second major support or resistance on the 3m chart, counting from your entry point.
- This exit approach allows you to bank profits before heavy liquidity zones where many traders tend to pile in or take opposite positions.
By exiting early, you avoid the messy price action and slippage that often follow big moves.
6. Timing Window: Trade When the Market Moves
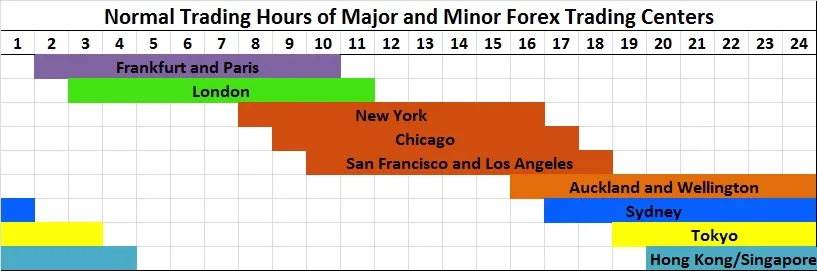
This strategy works best during high-liquidity hours when volatility is clean and directional.
- Focus on 8:00 AM to 12:00 PM ET, when major pairs like EURUSD and GBPUSD are active during the London–New York overlap.
- Close all positions by 12:00 PM ET beyond that, momentum fades and spreads widen.
- Once you collect enough data, slightly adjust your session window to suit your preferred pairs and broker execution times.


Download a Collection of Indicators, Courses, and EA for FREE
7. News Filter: Protect Your Edge
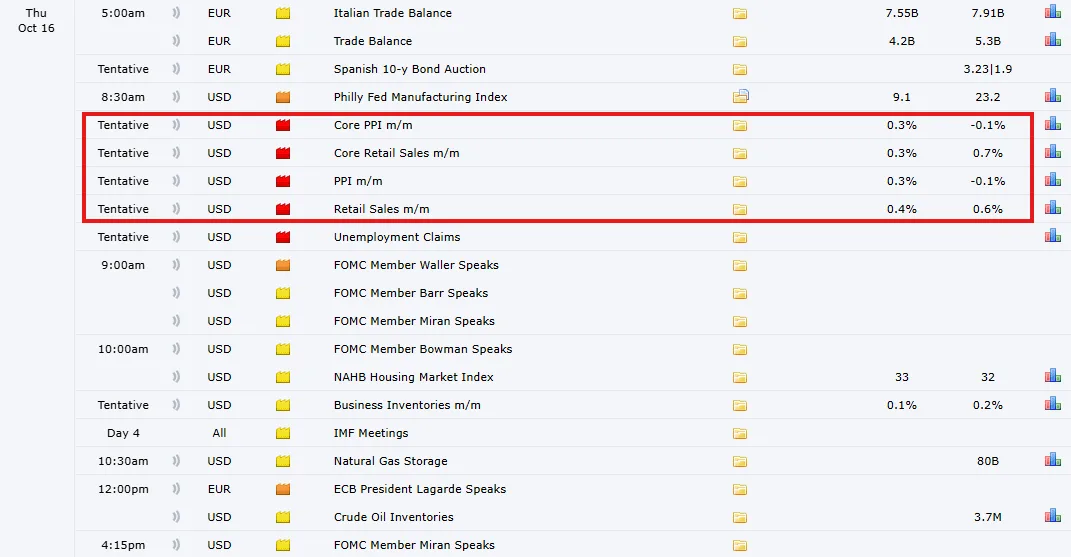
Certain days just aren’t worth trading.
- Avoid entering trades during major economic releases such as FOMC statements, CPI, PPI, and employment data. These events cause abnormal volatility that can easily hit your stops before the market stabilizes.
- If you’re unsure, check an economic calendar before every session. Sometimes the best trade is no trade at all.
8. Pair Selection & Optimization
- Stick to 1–2 major pairs you can master (e.g., EURUSD, GBPUSD).
- Log trades for 2–4 weeks; optimize level quality, time within 8–12 ET, and pattern reliability.
- If R:R slips below 1:2 often, your stop is too wide or you’re entering late.
Quick Recap
- 15m: Identify structure and mark your key levels.
- 3m: Wait for price to reach those levels and show reversal patterns.
- Enter after confirmation; avoid impulse trades.
- Set a tight, logical stop and aim for a 1:2 or better R:R.
- Exit at the 2nd key level take profits early, avoid late reversals.
- Trade 8:00–12:00 ET only; close all by noon.
- Skip high-impact news days protect your edge.
- Stick to 1–2 major pairs.
Risk & Position Sizing: Keep It Simple, Stay Consistent
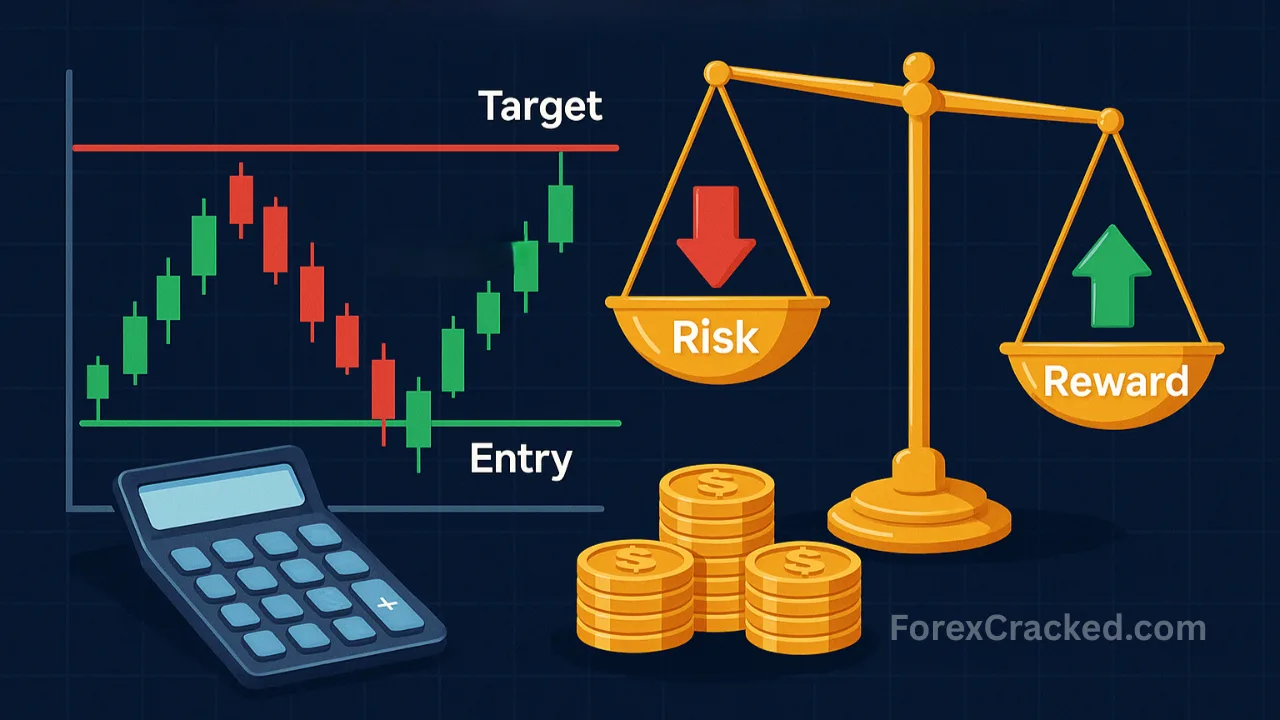
Why Position Sizing Matters
Even the best strategy fails if your position size is random. Proper sizing ensures every trade carries the same percentage risk, whether your stop loss is 5 pips or 25. This keeps emotions out of your trading and makes your results more consistent over time.
The goal isn’t to avoid losses entirely it’s to make sure that when you lose, it barely dents your account, and when you win, your profits multiply faster than your drawdowns.
Step 1: Use Fixed Fractional Risk
Decide how much of your account you’re willing to risk per trade.
- Beginners: 0.5% to 1% is ideal.
- Experienced traders: Up to 2% is acceptable if you have solid discipline.
This means if your account balance is $1,000 and you risk 1%, your maximum loss per trade = $10.
Keeping your risk percentage fixed allows your account to scale naturally as it grows (or shrink gracefully during drawdowns).
Step 2: Calculate Position Size by Stop Distance
Now that you know how much you’ll risk, convert that into lot size using a simple formula:
Position Size (lots) ≈ (Account Risk in $) ÷ (Stop Loss in pips × Pip Value)
For example:
If your account risk is $10, stop loss is 10 pips, and pip value is $1 per pip,
then → $10 ÷ (10 × 1) = 0.1 lots
This way, even if your stop changes, your risk remains constant. You’ll never overexpose yourself or cut profits short because of inconsistent sizing.
Step 3: Automate It with a Free Calculator
To make things easier, use the ForexCracked Position Size Calculator.
This free online tool helps you:
- Instantly calculate lot size based on your account balance, stop loss, and risk %
- Avoid manual math errors
- Adjust sizing in seconds for any currency pair
Just input your account size, risk percentage, and stop-loss distance the calculator will handle the rest.
Step 4: Understand the Edge
When your risk per trade stays constant, your edge compounds naturally.
One win at 1:2 risk-to-reward easily offsets two small losses. That’s the math behind why disciplined traders stay profitable even with a 50% win rate.
By controlling position size and maintaining tight, structure-based stops, you protect capital while letting your winners do the heavy lifting.
Chart Checklist
- 15m: Trend & major S/R marked
- 3m: Same trend showing; price reaches a major level
- Reversal pattern forms; micro structure shift confirms
- Entry on confirmation; SL just beyond the level
- TP at 2nd S/R on 3m (take the clean chunk)
- R:R ≥ 1:2
- Within 8:00–12:00 ET; no major news today
Bonus: Free Reversal Detector Indicator
Spot Reversals Instantly: Without Scanning Every Candle
Finding reversal setups manually can be time consuming. The Reversal Detector Indicator helps you automate that process so you can focus on chart structure, risk, and execution instead of endlessly scanning for candle patterns.
This indicator, available free on ForexCracked, is designed for both MT4 and MT5 platforms. It automatically detects the most reliable candlestick reversal formations and highlights them directly on your chart helping you confirm when momentum is shifting around your marked support and resistance levels.
How It Works
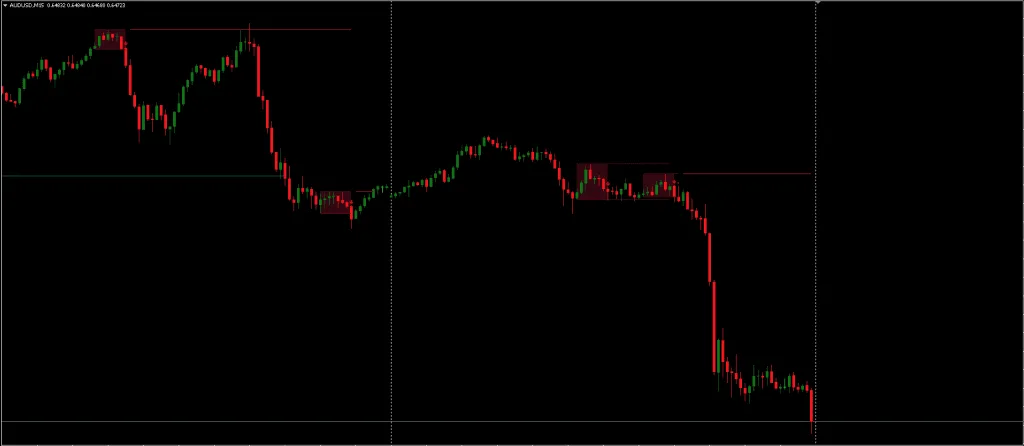
The indicator scans every candle in real time, comparing their structure, wicks, and body ratios to known reversal patterns such as:
- Bullish/Bearish Engulfing
- Hammer and Shooting Star
- Morning Star / Evening Star
- Tweezer Tops & Bottoms
- Doji Reversal Signals
Once a valid pattern forms, it places a visual marker (arrow or symbol) on your chart, showing the exact point where a potential reversal may start. This lets you quickly validate setups that align with your 15m→3m framework.
Key Features & Benefits
- Automatic Pattern Detection: Recognizes dozens of reversal candlestick setups instantly.
- Multi-Platform Support: Works on both MetaTrader 4 and MetaTrader 5 with identical accuracy.
- Customizable Settings: Adjust colors, alerts, and filters to fit your personal trading style.
- Built in Trend Filter: Helps reduce false signals by highlighting patterns that appear in the direction of the overall trend.
- Confluence Tool: Pairs perfectly with manual analysis of support and resistance use it to confirm entries, not replace them.
Best Way to Use It
Integrate the Reversal Detector Indicator into your multi timeframe reversal scalping workflow:
- Use the 15-minute chart to define trend direction and key levels.
- Drop to the 3-minute chart to watch for reversal patterns near those levels.
- When the indicator confirms a pattern with a visual alert, cross-check it with price action and structure before entering a trade.
Important: Use the indicator as confirmation, not a stand-alone signal. Confluence with your price action analysis is what makes it powerful.
Why It Helps Scalpers
For scalpers and day traders, speed and precision matter. This indicator saves time by automating pattern detection and keeps you from missing high-probability reversals during fast market conditions. It’s especially effective on major pairs like EURUSD, GBPUSD, and USDJPY during the London and New York sessions.
Ready to add this tool to your charts? Grab it here →
Why cTrader + FTMO Makes This Easier
Precision Trading Needs a Precision Platform
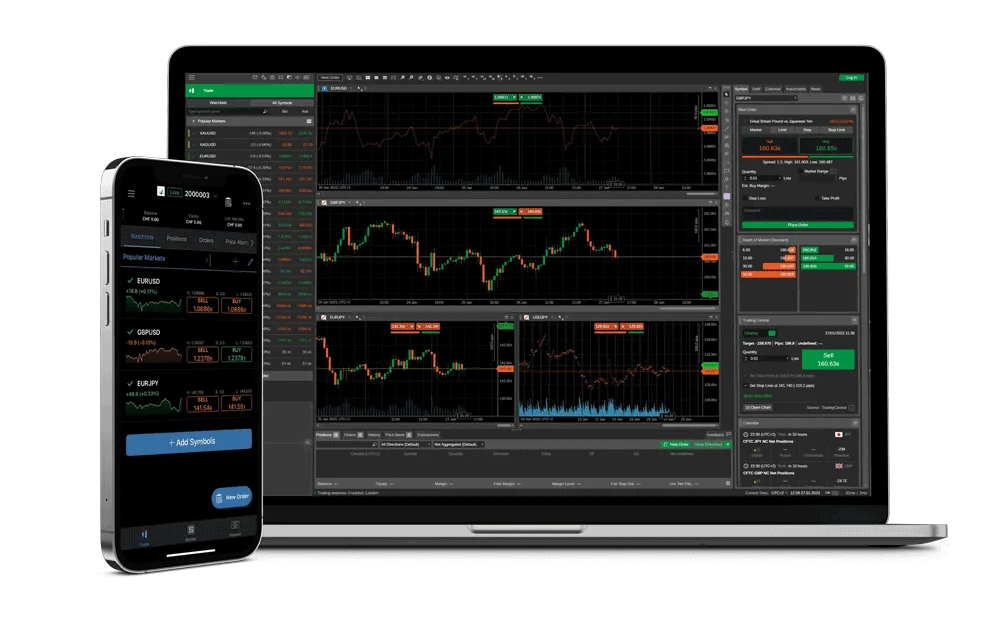
This reversal scalping strategy depends on fast, accurate entries and position sizing based on stop distance two things that can feel clunky on older platforms. That’s where cTrader comes in. It’s built for traders who value speed, clean charting, and full control over every order.
With its modern interface, lightning fast execution, and intuitive risk tools, cTrader lets you manage trades the way scalpers should quickly, precisely, and confidently. Whether you’re on desktop, web, or mobile, the experience remains almost identical, which means you can monitor or adjust trades seamlessly no matter where you are.
Why FTMO + cTrader Is the Perfect Combo

FTMO fully supports cTrader accounts, making it one of the best environments to apply this strategy in real-world funded trading. Here’s why it fits perfectly:
1. Cross-Platform Speed & Consistency
Trade from desktop, web, or mobile with a near-identical user interface. You’ll never miss setups during your session window (8 AM – 12 PM ET), even when you’re away from your main screen.
2. Smart Risk & Trade Management
FTMO’s Quick Trade Manager on cTrader allows you to pre-define your Stop Loss (SL), Take Profit (TP), trailing stop, and break-even settings before you even enter a position. You can also adjust position size instantly based on your chosen stop distance exactly what this strategy requires.
3. Professional Execution Environment
FTMO provides low spreads, deep liquidity, and stable execution, all crucial for scalping where every pip counts. cTrader’s transparent order book and fast execution engine ensure you get filled cleanly without unnecessary slippage.
4. Seamless Account Options
FTMO offers cTrader alongside MT4, MT5, and DXtrade, but for this strategy with its focus on tight stops and precise entries cTrader stands out as the most efficient and trader-friendly platform.
Why Scalpers Love cTrader
- One-click trading for lightning fast entries and exits.
- Advanced charting with customizable templates and hotkeys.
- Real-time risk visualization know your exposure before you hit “Buy” or “Sell.”
- Integrated depth of market (DoM) for transparency and accurate volume view.
- Customizable layouts to keep your 15 m and 3 m charts side-by-side perfectly.
In short, cTrader removes friction letting you focus on timing the reversal, not fighting your platform.
Take It to the Next Level
Once you’ve practiced this setup on demo, the next step is to test your skills in a real-world environment. FTMO’s Trading Challenges are an excellent way to prove consistency and scale your capital responsibly while using cTrader’s intuitive interface.
Whether you’re refining your entries, back-testing reversals, or trading live sessions, the cTrader + FTMO combo gives you the speed, control, and precision your scalping strategy deserves.
Common Mistakes to Avoid
- Front-running entries before reversal confirmation
- Chasing price after a big candle
- Ignoring the news filter
- Trading outside your time window
- Moving stops wider to “survive” noise (kills R:R)
- Taking every indicator signal without 15m/3m structure and S/R
Conclusion
Trade with structure, manage your risk, and stay patient that’s how short term traders last long term.
No strategy is perfect and that’s exactly why risk management and discipline matter most. Always backtest, forward test on demo, and never risk money you can’t afford to lose. Trading is a skill built through consistency, not luck.
You don’t have to catch every trend to win. The real edge comes from capturing clean pullbacks and reversals at well defined levels. This 15-minute to 3-minute reversal framework keeps your decision making clear and repeatable: map structure, wait for price to come to you, strike with precision, and exit before the crowd.
Use the Reversal Detector Indicator as your visual assistant to confirm setups faster it saves time without replacing your analysis. And if you want smoother execution and smarter position sizing, consider trading on cTrader with FTMO. The combination gives you the speed, control, and environment this strategy truly thrives in.
FAQ
1. Is this strategy for beginners?
Yes. if you can map S/R and follow rules. Start with demo.
2. What R:R should I target?
≥ 1:2. If you can’t get that consistently, your stops/entries need refinement.
3. Best time to trade?
Focus on 8:00–12:00 ET for majors; flatten at noon.
4. Does the indicator repaint?
Treat all pattern detectors as helpers use them with structure, not alone.
5. Why cTrader for FTMO?
Clean execution, cross platform access, and available risk/order tools via FTMO.