This is one best, yet more powerful and awesome strategies that can only be figured out and mastered by an expert trader. It’s a professional forex trading strategy known by few, which is untold. Now let’s first get clear with certain basics about Fibonacci trading.
Basic Fibonacci Trading
First, draw a Fibonacci for the previous day’s lowest and highest market values. Then you can make trades based on the basic Fibonacci pre-rules.
Buy
When a Market moves from the top of Fibonacci from 0 to 1, the trade is done on the following set of pre-rules which win trade most of the times
- 0.236 – Buy
- 0.382 – Target
- 0.500 – Reversal
- 0.618 – Buy
- 0.764 – Target
Sell
When a Market moves from the top of Fibonacci from 1 to 0, the trade is done on following set of pre-rules which win trade most of the times
- 0.764 – Sell
- 0.618 – Target
- 0.500 – Reversal
- 0.382 – Sell
- 0.236 – Target
Now let me uncover the 3 days Average Fibonacci Forex Trading Strategy. It’s the best professional Forex trading strategy which is untold so far.
THREE DAYS AVERAGE FOREX FIBONACCI STRATEGY
The three days average, Fibonacci strategy can be achieved by drawing a Fibonacci for the past 3 days Low and the high. Now you can make effective trades based on the three days average, Fibonacci predicting the market movement, and stay cautious about market reVersal and breakouts.
The actual strategy is you can make use of 3 days average to have a clear idea about the market movement and when to initiate a trade and when not to. This can be very helpful for professional traders to make the best possible trades minimizing their losses.
Now let’s see a few example trades where the 3 days average, Fibonacci strategy actually performs its magic.
Examples of Three Days Average Fibonacci
GBP/JPY – 30MIN
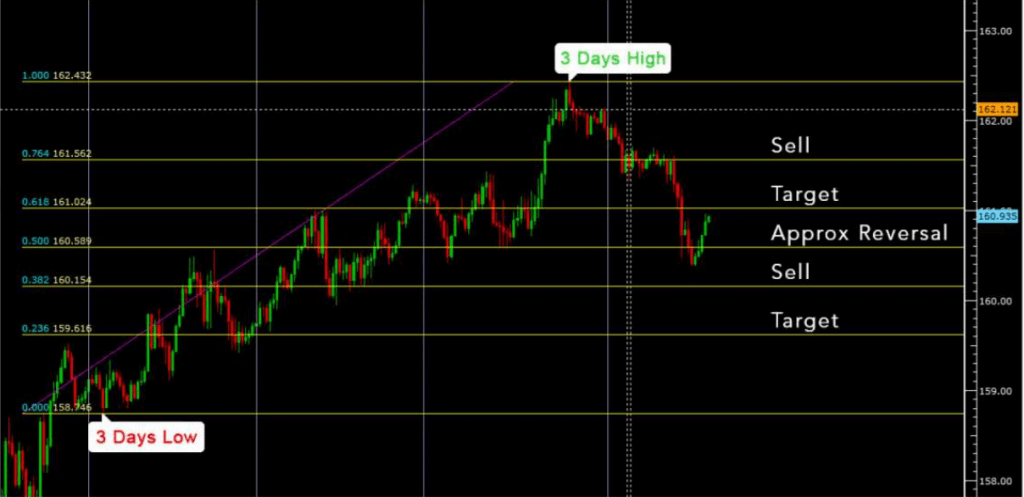
In the above image, you can clearly see the Fibonacci that is drawn from the past 3 day’s market low and high. Now let’s see what the strategy really does in here,
° The current day market open is at 161.920
⦁ Based on the basic Fibonacci trading rule, since the market moves from 1 to 0, you can initiate a Sell trade at 161.562.
° You can have your target at 161.024.
⦁ Then watch the market breaking the resistance at 160.589.
° Then you can see clearly as predicted there is a 50 % chance for reversal and the market reaches the low of 160.375 and then it gets reversed.
Thus, using this 3 days strategy a professional trader can be cautious about the trade he makes and can make the best possible trades to make a profit.
Three Days Fibonacci Buy
EUR/USD – 30Min
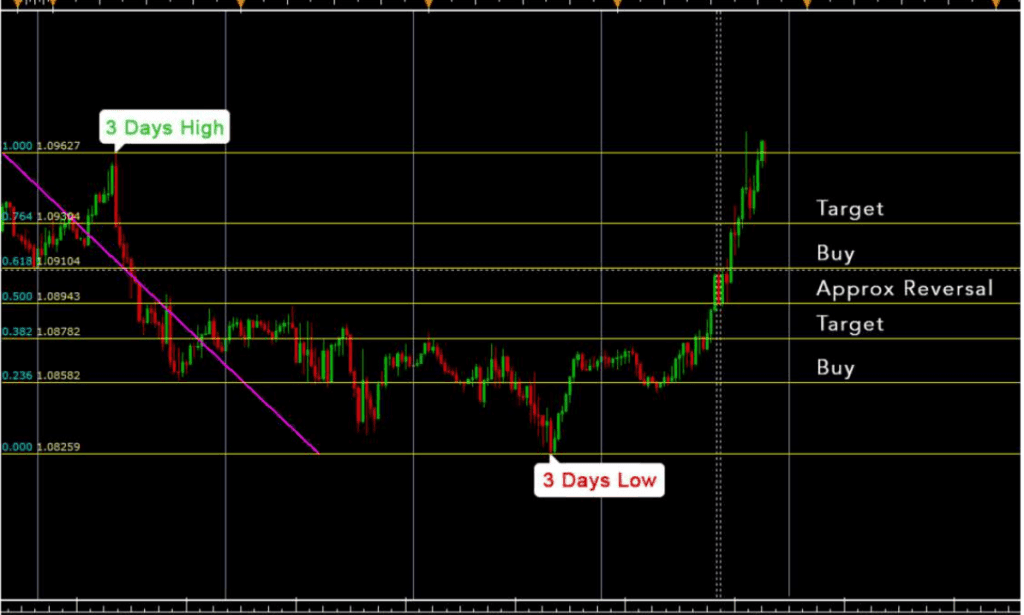
In here based on the past 3 days Fibonacci the high and low are marked. The current market opens at 1.08679. Since the opening of the market is at buy trend you can afford to initiate a buy trade there and can set your target at 1.08782 or you can just skip it until it crosses 1.08943. Then you can initiate buy at 1.09104 and set your target at 1.09304.
Three Days Fibonacci Sell
EUR/USD – 30Min
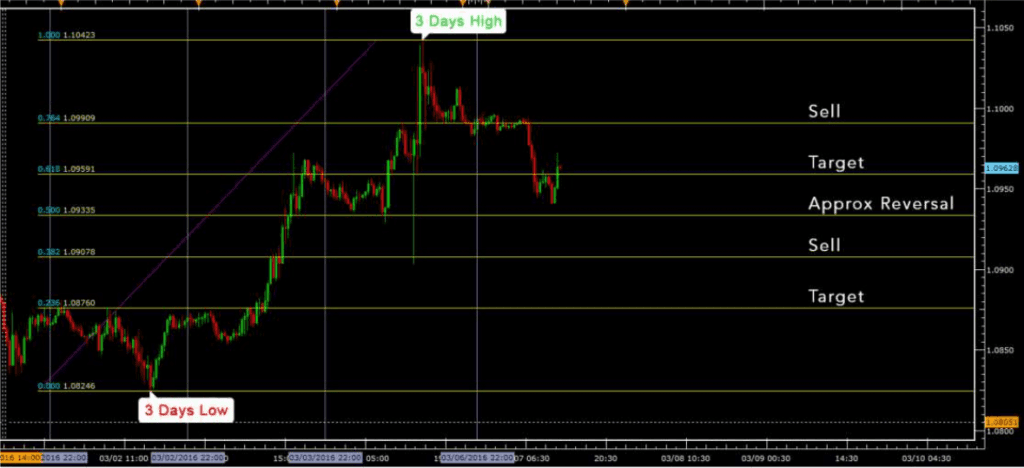
In here the current day’s market opening is at 1.09871. You can right away initiate a sell trade at this point and can set your target at 1.09591. The value goes across your target, but before touching the resistance itself, it gets reversed. These Situations may be confusable for you. But if you make use of SAM’S TREND BLASTER one of the most powerful indicators available on the market, you can make clear trades in this, which is explained later.
Three Days Fibonacci No Trade
GBP/JPY – 30Min
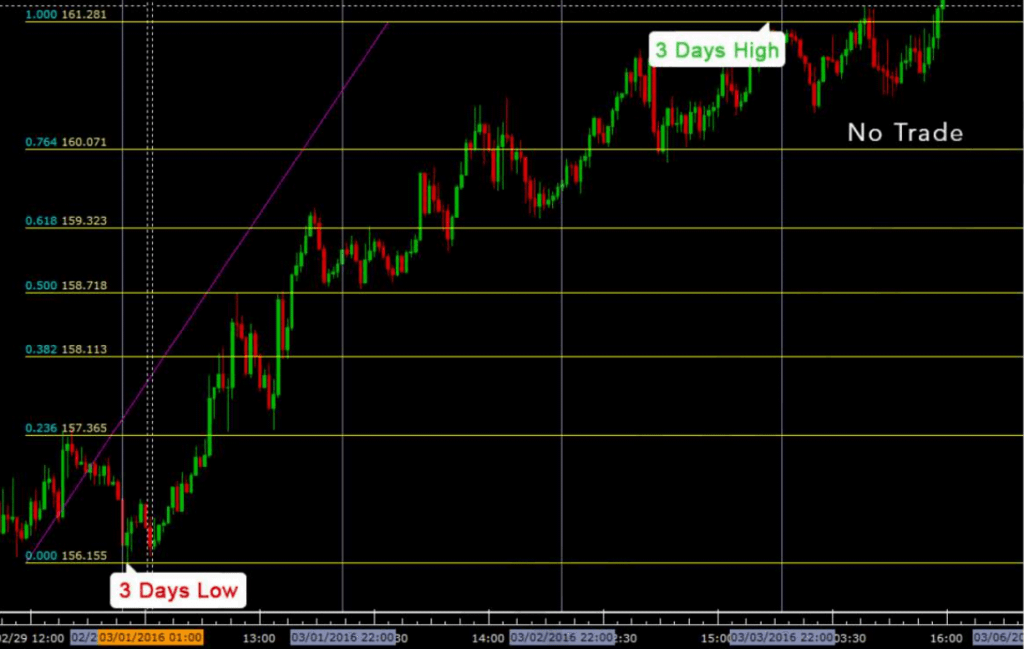
In here the market open at 161.119, but it does not even touch the line at
160.071 and it gets reversed in the middle and reaches the starting point and goes beyond it and then again it gets reversed. This market movement is much unstable, hence it’s best advised not to trade.
SAM’S TREND BLASTER INDICATOR AND THREE DAYS AVERAGE FIBONACCI
Sam’s Trend Blaster is one of the best yet solid indicators that are available on the market for MT4. Watch below what it does on a real-time trade working alongside of Three days average Fibonacci strategy.
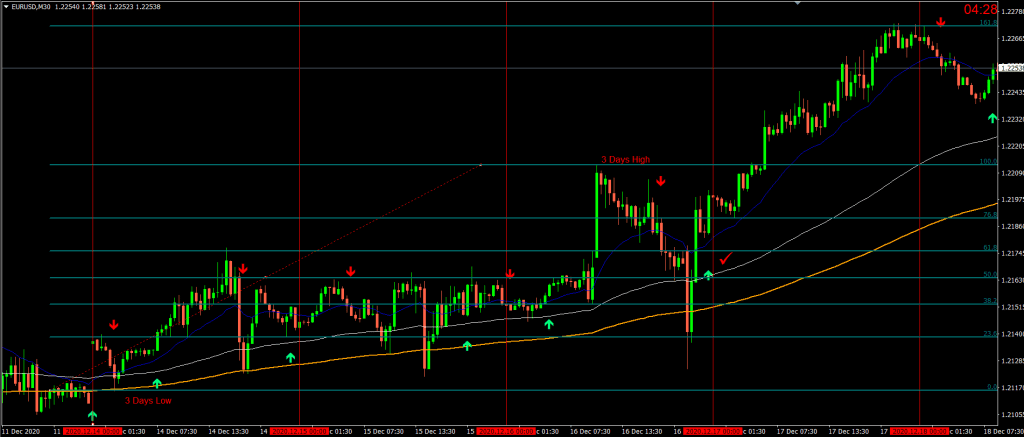
••• In here you can clearly see that the market opens at somewhere near the 0.764 Fibonacci lines and the Sam’s Trend Blaster indicates a solid Buy signal once it starts moving Upward.
•• Set your targets
••• Then the market moves upward and the Sam’s Trend Blaster starts indicating a solid Sell signal at near 161.8 Fibonacci lines with the market reversing down.
Read More : Fibonacci Golden Zone Indicator – [Cost $99]- For FREE
Download a Collection of Indicators, Courses, and EA for FREE


Sir plz upload sam trend blaster
Please crack
https://www.mql5.com/en/market/product/56062
I have made an EA based on these rules. It does not seem good, even terible when backtesting this year. I need to add some trailing stop, maybe even to hedge opened positions. I will post my EA when I finish it with all posibilities to secure an opened trade. But for now, I do not recomment using this strategy manually.
Hey Danilo, I also thought about doing that. Are you finished with it and can you share it to let me test?
Greetings Marius,
Here is the MQL5 code of my EA : https://github.com/DaniloS99/DS-Fibonacci-Trader-EA/blob/main/DS%20Fibonacci%20Trader%20EA%20v1.0.mq5
I didn’t have time to work on it due to these holidays, but you can try to customize it if you are familiar with MQL5.
Thanks for this strategy. It works great for me
Only right ZZ can help to work with Fibo correctly. Nor one day HLs, nor even three days.
Hello Great People!
Please upload this (X TREND PREMIUM SYSTEM SOFTWARE) It would be highly appreciated, sir.
Thanks for the work of sharing benefitting tools with your numerous readers.