

Getting Started
This is a widely used RSI Divergence strategy for many successful traders and is well known for its success in predicting the market’s movement. This strategy is very versatile in which the time frames can be used effectively on. I’ve had personal success using it on as low as the 5 minute time frame and as high as the daily time frame. Better yet, this strategy only consists of 1 indicator:
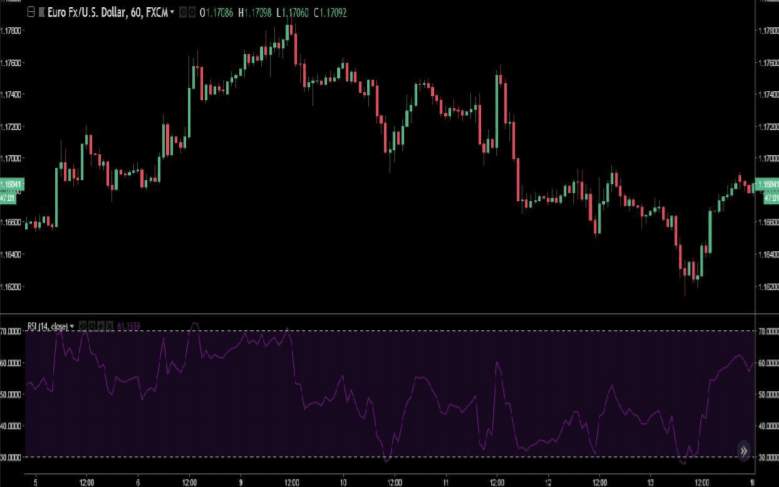
A 14 Period closed Relative Strength Index (RSI) 70/30 Levels
Refer to the Picture Below to see what your RSI should look like
How to Trade
Finding viable setups may be hard when first learning this strategy, but once mastered, you will be able to spot setups with ease. The main goal of this strategy is spotting and trading what is called “Divergence.” What is Divergence? Simply put, Divergence is when the RSI indicator does not accurately follow the movement of price and lets us know as traders that something is changing.
Here is an example of what we call Bullish Divergence
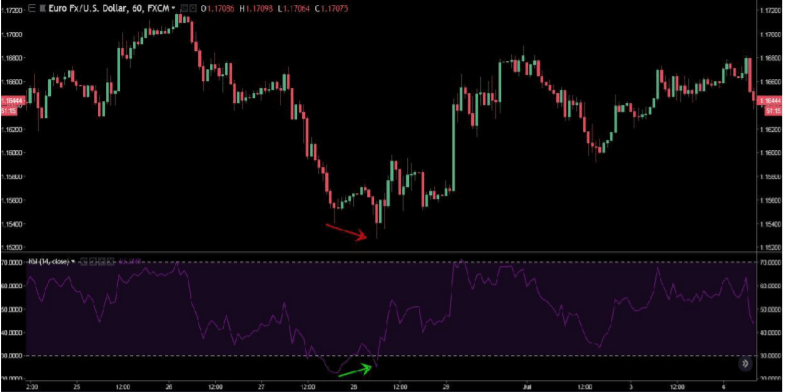
Notice how the price is trending downwards on our chart creating a Lower Low (as shown by the red arrow), but our RSI indicator is showing a Higher Low (as shown by the green arrow). This lets us know as traders, that there is likely going to be a change of trend in the market. Knowing this, we could take a BUY at the
Higher Low (shown by the green arrow) OR wait until price begins to retrace upwards.
Here is an example of what we call Bearish Divergence
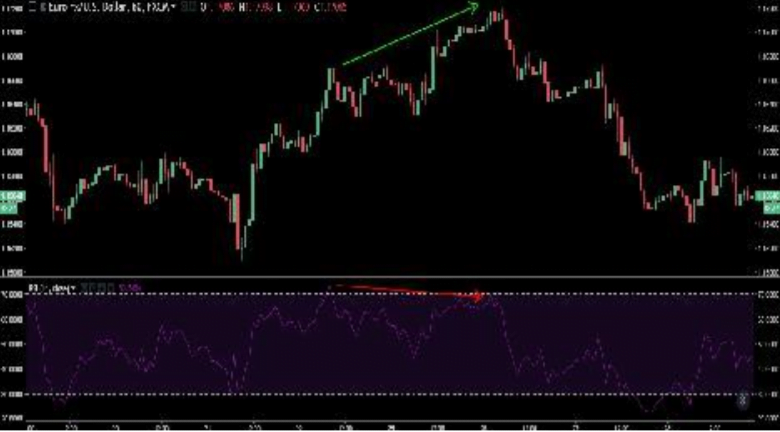
Notice how the price is trending upwards on our chart creating a Higher High (as shown by the green arrow), but our RSI indicator is showing a Lower High (as shown by the red arrow). This again, lets us know as traders, that there is likely going to be a change of trend in the market. Knowing this, we could take a SELL at the Lower High (shown by the red arrow) OR wait until price begins to retrace downwards.
This is Only a basic Guide, I Will Come to You guys Soon with more detailed Strategy with very good accuracy.
Read Why Forex Trading Psychology Really Matters : Visit
I wish to get PWR. How can I get it
PWR ?
Pls admin, thank you for your good job. Pls upload kiss 2.0 indicator. It works fine on mt5 and good for volatility index
still testing
ForexCracked.comKISS 2.0
admin can you get alligatorEA I do need it please upload it
hi admin can you add angelic strategy robot from young a mo 98% accuracy please
Hi, admin
Can you add this trading tools?
https://www.mql5.com/en/market/product/30750