
In the intricate world of forex trading, recognizing overbought and oversold market conditions is essential for making informed decisions. The BBR RSI Oversold Overbought Forex Indicator is a custom indicator meticulously designed to address this need. Combining the power of Bollinger Bands and the Relative Strength Index (RSI), the BBR RSI Indicator for MT4 offers traders a precise tool for identifying critical market extremes.
Understanding the BBR RSI Oversold Overbought Indicator
The BBR RSI is a unique indicator that fuses the distinctive features of Bollinger Bands and the Relative Strength Index. Bollinger Bands are renowned for indicating volatility and potential reversal points, while the RSI is a momentum oscillator that helps assess whether an asset is overvalued or undervalued. By integrating these two indicators, the BBR RSI provides traders with a comprehensive view of overbought and oversold conditions in the market.
Indicator Signals
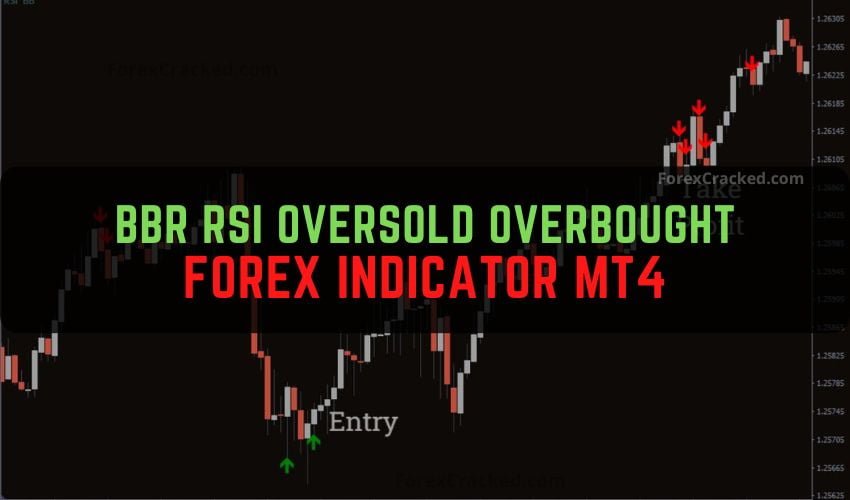
- Red Arrow (Overbought):
- When the price hits the upper band of the BBR and simultaneously ventures into the overbought region of the RSI, the indicator signals this condition by displaying a red arrow on the chart.
- Green Arrow (Oversold):
- Conversely, if the price reaches the lower band of the BBR and enters the oversold region of the RSI, the BBR RSI Indicator responds with a green arrow.
How to Use the BBR RSI Oversold Overbought Indicator
- Market Momentum Analysis:
- The BBR RSI delivers highly probable buy and sell recommendations by tracking appropriate market momentums. In a specialized setup, the RSI anticipates future price changes by assessing the speed and amplitude of current price swings.
- RSI as a Predictor:
- The Relative Strength Index, a pivotal BBR RSI component, is a powerful predictor of market conditions. It helps identify overvalued or undervalued assets, indicating potential corrections or shifts in trend direction.
- Red Arrow for Overbought Conditions:
- A red arrow on the chart signals an overbought market. Traders may interpret this as an opportune moment to enter a short position, anticipating a potential correction or reversal.

- Green Arrow for Oversold Conditions:
- Conversely, a green arrow indicates an oversold market. Traders can interpret this as a signal to enter a long position, anticipating a potential rebound or reversal in the price.

BBR RSI Oversold Overbought Forex Indicator MT4 Free Download
Read More AI Forex Trading – ChatGPT EA FREE Download
Conclusion
The Bollinger Bands Relative Strength Index (BBR RSI) for MT4 emerges as a powerful ally for traders seeking to navigate the complexities of the forex market. By seamlessly integrating Bollinger Bands and the RSI, this indicator provides clear and actionable signals, marked by red and green arrows on the chart. It equips traders with the insights needed to identify overbought and oversold market conditions, facilitating strategic decision-making and enhancing the potential for profitable trades.