The Currency Strength Dashboard is an advanced trading indicator designed to monitor the entire Forex market, including Gold or one selected index. It is built on the foundation of two powerful indicators: the Best Currency Strength Meter Indicator and the Forex Impulse Detector Indicator. This dashboard provides a detailed overview of currency strength, speed of movement, and trading signals across 28 Forex pairs and nine timeframes.
Key Features of Currency Strength Dashboard
- Comprehensive Market Overview – The Currency Strength dashboard displays currency strength values for all major currency pairs, offering insights into market trends and potential trading opportunities. It allows traders to track currency performance in real-time across all nine timeframes, helping them quickly identify strong and weak currencies.
- Dynamic Market Fibonacci Levels – One of the standout features is the inclusion of dynamic Market Fibonacci Levels, which automatically adjust to current market conditions. This feature, previously proven effective in the Advanced Currency Strength 28 and Advanced Currency Impulse indicators, helps traders make more informed decisions by providing adaptable support and resistance levels.
- Enhanced Visual Indicators -The dashboard uses a color-coded system to represent currency strength across different timeframes. The colors range from strong extreme (darkest color) to weak extreme (lightest color), offering a clear visual representation of the market’s current state. A trend alert is also included, highlighting when three consecutive timeframes align, making it easier to spot consistent trends.
- Quick Chart Access – For convenience, the dashboard includes quick chart buttons that allow traders to open a chart for any pair in a new window simply by clicking on the currency names. Additionally, the dashboard features an automatic update function that keeps all MetaTrader 4 data current across all pairs and timeframes.
- Additional Symbol Support – Beyond the Forex pairs, the dashboard allows traders to add one additional symbol, such as Gold (XAUUSD) or an index like the US30, to monitor alongside the currency pairs. This feature broadens the scope of market analysis, making the dashboard a versatile tool for various trading strategies.
Currency Strength Dashboard isn’t a standalone trading indicator System. Still, it can be very useful for your trading as an additional chart analysis, for finding trade exit positions (TP/SL), and more. While traders of all experience levels can use this system, practicing trading on an MT4 demo account can be beneficial until you become consistent and confident enough to go live. You can open a real or demo trading account with most Forex brokers.
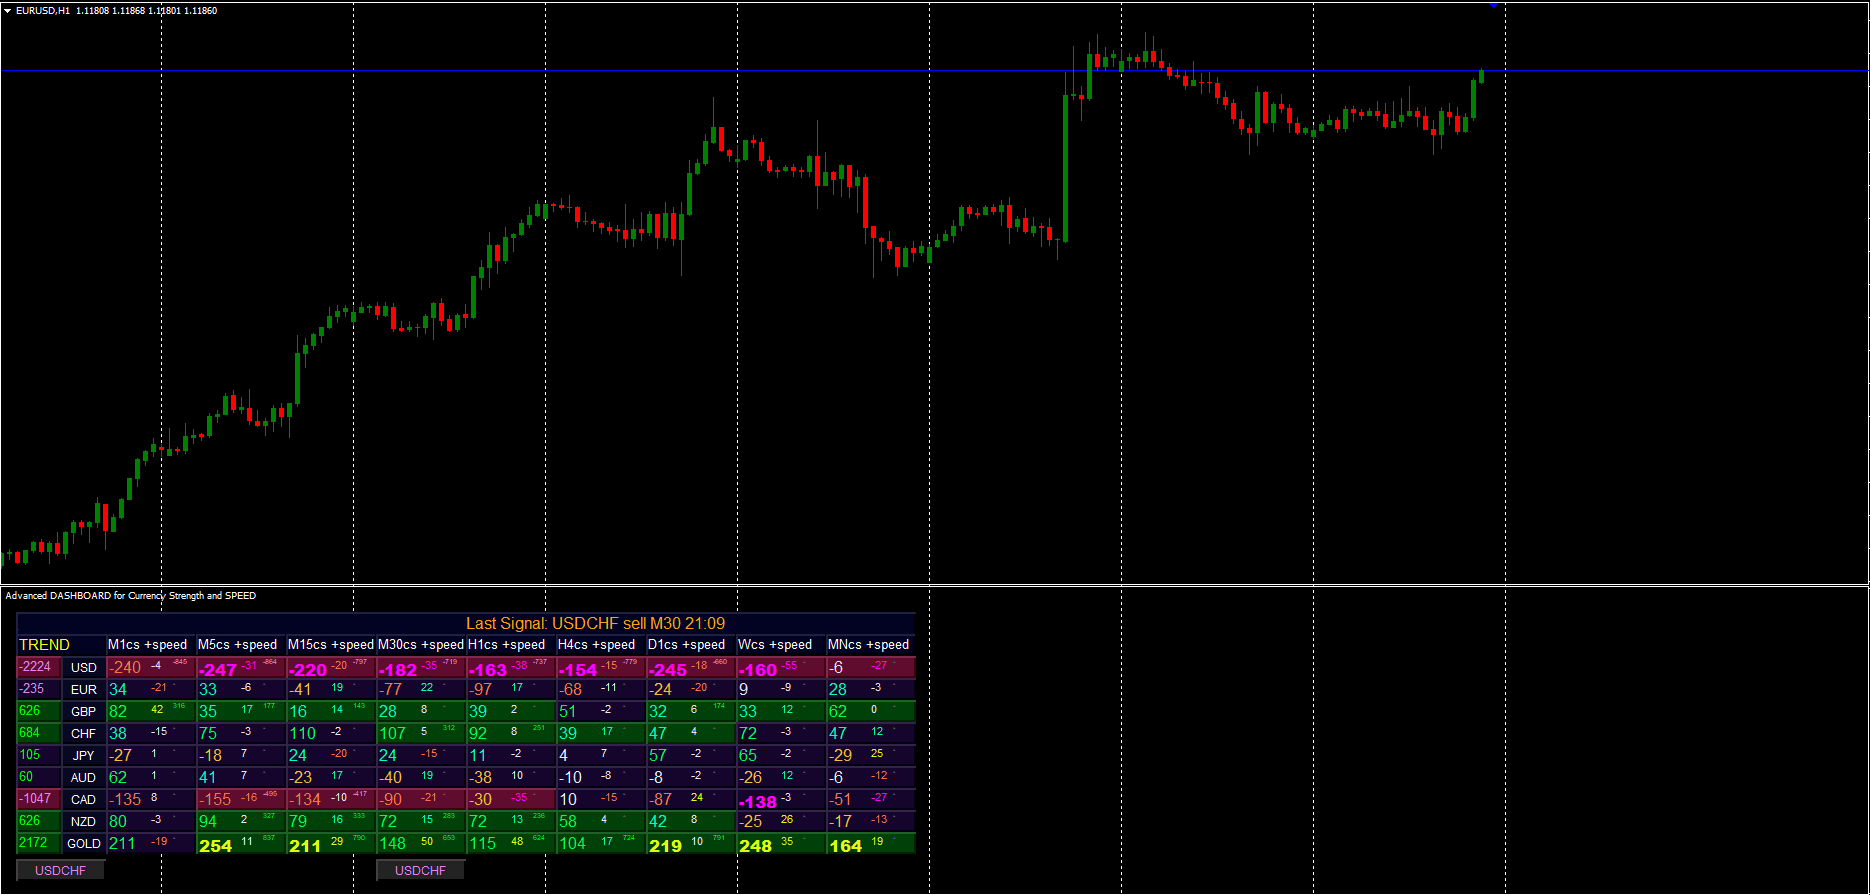

This currency strength dashboard indicator works on all currency pairs and various other assets such as stocks, commodities, cryptocurrencies, precious metals, oil, and gas. It is compatible with all timeframes, making it a versatile tool for traders across different markets.
Download a Collection of Indicators, Courses, and EA for FREE
Detailed Explanation of Dashboard Elements
Column Layout
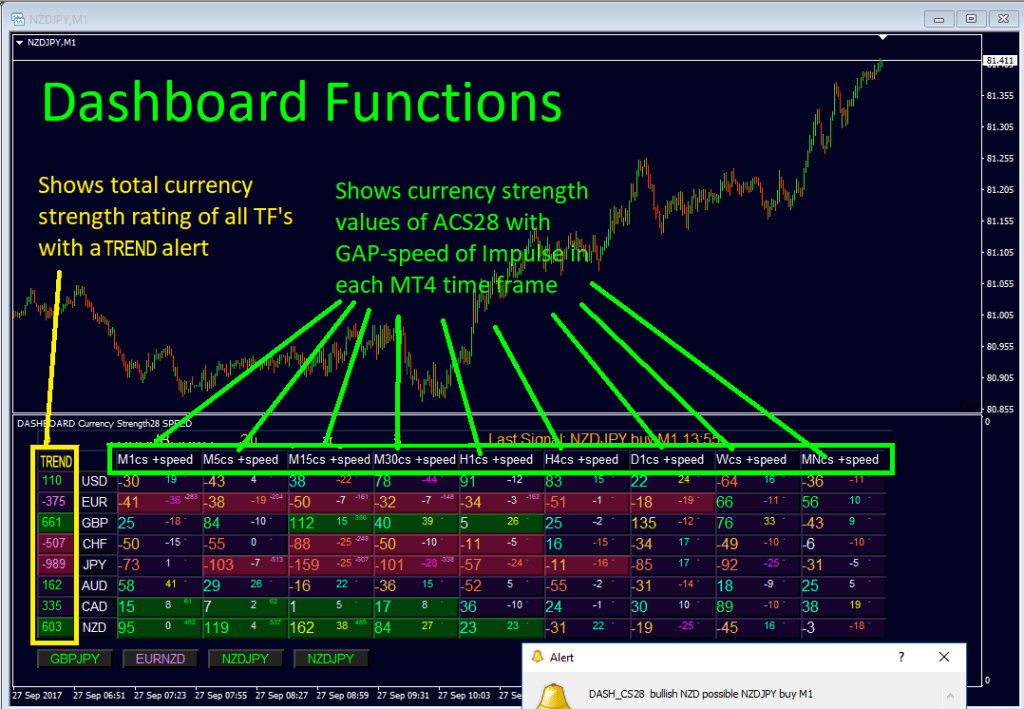
The currency strength dashboard’s columns display data from left to right: Currency-TREND, Currency Names, M1 Currency Strength, and Currency SPEED, followed by the strength and speed data for all other timeframes (M5, M15, M30, H1, H4, D1, W, MN). If a 3-block rating is highlighted, it indicates a significant agreement across timeframes.
Row Analysis
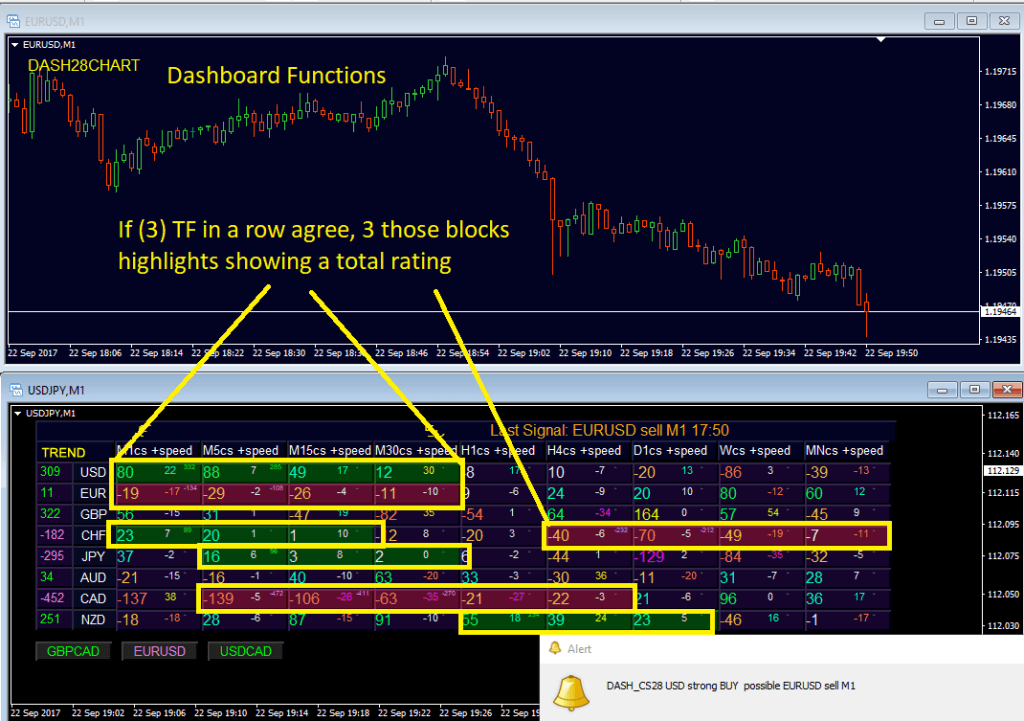
Each row represents a multi-timeframe currency-strength and speed analysis. When three or more blocks in a row agree, the row is highlighted, making it easier to spot consistent trends and potential trading opportunities.
Pattern Recognition
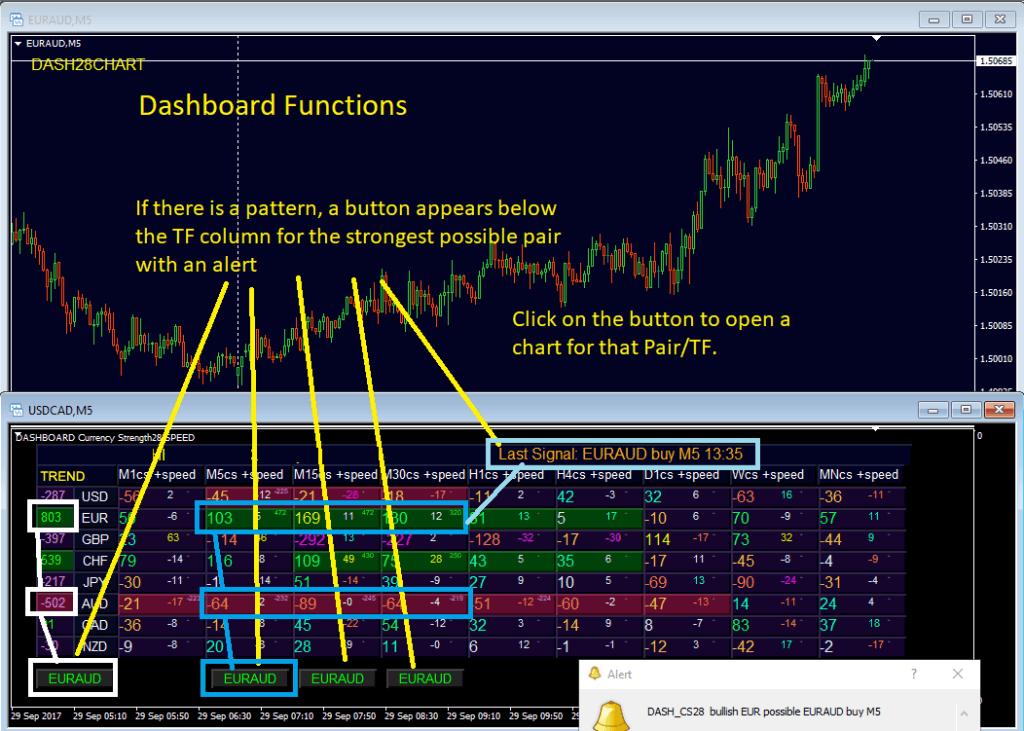
The currency strength dashboard is equipped with pattern recognition, highlighting when three-row blocks of opposite values (green for bulls, red for bears) align. A button will appear below the timeframe column with a suggested pair to trade (green for buy, red for sell). If multiple results exist, the pair with the strongest rating is chosen, triggering an alert. The last alert is also printed in the first row with the time displayed in orange, which can be set to broker or local computer time. Clicking on the button opens the corresponding chart and timeframe.
Color Code and Market Fibonacci Levels
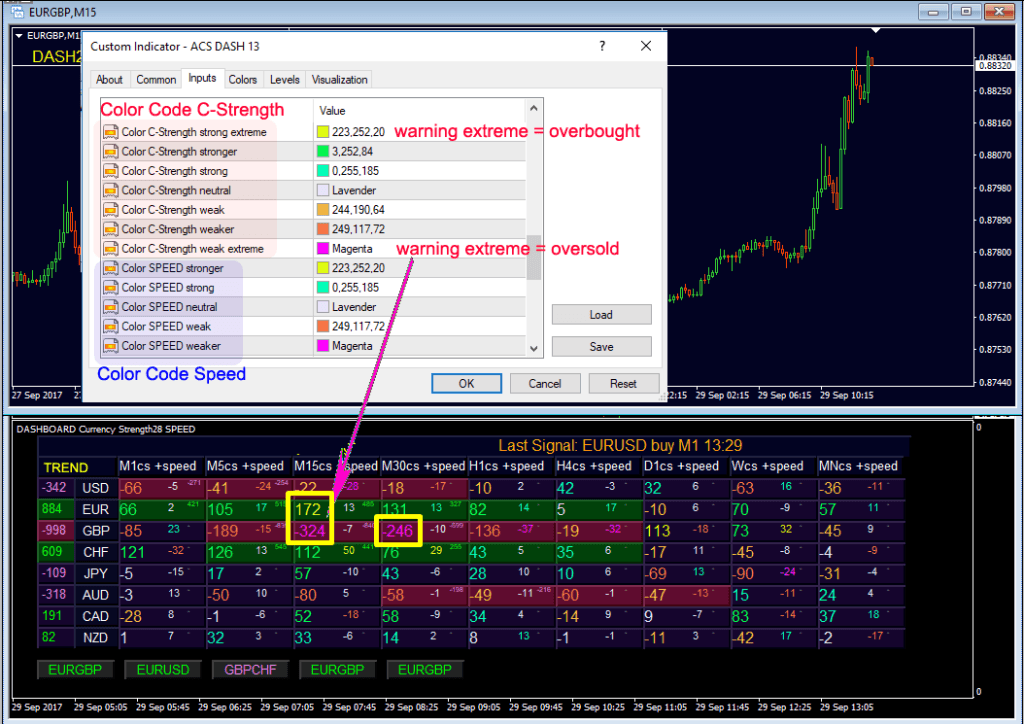
The color code used in the dashboard ranges across seven levels from strong extreme to weak extreme. Traders should pay attention to the extreme levels (yellow and pink), as pullbacks are expected when currency strength levels reach higher than 161/261 or lower than -161/-261 of the dynamic Market Fibonacci levels. These levels, displayed numerically on the currency strength dashboard, are optimized for each timeframe, acknowledging that minute charts are more volatile than daily, weekly, or monthly charts. Scalpers can look for pullback trades when speed inverts the currency strength at these extreme levels, which might also indicate a good time to take profits or trail stop-losses into profit.
- Read More Supply Demand Dashboard FREE Download
Conclusion
The Currency Strength Dashboard is a robust trading tool that comprehensively views the Forex market. Combining currency strength analysis with dynamic Fibonacci levels and easy-to-read visual indicators offers traders a streamlined way to monitor market conditions and identify potential trades. Whether used for trend identification or scalping opportunities, this dashboard enhances the trading experience by delivering real-time insights and facilitating quick decision-making.


Not working anymore
not working
Stopped working please fix.