

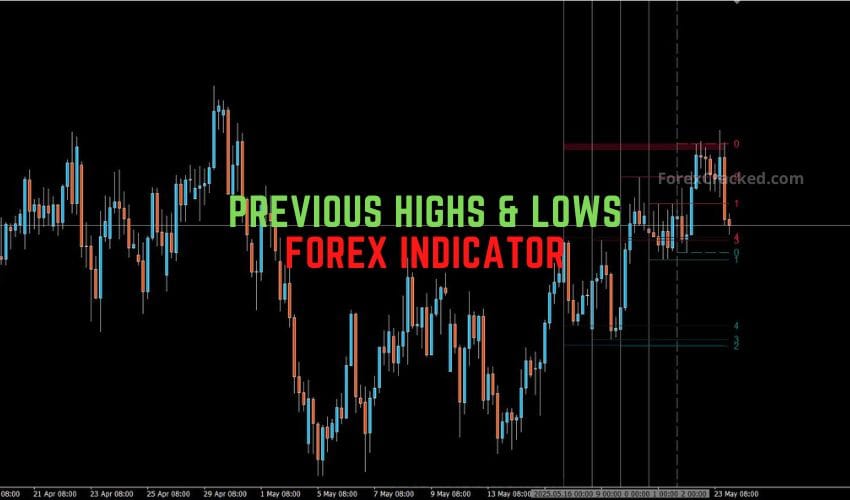
If you’ve been trading for any time, you know how often the price reacts to previous highs and lows. They’re not just arbitrary levels—they’re where big players make decisions. I’ve been using the Previous Highs & Lows Forex Indicator for MT4 as part of my setup for a while now, and I can confidently say it’s one of those “simple but effective” tools that deserve a permanent spot on your chart.
There are no flashing arrows. No repainting gimmicks. Just clean, accurate plotting of historic highs and lows that help you trade smarter, whether you’re chasing breakouts or waiting for reversals.
What Is the Previous Highs & Lows Forex Indicator?
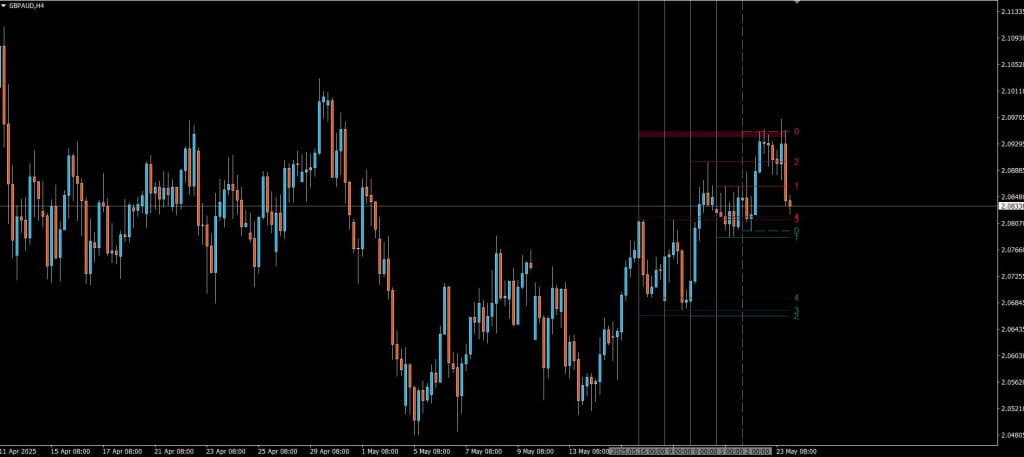
This lightweight MetaTrader 4 indicator does precisely what the name suggests: it automatically plots previous high and low levels from recent price action. Depending on your settings, these levels can come from daily, weekly, or custom periods.
LuxAlgo designs it, and I appreciate how it marks these key zones without overwhelming the chart. It leaves room for your strategy, S&R zones, and trendlines while quietly doing its job in the background.
Why These Levels Matter in Trading
Previous highs and lows are critical decision points in the market. These are the areas where traders historically placed orders—stops, entries, or take profits.
Here’s how I use the indicator:
Resistance Becomes Support (Breakout Strategy)
When the price breaks above a previous high and returns to retest, that high often becomes support. That’s my cue to go long. I wait for a confirming candle, and I’m in—with a stop just below the level.
Rejection from Previous Highs (Reversal Strategy)
If the price approaches a past high and fails to break it—especially with a pin bar or bearish engulfing—I’m looking at a short. The same goes for previous lows during a bullish reversal.
Mean Reversion/Range Strategies
In sideways markets, past highs and lows often mark the top and bottom of the range. When prices bounce between them, I treat them as natural entry and exit zones—especially for scalping or short-term trading.
Download a Collection of Indicators, Courses, and EA for FREE
How to Use It in Your Chart
Once installed, the indicator draws horizontal lines across your chart based on previous highs and lows. The cool part? You don’t have to manually search for these levels anymore. They’re automatically updated as the price evolves.
- Works on all timeframes—from 1 minute to daily.
- Use as a confluence tool alongside moving averages or Fibonacci levels.
- Helps with risk management—you’ll know exactly where to place your stop-loss or take-profit.
Combine With Other Tools for Best Results
Here’s my favorite combo:
- A trend indicator (like a 50 EMA or MACD) confirms overall bias.
- Candlestick patterns (like engulfing, pin bars, inside bars) at the highs/lows.
- This indicator defines key reaction zones.
The result? Cleaner trades. Less second-guessing. Better entries.
Free Download Previous Highs & Lows Forex Indicator
Read More Gold Scalping Pecker EA FREE Download [Update]
Final Thoughts
The Previous Highs & Lows Forex Indicator for MT4 may not be flashy, but it’s reliable. It brings structure and logic to your trading decisions. Whether you’re a breakout trader, trend follower, or mean reversion scalper, knowing where the price has reacted in the past gives you a significant edge.
I’ve found filtering out bad trades and planning sniper entries helpful. It’s free, easy to use, and works well with nearly any strategy you already have.
This indicator is a no-brainer if you’re serious about trading clean charts with solid data. Try it, test it, and you’ll likely keep it on your charts long-term, just like I did.
Key Benefits
- Automatically plots previous high and low price zones
- Great for breakout, pullback, and mean-reversion strategies
- Minimal chart clutter
- Ideal for new and experienced traders alike
- Compatible with other technical indicators and strategies