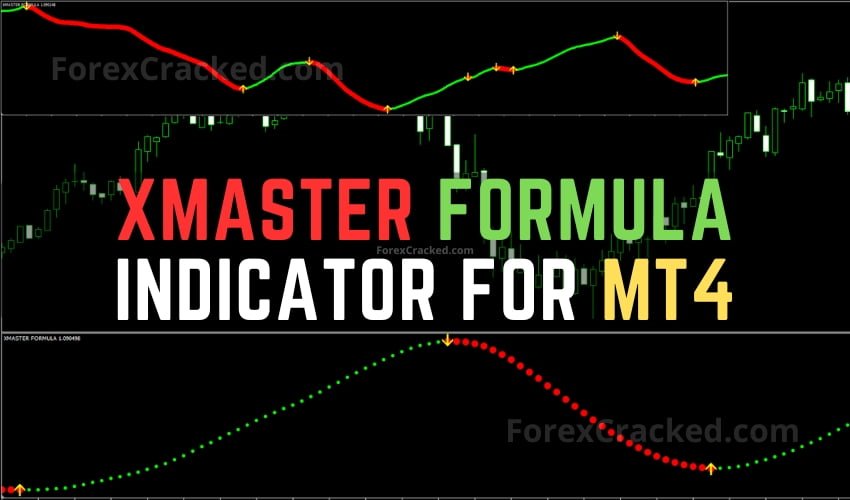

The Xmaster Formula Indicator (also known as the XHMaster Formula Indicator) is a multi-confluence trend reversal system that combines EMA, MACD, RSI, Stochastic Oscillator, and Parabolic SAR into a single clean oscillator with clear BUY/SELL signals. Available for MT4, MT5, and TradingView — completely free. This is the most comprehensive Xmaster Formula guide online, covering how it works, best settings, trading strategies, and step-by-step installation.
Table of Contents
What Is the Xmaster Formula Indicator?
The Xmaster Formula Indicator is a custom forex technical analysis tool originally developed for MetaTrader 4 in the late 2010s. It is designed to identify potential trend reversals in the forex market by analyzing multiple price patterns simultaneously. Unlike single-indicator systems, the Xmaster Formula combines five proven technical indicators — Exponential Moving Averages (EMA), MACD, RSI, Stochastic Oscillator, and Parabolic SAR — into one unified oscillator displayed in a separate chart pane.
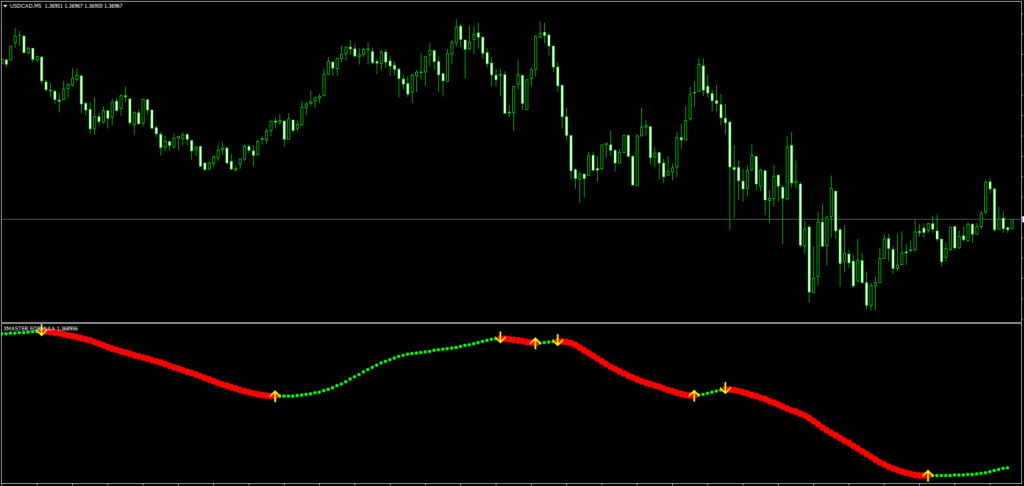
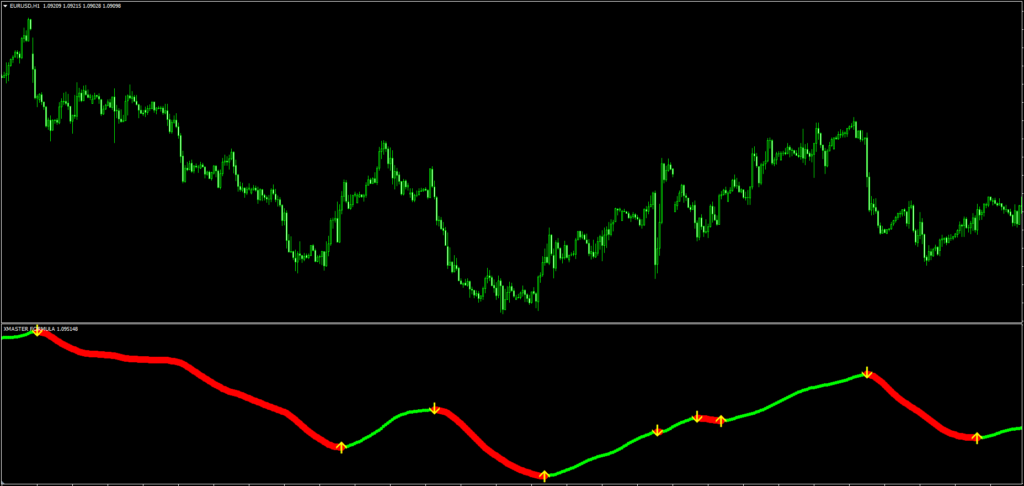
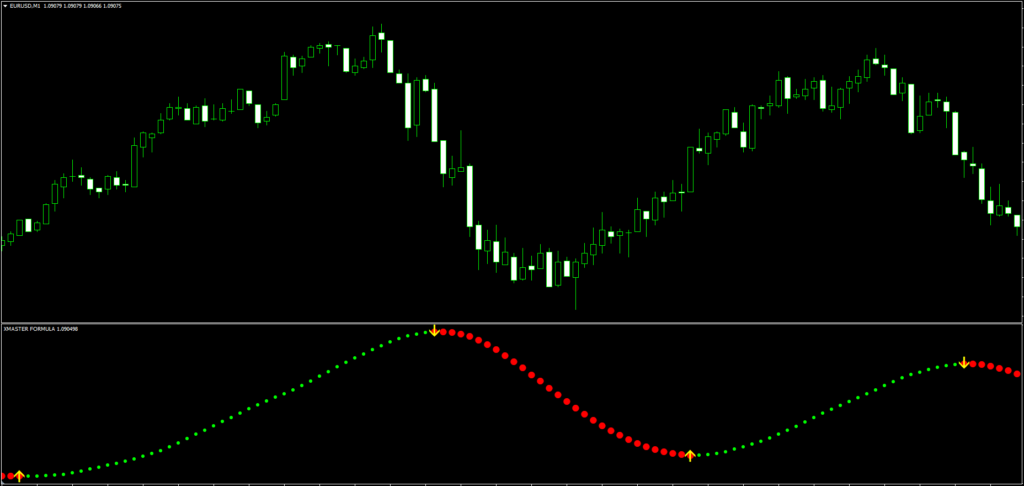
The output is intentionally simplified: traders see clear BUY or SELL arrow signals and colored dots that indicate BULLISH or BEARISH trend direction. This makes it accessible to both beginners learning their first indicator and experienced traders looking for a confluence confirmation tool.
Note: The Xmaster Formula Indicator is also widely known as the “XHMaster Formula Indicator” or “XHmaster Formula Indicator.” All three names — Xmaster, XHMaster, and XHmaster — refer to the exact same indicator. We use “Xmaster Formula” throughout this guide, but if you searched for “XHMaster Formula Indicator,” you’re in the right place.
The indicator is now available across three platforms:
TradingView — open-source Pine Script version with enhanced features
MetaTrader 4 (MT4) — the original version
MetaTrader 5 (MT5) — adapted for the newer platform
History of the Xmaster (XHMaster) Formula Indicator
The Xmaster Formula Indicator has evolved significantly since its original release. Here’s a timeline of its development:
Early 2010s — Origin: The Xmaster Formula was first developed as a custom MT4 indicator by independent forex developers. It gained a cult following on trading forums like ForexFactory and Forex-TSD for combining multiple indicators into a single, clean visual output. At this stage, it was a simple EMA-based oscillator with basic color-coded signals.
2018–2019 — Growing Popularity: As forex forums shared the indicator widely, it became one of the most downloaded custom indicators on MT4. The alternate spelling “XHMaster” started appearing during this period, likely due to search engine autocomplete variations. Both names stuck.
2020–2021 — Advanced Mode Added: Developers enhanced the indicator by adding the Advanced (Hybrid) Mode, which integrated RSI, MACD, Stochastic, and Parabolic SAR as confluence filters. This dramatically reduced false signals compared to the original Standard Mode.
2022–2023 — MT5 Expansion: The Xmaster Formula was ported to MetaTrader 5, taking advantage of the newer platform’s faster processing capabilities. Adjustable sensitivity settings were also introduced, allowing traders to customize the indicator for scalping, day trading, or swing trading.
2024–2026 — TradingView Launch & Non-Repaint Guarantee: ForexCracked published an open-source Pine Script version on TradingView with a strict non-repaint architecture, built-in alerts, and a real-time info panel. This is the most feature-rich version of the Xmaster Formula available today.
From a simple MT4 script to a multi-platform trading tool, the Xmaster (XHMaster) Formula has remained popular because of one thing: it simplifies complex analysis into clear, actionable signals.
How Does the Xmaster Formula Indicator Work?
The Xmaster Formula Indicator works by combining five classic technical indicators into a single decision engine. Each indicator contributes a specific piece of information about the current market condition, and the Xmaster Formula synthesizes them into one actionable signal. Whether you know it as Xmaster or XHMaster, the underlying logic is identical across all versions.
The 5 Indicators Inside The Xmaster Formula
1. Exponential Moving Average (EMA)
Three EMAs are used — short (10-period), medium (20-period), and long (38-period) — to track price momentum across different time horizons. The difference between the short and long EMA is normalized to create the 0-100 oscillator line that you see on the chart. EMA is preferred over SMA (Simple Moving Averagec-gloss-tip" data-slug="moving-average" tabindex="0">Moving Average) because it gives more weight to recent price data, making it more responsive to current market conditions.
2. MACD (Moving Average Convergence Divergence)
The MACD histogram determines trend strength and direction. When the histogram is positive, it confirms bullish momentum. When negative, bearish momentum. The default settings use a 12-period fast EMA, 26-period slow EMA, and 9-period signal line.
3. RSI (Relative Strength Index)
The RSI identifies overbought and oversold conditions. In the Xmaster Formula, RSI below 30 confirms an oversold condition (potential BUY zone), while RSI above 70 confirms an overbought condition (potential SELL zone). This helps filter out signals that occur in unfavorable market conditions.
4. Stochastic Oscillator
Similar to RSI but calculated differently, the Stochastic Oscillator confirms momentum exhaustion. Readings below 20 signal oversold (BUY potential) and readings above 80 signal overbought (SELL potential). The default period is 14.
5. Parabolic SAR (Stop and Reverse)
The Parabolic SAR identifies trend direction and provides dynamic stop-loss levels. When SAR dots are below the price, the trend is bullish. When above, the trend is bearish. This is the risk management component of the Xmaster Formula, helping traders determine where to place support and resistance based stop-loss orders.
Xmaster Formula Indicator Signal Modes
The Xmaster Formula Indicator offers two distinct signal generation modes, each suited to a different trading style.
Standard Mode
In Standard Mode, the indicator calculates the normalized difference between the short-term EMA (10-period) and long-term EMA (38-period), scaling the result to a 0-100 range.
- BUY Signal: When the normalized value crosses above 55 and the oscillator line turns green
- SELL Signal: When the normalized value drops below 45 and the oscillator line turns red
- Neutral Zone: Values between 45-55 appear orange, indicating a transition period
Best for: Swing traders and position traders who want straightforward trend-following signals with minimal lag.
Advanced Mode (Recommended)
Advanced Mode requires all four confluence indicators (MACD, RSI, Stochastic, and Parabolic SAR) to align before generating a signal. This dramatically reduces false positives compared to Standard Mode.
- BUY Signal: MACD histogram positive + RSI below 30 + Stochastic below 20 + SAR below price
- SELL Signal: MACD histogram negative + RSI above 70 + Stochastic above 80 + SAR above price
A signal triggers only when every indicator agrees simultaneously.
Best for: Day traders and scalpers who need high-probability entries with maximum confirmation before entering a position.


Is the Xmaster (XHMaster) Formula Indicator Non-Repainting?
This is one of the most common questions traders ask about the Xmaster Formula Indicator. The answer depends on the version:
- TradingView version (ForexCracked): ✅ 100% non-repainting. Signals are locked once the bar closes and never change retrospectively.
- MT4/MT5 versions: The indicator is mostly non-repainting on closed candles, but signals on the current (active) candle may change until the candle closes. This is standard behavior for any indicator running on an active candle.
Best practice: Always wait for the candle to close completely before acting on any Xmaster Formula signal. Never enter a trade based on a signal from the current, unfinished candle.
Best Timeframe for Xmaster Formula Indicator
The Xmaster Formula Indicator can be applied to any timeframe from the 1-minute chart to the monthly chart. However, its underlying indicators (MACD, RSI, Stochastic) rely on historical price data, which means higher timeframes produce more reliable signals.
| Timeframe | Signal Reliability | Best Strategy | False Positives |
|---|---|---|---|
| M1 – M15 | ⭐⭐ Low | Scalping (with additional filters) | High |
| M30 – H1 | ⭐⭐⭐ Medium | Day Trading | Moderate |
| H4 – D1 | ⭐⭐⭐⭐ High | Swing Trading | Low |
| W1 – MN | ⭐⭐⭐⭐⭐ Very High | Position Trading | Very Low |
Recommended: Start with H1 or H4 for the best balance between signal frequency and reliability. If you’re a beginner, use the Daily (D1) timeframe where signals are most trustworthy.
Which Markets and Instruments Work Best with the Xmaster (XHMaster) Formula?
The Xmaster Formula Indicator was originally designed for forex trading, but it works across multiple asset classes. Here’s how it performs on each:
Forex (Best Performance)
The Xmaster Formula performs best on major currency pairs like EUR/USD, GBP/USD, USD/JPY, and AUD/USD. These pairs have high liquidity and sustained trends, which is exactly what the indicator’s EMA and MACD components are optimized for. Avoid exotic pairs with low liquidity — the indicator generates more false signals on these.
Gold (XAU/USD)
Gold’s strong trending behavior makes it a good match for the Xmaster Formula, particularly on H4 and D1 timeframes. Many traders combine the Xmaster Formula with Gold EAs for automated gold trading.
Crypto (BTC, ETH)
The Xmaster Formula can be used on crypto, but with caution. Crypto markets are significantly more volatile than forex, which increases false signals on lower timeframes. Use H4 or higher for crypto, and always add a volume confirmation filter.
Stock Indices (US30, NAS100, S&P 500)
The indicator works well on indices during trending market conditions. It’s less reliable during earnings season or news-driven volatility where price whipsaws frequently.
Commodities (Oil, Silver)
Moderate performance. Commodities often exhibit range-bound behavior that can generate false Xmaster signals. Use the Advanced Mode exclusively when trading commodities.
Xmaster (XHMaster) Formula Accuracy — What to Expect
No indicator is 100% accurate, and the Xmaster Formula is no exception. Based on real-world testing across multiple currency pairs, here’s what traders can realistically expect:
- Hit rate: Approximately 6 out of 9 signals are accurate (67% win rate)
- False positives: Roughly 3 out of 9 signals will be incorrect
- Best performance: Major currency pairs on H4 and D1 timeframes
- Worst performance: Choppy, range-bound markets on lower timeframes
The Xmaster Formula Indicator should never be used as a standalone trading system. It performs best as a confluence confirmation tool — use it to validate signals from your primary trading strategy, not as your only source of trade entries.
How to Use the Xmaster Formula Indicator — Trading Strategy
Step 1: Identify the Trend Direction
Look at the Xmaster Formula oscillator:
- Green line above 55 = Bullish trend active
- Red line below 45 = Bearish trend active
- Orange line between 45-55 = Transition zone (avoid trading)
Step 2: Wait for Signal Confirmation
In Advanced Mode, wait for all four indicators to align:
- For BUY: MACD positive + RSI oversold + Stochastic oversold + SAR bullish
- For SELL: MACD negative + RSI overbought + Stochastic overbought + SAR bearish
Step 3: Confirm with Support and Resistance
Before entering any trade, check the nearest support and resistance levels. If a BUY signal appears too close to a strong resistance level, consider waiting or setting a tighter take-profit.
Step 4: Set Stop-Loss Using Parabolic SAR
The Parabolic SAR dots provide a natural stop-loss level. Place your stop-loss just beyond the most recent SAR dot.
Step 5: Manage the Trade
Exit when:
- The oscillator line changes color (green to red for BUY trades, red to green for SELL trades)
- An opposite signal appears
- The oscillator crosses the 50 midline against your position
Best Indicators to Combine with the Xmaster Formula
While the Xmaster Formula already combines five indicators internally, pairing it with additional tools can significantly reduce false positives and improve accuracy.
1. Ichimoku Cloud
The Ichimoku Cloud helps filter Xmaster Formula signals by providing dynamic support/resistance levels:
- If Xmaster gives a BUY signal but price is below the Kumo cloud → potential false positive
- If Xmaster gives a BUY signal and price is above the Kumo cloud → strong confirmation
2. Market Structure Break (MSB) / BOS & CHoCH
Market Structure Break indicators confirm whether the trend truly reversed at the structural level:
- Xmaster BUY signal + bullish BOS = highest probability entry
- Xmaster BUY signal without structural break = lower confidence
3. 50/200 EMA Filter
Add a 50-period or 200-period EMA to the main chart:
- Only take BUY signals when price is above the 200 EMA
- Only take SELL signals when price is below the 200 EMA
4. Volume or Tick Volume
Confirm Xmaster Formula signals with volume spikes — high volume on signal candles adds confidence. For traders who want to explore Smart Money concepts alongside the Xmaster Formula, combining SMC order blocks with Xmaster signals can further enhance accuracy.
How to Backtest the Xmaster (XHMaster) Formula Indicator
Before risking real money, every trader should backtest the Xmaster Formula on historical data. Here’s a step-by-step approach:
Step 1: Define Your Rules
Before backtesting, write down fixed rules:
- Entry: Enter on the candle close after a confirmed Xmaster signal (not during the signal candle)
- Stop-Loss: Place at the nearest swing high/low or use 1.5× ATR
- Take-Profit: Minimum 1:2 risk-reward ratio, or exit at the opposite Xmaster signal
- Filter: Only take signals when price is above/below the 200 EMA (trend direction)
Step 2: Manual Backtesting (MT4/MT5)
Open the Strategy Tester in MT4/MT5 or simply scroll back through historical charts. For each Xmaster signal, record in a spreadsheet:
- Date and time
- Signal type (BUY or SELL)
- Entry price
- Stop-loss price
- Take-profit price
- Result (Win/Loss/Breakeven)
Step 3: Automated Backtesting (TradingView)
If you’re using the ForexCracked TradingView version, you can modify the Pine Script to add strategy() functions for automated backtesting. This gives you instant results across years of data.
Step 4: Analyze Key Metrics
After at least 50–100 trades in your backtest, evaluate:
- Win rate: Should be above 55%
- Profit factor: Should be above 1.5
- Maximum drawdownass="fc-gloss-tip" data-slug="drawdown" tabindex="0">drawdown: Check your risk tolerance with the Drawdown Calculator
- Average R:R ratio: Should be at least 1:1.5
If the results don’t meet these benchmarks, adjust your settings (EMA periods, RSI thresholds) and re-test. Never go live with a strategy you haven’t backtested.
Xmaster Formula Indicator Settings (MT4/MT5)
Moving Average Settings
| Parameter | Default | Description |
|---|---|---|
| Short EMA Length | 10 | Short-term momentum |
| Mid EMA Length | 20 | Medium-term trend |
| Long EMA Length | 38 | Long-term trend direction |
MACD Settings
| Parameter | Default | Description |
|---|---|---|
| Fast Length | 12 | Fast EMA for MACD |
| Slow Length | 26 | Slow EMA for MACD |
| Signal Length | 9 | MACD signal line |
Stochastic Settings
| Parameter | Default | Description |
|---|---|---|
| Length | 14 | Stochastic calculation period |
| Overbought | 80 | Sell zone threshold |
| Oversold | 20 | Buy zone threshold |
RSI Settings
| Parameter | Default | Description |
|---|---|---|
| Length | 14 | RSI calculation period |
| Overbought | 70 | Sell zone threshold |
| Oversold | 30 | Buy zone threshold |
Xmaster Formula for TradingView [NEW — 2026]
We’ve published an enhanced version of the Xmaster Formula Indicator for TradingView with features not available in the original MT4/MT5 version:
🔗 Xmaster Formula Indicator on TradingView — ForexCracked
TradingView Version Exclusive Features:
- ✅ Built-in Alert System — Set BUY, SELL, or Any Signal alerts with popup, email, webhook, and mobile push notifications
- ✅ Live Info Panel — Real-time dashboard showing current mode, MACD trend, RSI value, and signal status
- ✅ Customizable Colors — Change bullish, bearish, and neutral colors
- ✅ Adjustable Thresholds — Configure RSI and Stochastic overbought/oversold levels directly from settings
- ✅ 100% Non-Repainting — Signals locked on bar close
- ✅ Rolling Normalization — 200-bar rolling window for more stable oscillator readings (vs. all-time normalization in the MT4 version)
- ✅ Open Source — Full Pine Script code visible for review
How to Install Xmaster Formula Indicator on MT4/MT5
MT4 Installation — Step by Step:
- Download the Xmaster Formula indicator file (.ex4) from the download link below
- Open MetaTrader 4
- Go to File → Open Data Folder
- Navigate to MQL4 → Indicators
- Copy the downloaded .ex4 file into this folder
- Restart MetaTrader 4 (or right-click on Navigator → Refresh)
- Find “Xmaster Formula” under Navigator → Indicators
- Drag it onto any chart
MT5 Installation:
Follow the same process but use the MQL5 → Indicators folder instead. For a complete step-by-step guide with screenshots, see our MT4/MT5 Installation Guide.
TradingView Installation:
- Visit the Xmaster Formula on TradingView
- Click the ★ Add to Favorites button
- Open any TradingView chart
- Click Indicators → Favorites → Select “Xmaster Formula Indicator [ForexCracked]”
Xmaster Formula Indicator — Pros and Cons
✓ Pros
- Combines 5 proven indicators into one clean output
- Clear BUY/SELL signal arrows — easy to read
- Two modes: Standard for speed, Advanced for accuracy
- Works on all assets: Forex, Crypto, Stocks, Indices, Commodities
- Free and available on MT4, MT5, and TradingView
- Customizable alert system on TradingView version
- Non-repainting on closed candles
✗ Cons
- Can generate false positives, especially on lower timeframes
- Should not be used as a standalone trading system
- Less effective in choppy, sideways markets
- Signal repainting possible on the current (active) candle in MT4/MT5
- Relies on historical data — struggles with newly listed instruments
Xmaster Formula Indicator vs Other Indicators
| Feature | Xmaster Formula | Lucky Reversal | Buy Sell Magic | MACD Alone |
|---|---|---|---|---|
| Indicators Combined | 5 (EMA, MACD, RSI, Stoch, SAR) | 2 | 3 | 1 |
| Signal Type | Arrow + Oscillator | Arrow | Arrow | Histogram |
| Non-Repainting | ✅ (on closed candles) | ✅ | ⚠️ Partial | ✅ |
| Built-in Risk Management | ✅ (SAR) | ❌ | ❌ | ❌ |
| TradingView Version | ✅ | ❌ | ❌ | ✅ (built-in) |
| Confluence Level | Very High | Low | Medium | None |
Important Recommendations
- Minimum account balance: $500 or use a demo account — model your growth with the Compounding Calculator
- Recommended broker: Use a broker with tight spreads — Find the Best Forex Broker For You
- Start with demo: Test the Xmaster Formula on a demo account for at least 2 weeks before going live
- Recommended timeframe: H1 or H4 for the best signal reliability
- Risk management: Never risk more than 1-2% of your account on a single trade — check your tolerance with the Drawdown Calculator
- Combine with other tools: Use support/resistance levels, trend lines, or the 200 EMA for confirmation
Please test in a demo account first for at least a week. Also, make yourself familiar and understand how this indicator works before using it on a real account.
Download Xmaster Formula Indicator
- MT5 : Xmaster Formula MT5 Indicator FREE Download
- TradingView: Open on TradingView
- Browse all indicators: Full Indicator Collection
- Read More Xmaster Formula and Silver Trend Signal MT5 Forex Trading Strategy
Frequently Asked Questions
Conclusion
The Xmaster Formula Indicator remains one of the most reliable multi-confluence trend reversal tools available for forex trading in 2026. By combining five proven technical indicators — EMA, MACD, RSI, Stochastic, and Parabolic SAR — into a single clean oscillator, it eliminates the clutter of running multiple indicator windows while delivering actionable BUY and SELL signals.
The Advanced Mode, which requires all four sub-indicators to align before triggering a signal, provides a level of confirmation that most standalone indicators simply cannot match. Combined with proper risk management, appropriate timeframe selection (H4 or D1 recommended), and a confirmation tool like Ichimoku Cloud or Market Structure Break indicators, the Xmaster Formula is a powerful addition to any forex trader’s toolkit.
With our 2026 update, traders now have access to the Xmaster Formula on all three major platforms — MT4, MT5, and TradingView — completely free, with no subscription, no license keys, and no hidden fees. For more professional trading tools, explore our Premium Indicator Collection or browse all available Forex Expert Advisors.
Always test on a demo account first. No indicator, no matter how sophisticated, can guarantee profits in the forex market. The Xmaster Formula is a tool, not a crystal ball.
Whether you found this guide by searching for “Xmaster Formula” or “XHMaster Formula Indicator,” we hope this has been the most complete resource available.
Anyone Can Tell Me How Can Download This Indicator OR Just Me Download Linl
My friend you should not trade at all if you cannot find the free download bottom above
My co-worker Matthew has one of these. He says it looks gigantic.