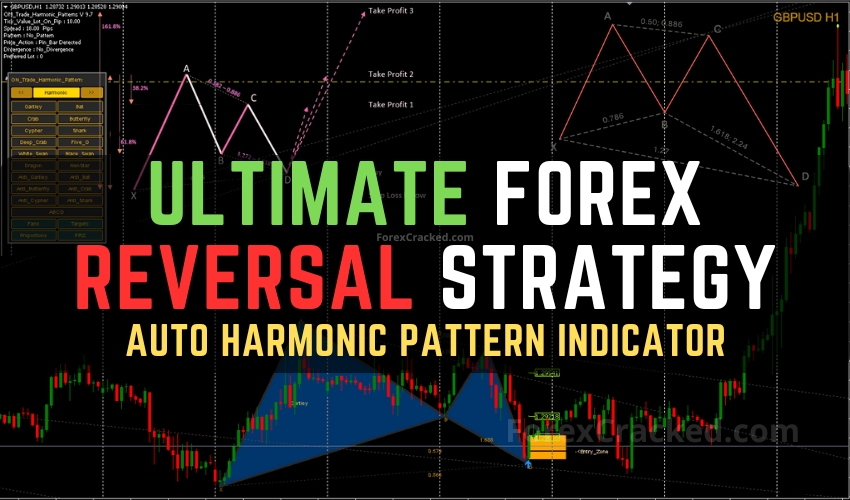

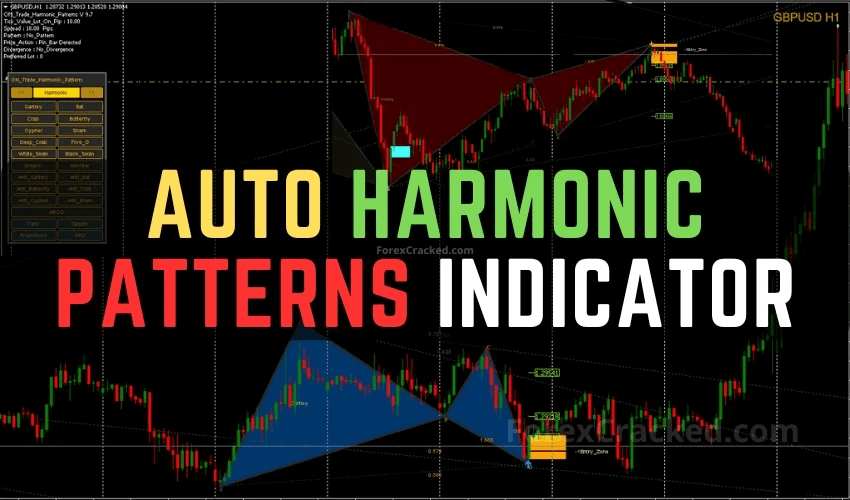
Most traders rely on basic indicators or gut instinct but harmonic pattern trading offers a repeatable, math based edge. The Auto Harmonic Patterns Indicator removes guesswork by scanning charts in real time for high probability reversal setups like the Gartley, Bat, Crab, Butterfly, Cypher, and Shark, and highlighting precise entry zones, stop-loss levels, and take-profit targets.
But the tool alone isn’t enough. To trade it effectively, you need a rule based strategy grounded in harmonic theory, price action, and smart risk management.
In this guide, you’ll learn how to build a complete forex reversal strategy using the Auto Harmonic Patterns Indicator covering entries, sizing, exits, backtesting, automation, and key optimizations.
Table of Contents
What Makes Harmonic Patterns Special?
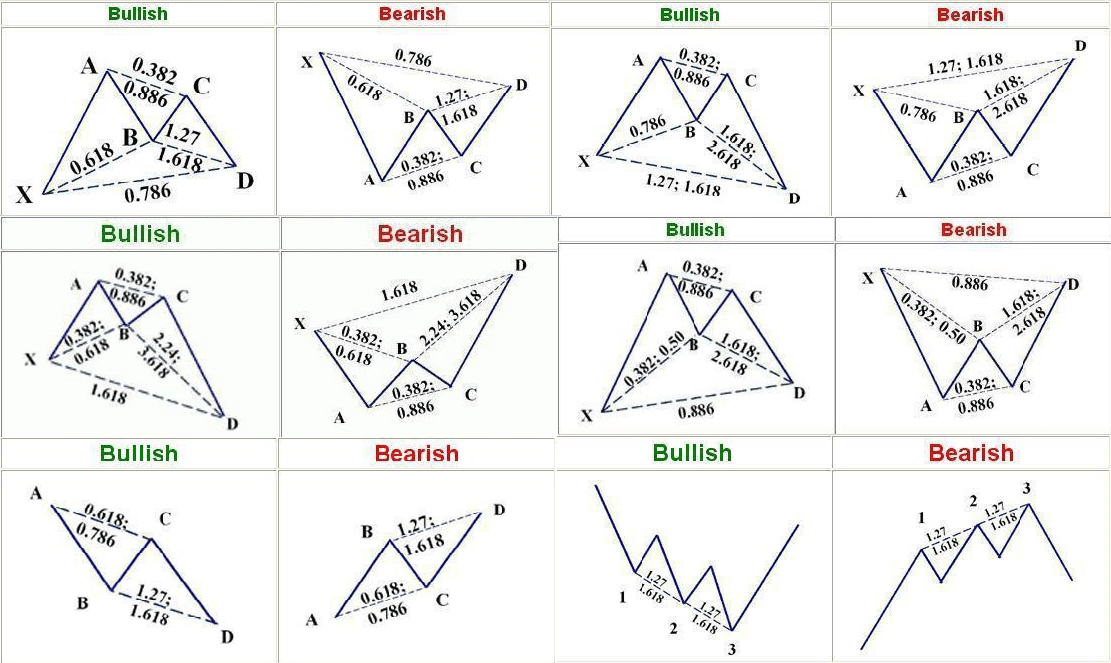
Harmonic trading traces its roots to H.M. Gartley’s 1935 classic Profits in the Stock Market, where he sketched an “M and W”‐shaped, five point pattern designed to catch the end of corrective waves. The geometry caught on, but it was not until decades later that Larry Pesavento super-imposed precise Fibonacci retracements and extensions 0.618, 0.786, 1.27, 1.618, and cousins turning Gartley’s sketch into a rule-based template.
In the early 2000s Scott Carney expanded the catalogue with the Bat (0.886 retrace), Butterfly (1.27 extension), Crab (1.618 extension), Cypher and Shark, all sharing the same XA-AB-BC-CD backbone but each demanding its own set of “must-hit” ratios.
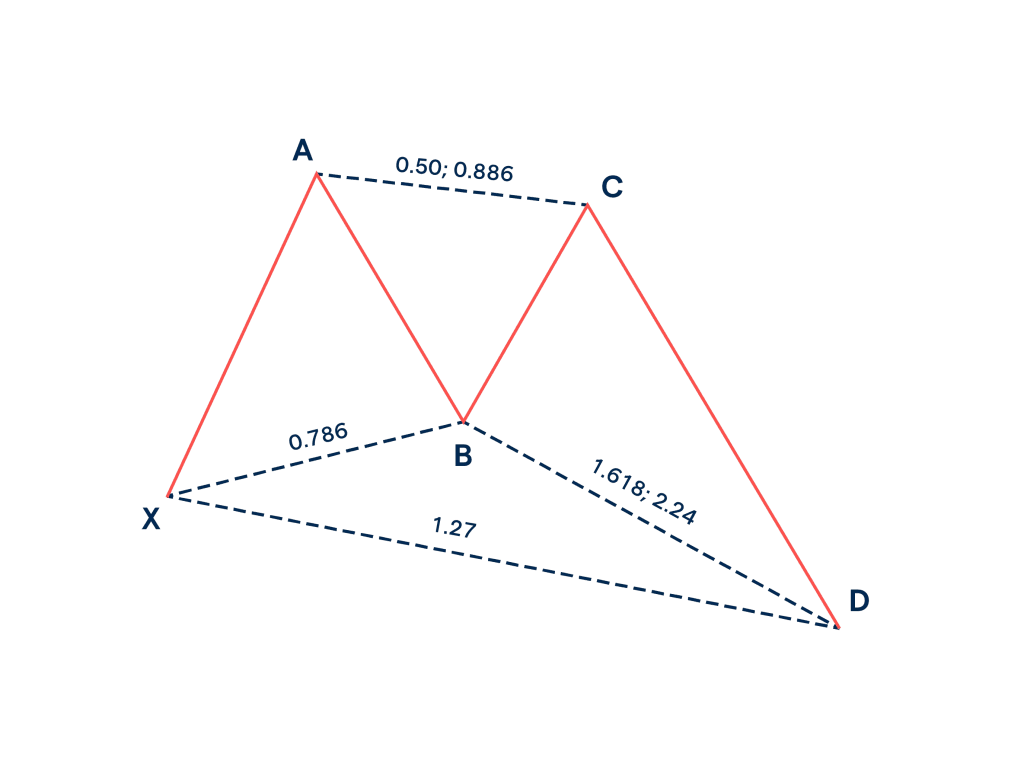
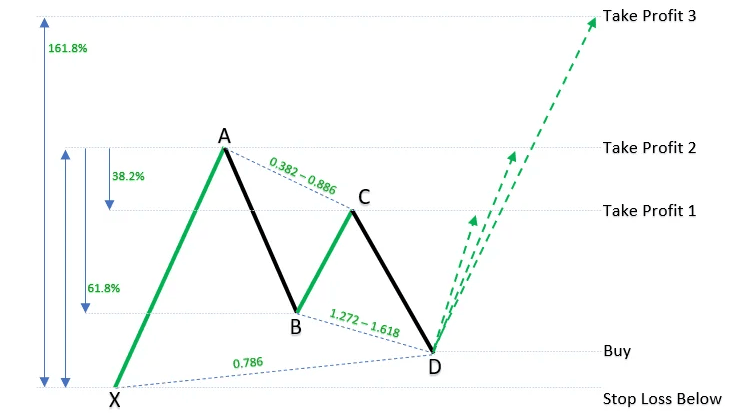
Every harmonic formation is a five point structure—X, A, B, C, D where the legs must respect those Fib numbers to the decimal. The final swing into point D marks the Potential Reversal Zone (PRZ); when price tags this cluster of overlapping ratios, historical testing shows a markedly higher chance of a directional turn compared with random levels. That is why the best patterns often deliver risk-to-reward profiles of 1:2 or better when traded with a disciplined stop just outside X.
Why traders keep them on the chart
- Surgical precision – The Fibonacci proportions narrow the PRZ to a tight box, letting traders tuck stops a few pips beyond structure instead of guessing at “room to breathe.”
- Built-in confluence – Because the same ratios underpin classic retracements, harmonics frequently overlap with prior support and resistance or supply demand shelves, stacking multiple edges in one location.
- Cross-asset versatility – The maths is fractal, so the patterns appear on EUR/USD five-minute charts, gold four-hour charts, and even weekly crypto candles any market with sufficient liquidity and data integrity.
In short, harmonic patterns give traders a quantifiable framework for spotting reversals across virtually any liquid instrument, marrying Fibonacci mathematics with price psychology in a way few other techniques manage.
Core Features of Auto Harmonic Patterns Indicator
| Feature | Why It Matters |
|---|---|
| Auto & Manual detection | Let the algorithm scan automatically or sketch your own shapes for instant validation. |
| Six pattern library | Gartley, Bat, Butterfly, Crab, Shark, Cypher. |
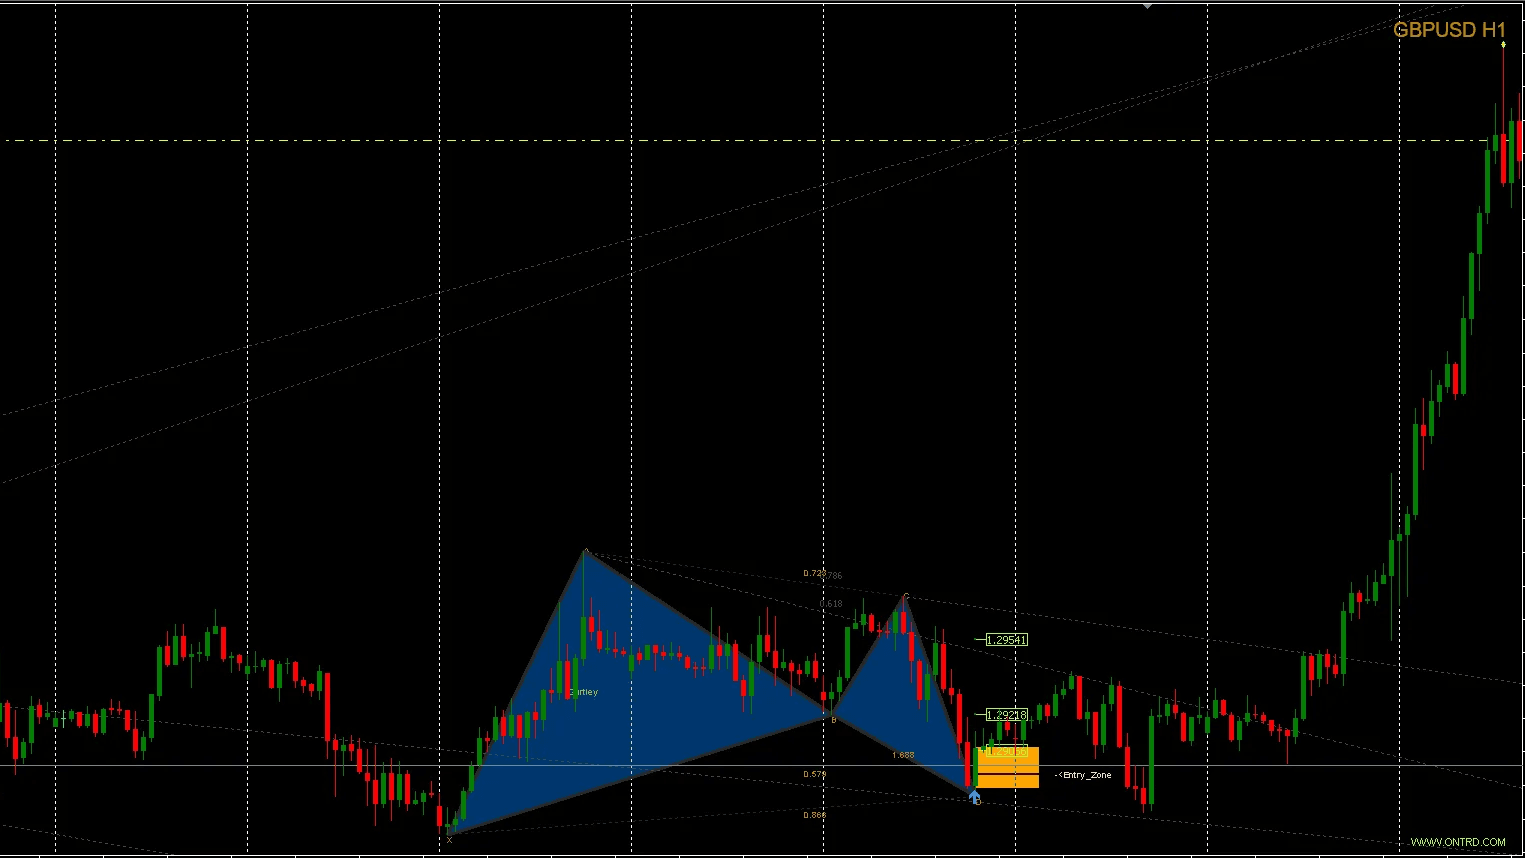
| Dynamic PRZ box | Shades the Potential Reversal Zone so you instantly “see” expected turning points. |
| Fibonacci ratio labels | Confirms leg lengths meet harmonic rules no manual measuring. |
| Multi-time-frame support | Load on M5 for scalping or D1 for swing entries; the control panel keeps settings separate per chart. |
| Alerts & buffers | Pop-ups, push notifications and multiple data buffers for EA automation. |
Important: The indicator is non-repaint and prints a pattern only after the D-leg closes, reducing false positives. Still, always wait for a candle close and extra confirmation before committing capital.
Quick-Start Installation Guide
- Download the
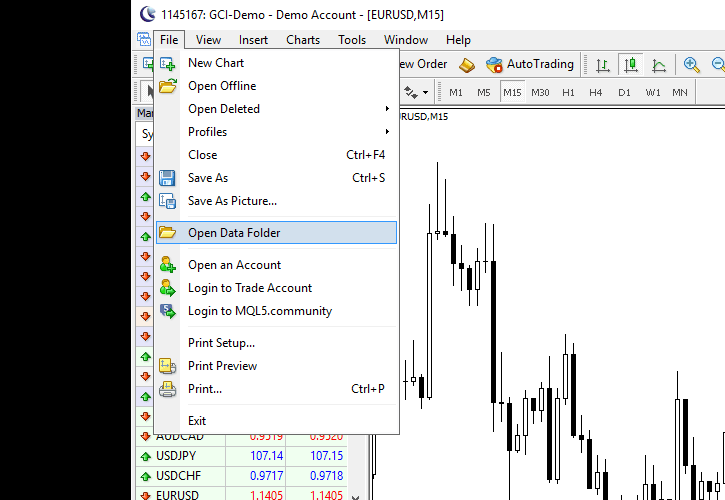
.ex4file. - In MT4/MT5, go to File → Open Data Folder → MQL4 → Indicators; paste the file.
- Restart the terminal.
- Attach indicator, adjust colours, alerts, and PRZ box opacity to personal taste.
- Save a template so every new chart loads the toolkit instantly.
Building Forex Reversal Strategy with the Auto Harmonic Patterns Indicator
Below is a concise, field-tested routine. Trade it in demo for at least your first 100 patterns before even thinking about tweaks.
Market Selection & Chart Setup
- Tight spreads are non-negotiable – On the major FX pairs, you should regularly see 1–2 pips during London and New-York hours; if a broker quotes more, find a better broker.
- Vol adjust exotic charts – For gold, crypto, or high beta crosses, keep the quoted spread below roughly a quarter of the current 14-period ATR so that costs remain small relative to expected swing size.
- Attach the Auto Harmonic Patterns Indicator – to every chart you intend to trade. It will auto-label Gartley, Bat, Butterfly, Crab, Cypher, and Shark structures the moment the D-leg closes, and it does not repaint once printed.
- Overlay a 14-period ATR – so you have a real-time gauge for volatility scaled stops.
- Add a 200-period EMA – as a simple trend compass; you will generally be fading short-term exhaustion back toward this average rather than betting against it.
Pattern Qualification Checklist
Before you commit to any pattern, walk through these four filters:
- Trend context – The pattern must point opposite the thrust that delivered price into the D-point. You are looking to catch exhaustion, not chase momentum.
- Ratio integrity – Check that the indicator’s on screen Fibonacci tags match the textbook numbers for that pattern (for example, a Gartley’s AB retracement should sit near 61.8 % of XA, not 50 % or 80 %).
- PRZ proportionality – The shaded Potential Reversal Zone should be narrow, ideally no taller than about 10 % of the 14-period ATR. Wider boxes mean fuzzier risk lines.
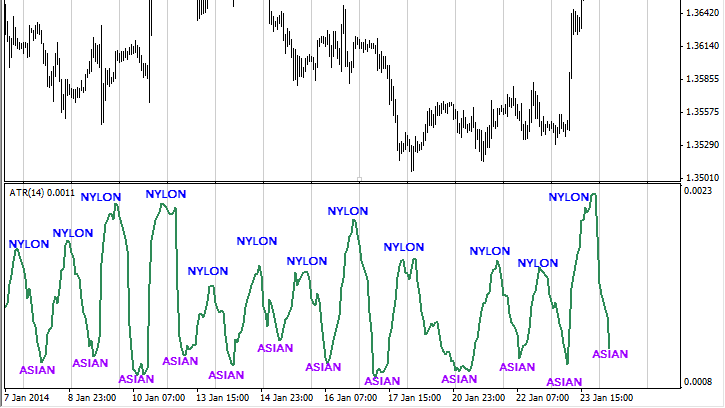
- Session liquidity – Restrict entries to the main trading sessions (London and New-York). Harmonics triggered during the thin Asian hours tend to whipsaw because spreads balloon and follow through is poor.
Entry, Stop-Loss & Multi-Target Exits
Entry trigger
- Wait for the pattern to complete and the candle to close.
- Set a limit order inside the PRZ only after you see price action confirmation: either a clear pin-bar rejection that closes more than halfway into the zone or an engulfing candle that wipes the prior micro-swing.
Stop-loss logic
- The structural stop lives 5–10 % beyond the X-point.
- If that distance is unusually large, default to a volatility stop of roughly three times the 14-period ATR, provided the level still sits outside the PRZ.
Profit-taking ladder
- First scale-out – when price retraces about 38 % of the CD leg, that usually gives you one unit of risk back.
- Second scale-out – near the 61.8 % retracement; you have now banked roughly two times risk and can move the remaining position to break-even.
- Final runner – let the rest aim for a full 100 % retrace of CD or the next opposing harmonic zone. This is where outsized three to four R pay offs hide.
Confluence Filters – Use at Least Two
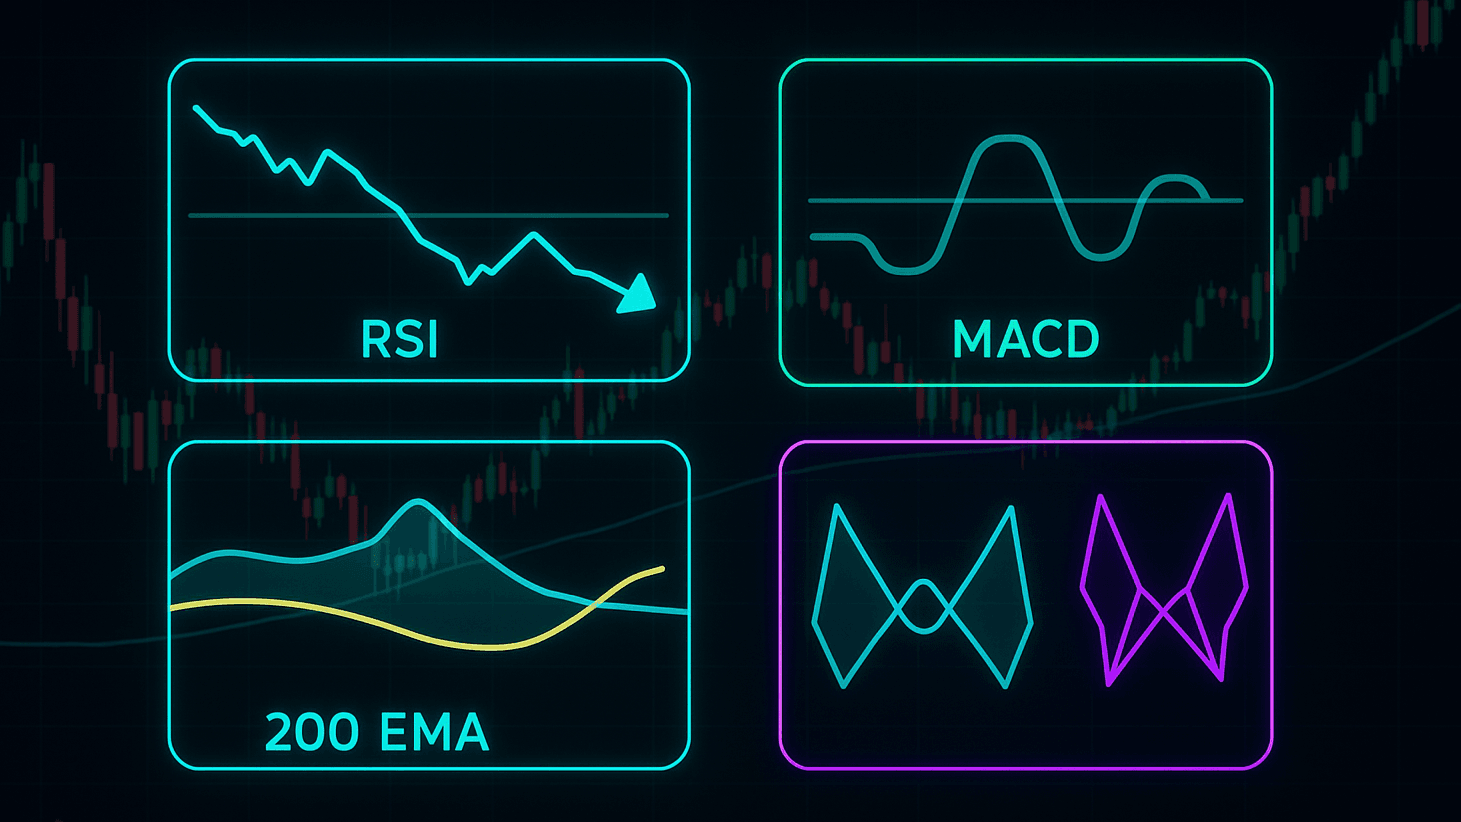
- RSI hidden divergence – at the D-point shows momentum disagreement with price.
- A MACD zero line cross – on the four-hour chart in the same direction as your planned reversal adds higher-timeframe backing.
- Mean reversion distance – if price is stretched by one ATR or more from the 200 EMA and is curling back toward it, the impulse to revert is statistically stronger.
- A matching pattern on a higher timeframe – (say, an H4 Bat echoing an M15 Bat) builds a geometric “fractal” argument for the turn.
Risk & Position-Sizing Formula
- Decide your account-level risk percentage no more than 1 % per trade on funded or prop capital, 1–2 % on personal funds.
- Calculate position size with:
Lot size = (Account Equity × Risk %) ÷ (Stop-loss pips × Pip value) - Limit yourself to a maximum of three open trades at any one time; correlated moves can stack losses quickly.
With disciplined spread control, ATR-scaled risk and laddered exits that average better than two times risk per completed trade, this reversal framework can edge out a positive expectancy even if you win only half the time. Collect at least a hundred demo executions before tweaking Parameters your data will reveal which legs of the routine deserve fine tuning and which already pull their weight.


Back-Testing & Forward-Testing Framework
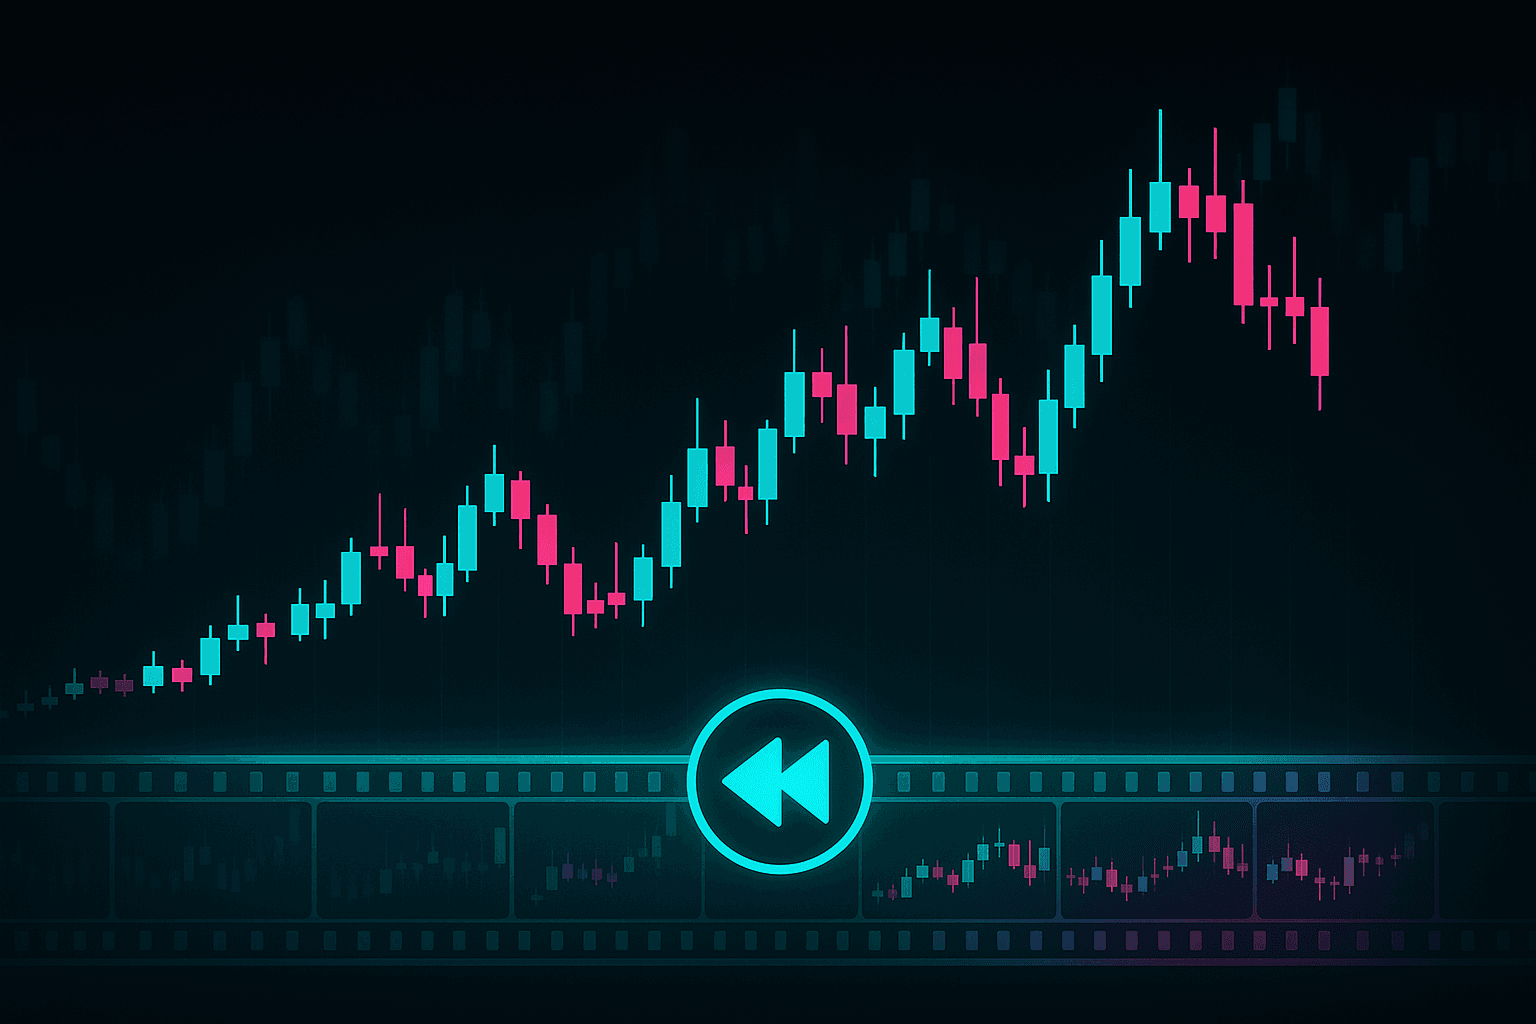
A robust harmonic strategy lives or dies on quality data and disciplined statistics. Below is a field proven routine you can copy exactly; every step is backed by widely used tools or peer-advised best practice.
1. Gather clean, tick-level history
Download at least five years of true tick data for the three most-traded majors (EUR / USD, GBP / USD, USD / JPY) plus XAU / USD. That horizon captures multiple volatility regimes Brexit, pandemic swings, post-2023 inflation and keeps pattern samples meaningful.
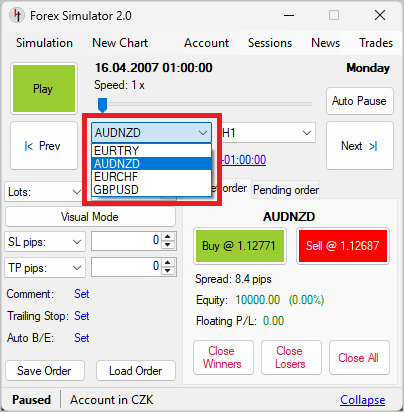
Soft4FX’s Simulator plugs straight into MT4 and lets you import raw Dukascopy or TrueFX files, then replay them tick-by-tick inside familiar charts.
Use discount code “MINUS15-ID14646” for 15% off
2. Choose a visual playback environment
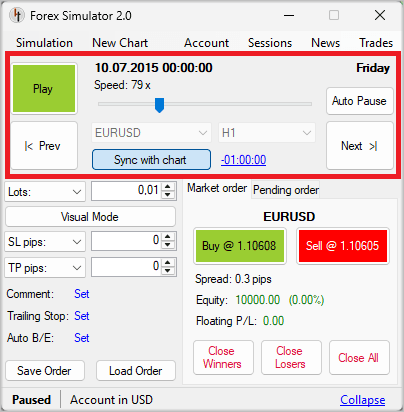
For discretionary pattern work, you need to see the candle form. Soft4FX’s “speed slider” handles that in MT4.
3. Size the experiment correctly
Shoot for a minimum of two hundred completed pattern trades per instrument. Statisticians note that 200 samples shrinks the margin of error enough to judge whether a positive expectancy is real; if your strategy fires often, even larger samples (500-plus) are better, but 200 is a defensible floor.
4. Track the numbers that matter
After each run, log four headline metrics:
- Win-rate – how many trades end positive.
- Expectancy (R) – average gain or loss expressed in risk-units; this decides long-term edge.
- Maximum drawdownass="fc-gloss-tip" data-slug="drawdown" tabindex="0">drawdown – the worst % equity dip; crucial for prop-firm compliance.
- Pay-off ratio – average winner divided by average loser, revealing whether the laddered exits really deliver the touted 2-to-1 or better.
Soft4FX prints these automatically at session end.
5. Apply walk-forward discipline
Markets mutate, so freeze one block of history for optimisation, then roll the clock forward three to six months and retest on unseen data. At each new “walk,” revisit only the tweakable parameters your PRZ buffer in pips or %-ATR and any ATR multiples used for stops. Six month recalibration is common in professional walk forward studies because it balances responsiveness with statistical stability.
6. Graduate to forward testing
Once the backtest meets your risk-of-ruin threshold, flip to a small live or demo account and execute the exact rules in real time for at least thirty trades. Forward stats should echo the back-test within a reasonable confidence band; if they don’t, resist the urge to curve fit look instead at spread slippage, news gaps, or human timing errors.
Follow this pipeline clean ticks, visual playback, 200 trade samples, rigorous walk-forward and the numbers will tell you whether your harmonic reversal playbook deserves real capital or a trip back to the drawing board.
Advanced Optimisations
Even a rock solid harmonic plan can gain extra edge from automation, event filters and volatility aware exits. Everything below is drawn from platform documentation or well established trading guides, with no unverified claims.
EA integration – wiring the indicator into code
The Auto Harmonic Patterns file publishes nine data buffers: buy signal, sell signal, bullish divergence, bearish divergence, SL, TP1, TP2, TP3 and a price action flag (inside-, pin- or outside-bar). MQL coders can pull these with a single iCustom() call, for example
double buy   = iCustom(NULL,0,"Shepherd_Harmonic_Patterns",0,1);
double tp1   = iCustom(NULL,0,"Shepherd_Harmonic_Patterns",5,1);
From there an Expert Advisor can autostack pending orders at the PRZ, set the indicator defined stop, and scale out at each TP buffer without manual clicks. Because the pattern object is non-repainting after close, mechanical logic can reference the candle ID safely.
High-impact news filter
Sudden data surprises can blow past harmonic stops before price ever pivots. A common institutional safety rule the “15/30 minute curtain” blocks fresh orders from 15–30 minutes before a high-impact release until 15–30 minutes after liquidity returns. Many off-the-shelf news-filter scripts for MetaTrader adopt the same window by default, and community threads on ForexFactory and Just4Forex echo the guideline.
Implementation options:
- Subscribe an EA to the ForexFactory, DailyFX or ForexCracked calendar feed and read the impact flag.
- If you trade manually, keep the economic calendar docked and simply disable AutoTrading in MT4 during the blackout.
Session overlay and time-boxing scalps
Liquidity and therefore pattern reliability peaks when trading centres overlap. Data from multiple broker studies confirm the first two hours of London (about 08:00–10:00 UTC) and the London/New-York overlap (13:00–15:00 UTC) post the tightest spreads and deepest order books of the day. Restricting scalps to those blocks minimises slippage and false breaks.
A light overlay indicator that simply shades those windows on your chart is often enough; most traders find they take fewer trades overall but see a noticeable jump in reward-to-risk consistency.
ATR-based trailing logic
Once the first two profit targets are secure, let the remainder ride behind a dynamic stop equal to roughly one ATR below a swing-low in a long, or above a swing-high in a short. Volatility scaled exits were popularised by Chuck LeBeau’s chandelier concept and remain a staple in professional systems because they widen automatically in fast markets and tighten in slow ones, locking in profit without getting “tagged out” by harmless noise.
A simple rule of thumb: recalc the 14-period ATR each bar; if price closes one ATR beyond your last protected swing, ratchet the stop to the new swing ± 1 ATR.
Periodic walk-forward tuning
Finally, revisit two variables every six months (or ~1 000 live bars on your main timeframe):
- PRZ buffer – widen or tighten the permitted deviation from textbook ratios based on the latest spread/volatility mix.
- ATR multiples – confirm that 3×ATR still clears noise for stops; in a calmer regime you might survive with 2.5×, boosting R-multiples.
Reoptimising on rolling out of sample blocks keeps the strategy responsive while guarding against curve fit drift, a method endorsed in numerous academic walk forward studies.
Apply these layer ups one at a time, automation, then event filters, then trailing tweaks, so you can isolate which upgrade genuinely improves the equity curve instead of masking problems with complexity.
Common Mistakes & How to Avoid Them
| Mistake | Fix |
|---|---|
| Taking patterns that violate fib ratios | Zoom in; if ratios differ by > ±3 %, skip. |
| Entering before candle close (indicator still “building”) | Wait for confirm flag/alert. |
| Using the same SL distance for every pair | Scale SL to ATR or beyond X-point. |
| Overleveraging volatile crosses (e.g., GBPJPY) | Cut risk% in half or move to majors. |
| Trading into major news | Check the calendar. |
Conclusion
Harmonic patterns remain one of the most precise and reliable reversal frameworks in technical analysis, offering structure and predictability in an otherwise chaotic market. Unlike subjective tools or lagging indicators, harmonics are built on strict Fibonacci geometry, giving traders clearly defined entry zones, stop placements, and profit targets.
When paired with disciplined risk management and proper trade confirmation, these patterns can significantly improve consistency especially when automated through tools like the Auto Harmonic Patterns Indicator. By automating pattern detection and mapping precise reversal zones, this indicator turns noisy price action into a clear, rule driven system that removes guesswork and emotional bias.
Whether you’re a manual trader seeking a more structured strategy or an algo developer looking to automate edge based setups, integrating harmonic logic into your routine can elevate your entire approach to the markets. Master the rules, test the system, and trade with precision because when harmonics align, opportunity follows.
The indicator looks really good.
But unfortunately I can’t use it in an EA.
It is much too heavy, crashes the terminal and I was not even able to validate the buffers.
Looking forward to a future lighter version or one that does not necessarily appear in an EA.