
Every trader knows the frustration of being “stopped out” by market noise, only to watch the price reverse and hit the original target. The market is chaotic, but it is not random. To navigate price action effectively, successful traders often blend two powerful concepts: the responsiveness of Exponential Moving Averages (EMAs) and the precision of the Fibonacci Sequence.
This guide details the Fibonacci Moving Averages Indicator, a dynamic MT4 tool designed to filter out fakeouts and highlight high-probability entries. Below, we break down the logic, the step-by-step strategy, and a community-exclusive tip to boost your accuracy.
Table of Contents
What is the Fibonacci Moving Averages Indicator?
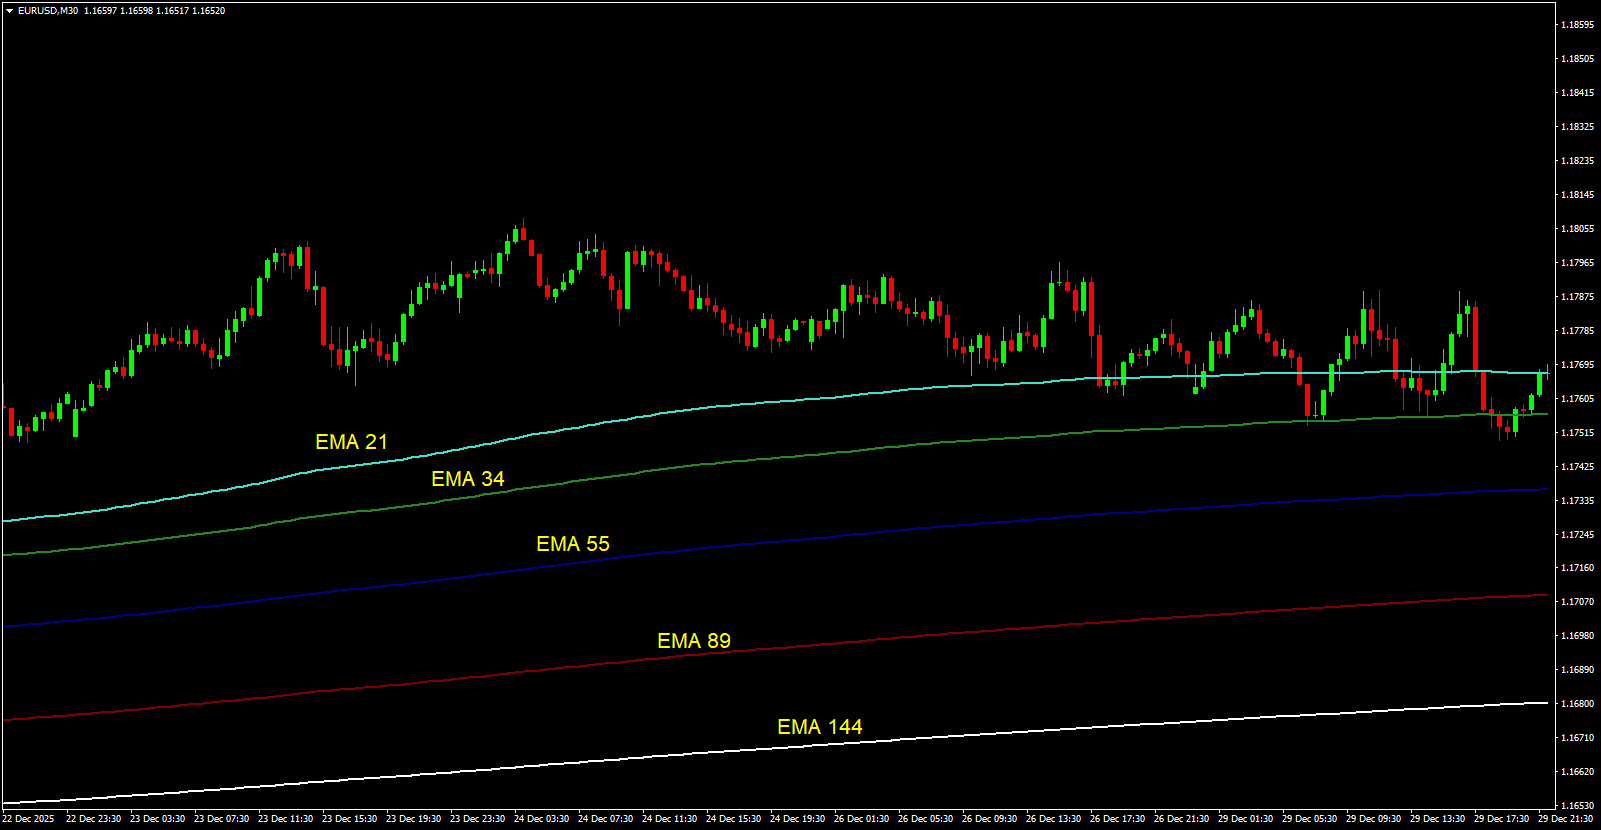
The Fibonacci Moving Averages Indicator functions as a dynamic support and resistance system. Unlike a standard Simple Moving Averagec-gloss-tip" data-slug="moving-average" tabindex="0">Moving Average (SMA), this tool utilizes five specific EMAs derived from the golden numbers of the Fibonacci sequence: 21, 34, 55, 89, and 144.
Why These Specific Numbers?
- Responsiveness – EMAs weight recent price action more heavily, significantly reducing the “lag” associated with traditional trend indicators.
- Natural Ratios – By adhering to Fibonacci numbers, the indicator aligns with the natural ebb and flow of market psychology, helping traders distinguish the “true” trend from temporary volatility.
Note: Whether you are scalping Crypto or swing trading Forex pairs, this tool adapts to market momentum to reveal where value lies.
The Setup: Decoding the Zones
To trade this system effectively, you must understand the two distinct “zones” created by the indicator lines.
1. The “Fast Lane” (EMAs 21 & 34)
These are short-term averages. They react quickly to price changes and serve as your primary signal for early trend detection.
2. The “Backbone” (EMAs 55, 89, & 144)
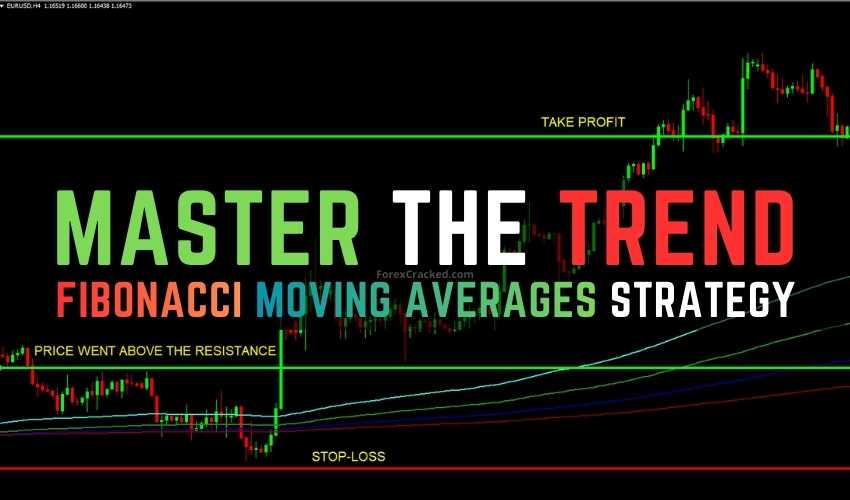
These longer-term averages represent the major trend. They act as a thick band of support or resistance. Key Rule: When the price holds above or below this band, the trend is considered healthy.
The objective is not just to see a line crossover; you are looking for the Fast Lane to separate clearly from the Backbone.


The Strategy: Step-by-Step Execution
This strategy relies on momentum shifts. A crossover signals that momentum has moved from the long-term baseline to immediate short-term action.
The Bullish Setup (Buy Signal)
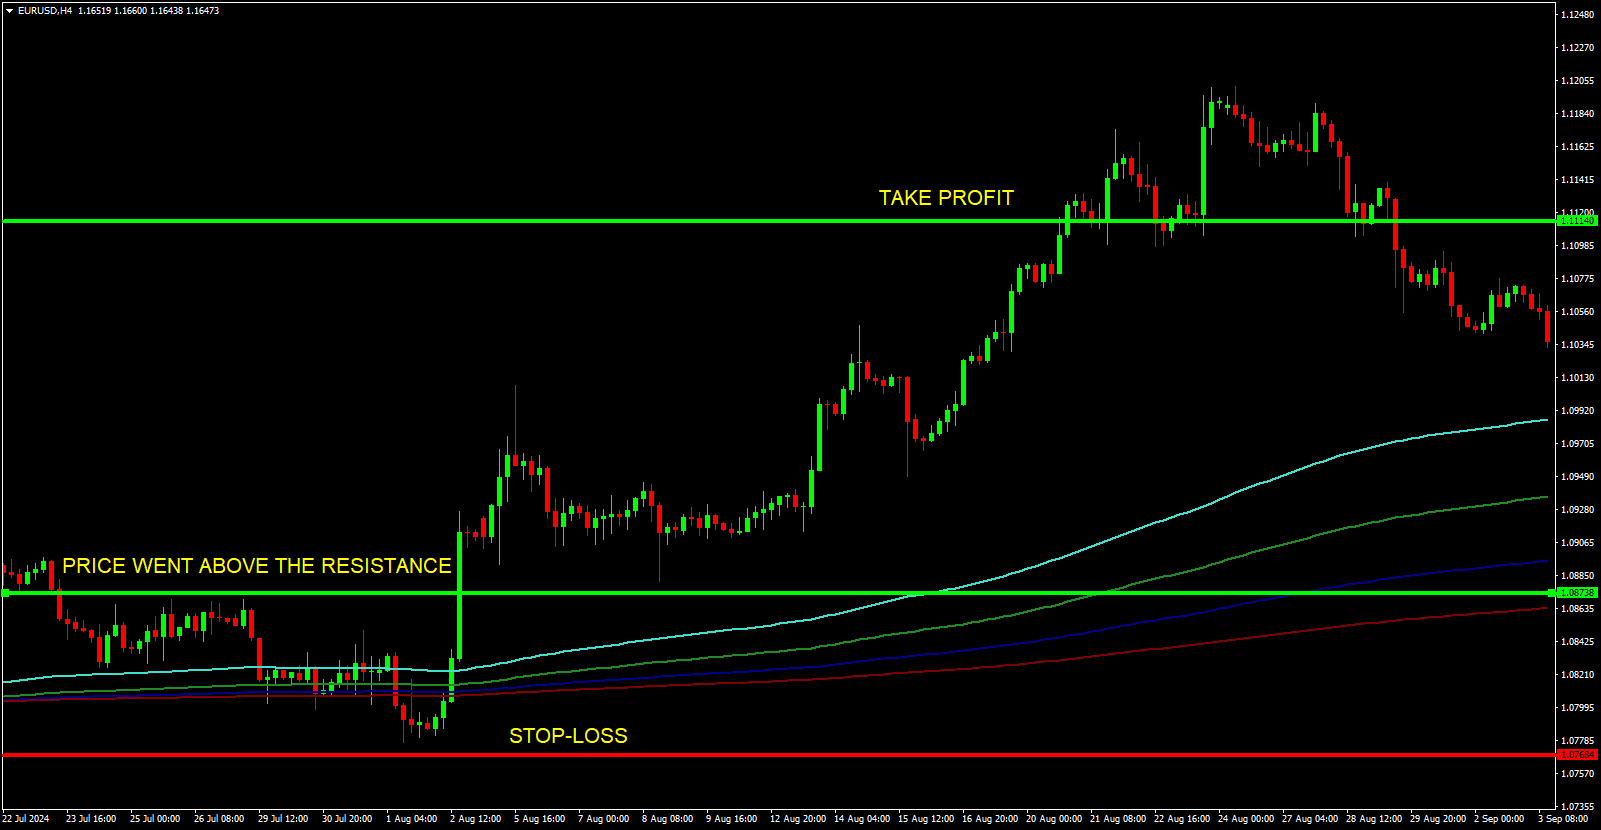
Follow this checklist to enter a long position:
- Trend Check: Ensure price action is printing higher highs and higher lows.
- The Trigger: Wait for the Short EMAs (21, 34) to cross above the Long EMAs (55, 89, 144).
- Validation: Do not enter blindly at the cross. Confirm that the price is trending effectively above the EMA bands.
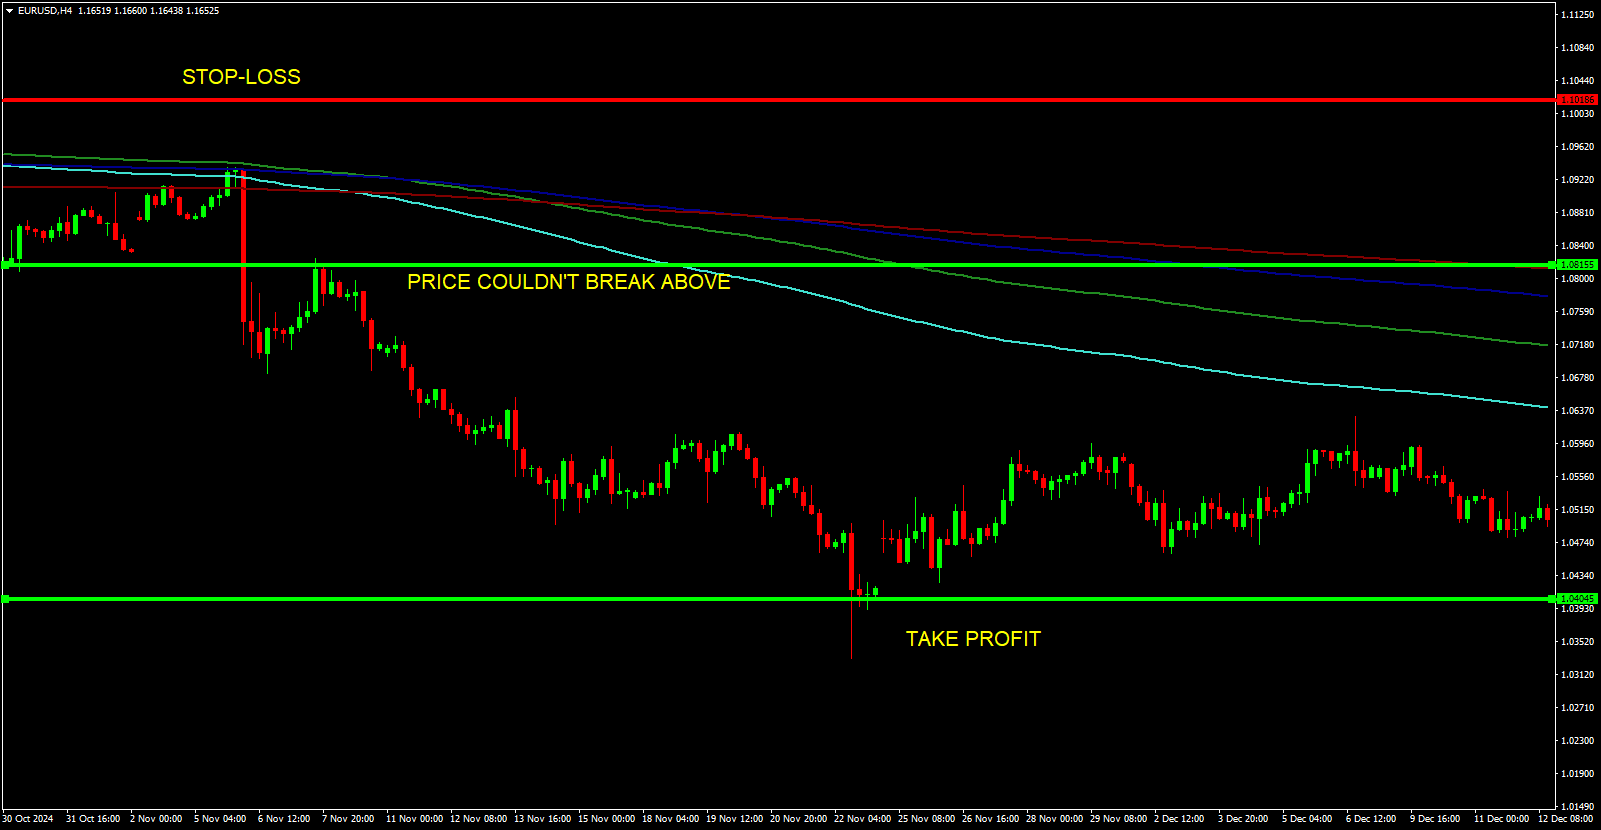
- Stop-Loss: Place your SL just below the most recent swing low. This protects capital if the trend collapses.
- Take-Profit: Target the next resistance level or utilize a 1:2 Risk-Reward ratio.
The Bearish Setup (Sell Signal)
Follow this checklist to enter a short position:
- Trend Check: Ensure price action is printing lower highs and lower lows.
- The Trigger: Wait for the Short EMAs (21, 34) to cross below the Long EMAs (55, 89, 144).
- Validation: Confirm that the price is trending below the EMA bands.
- Stop-Loss: Place your SL just above the most recent swing high to limit risk.
- Take-Profit: Target the next support zone or utilize a 1:2 Risk-Reward ratio.
Pro Tip: The “FaTe” Confluence Filter
Experienced traders understand that indicators are tools, not crystal balls. To increase the authority of your trade entries, we recommend a technique shared by one of our top community members, FaTe.
The Strategy Upgrade
Do not rely solely on the moving averages. Overlay a standard Fibonacci Retracement tool on your swing.
The Setup: Watch for the price to pull back into the Fibonacci Moving Averages (specifically the 55 EMA) while simultaneously hitting the 38.2%, 50.0%, or 61.8% retracement levels.
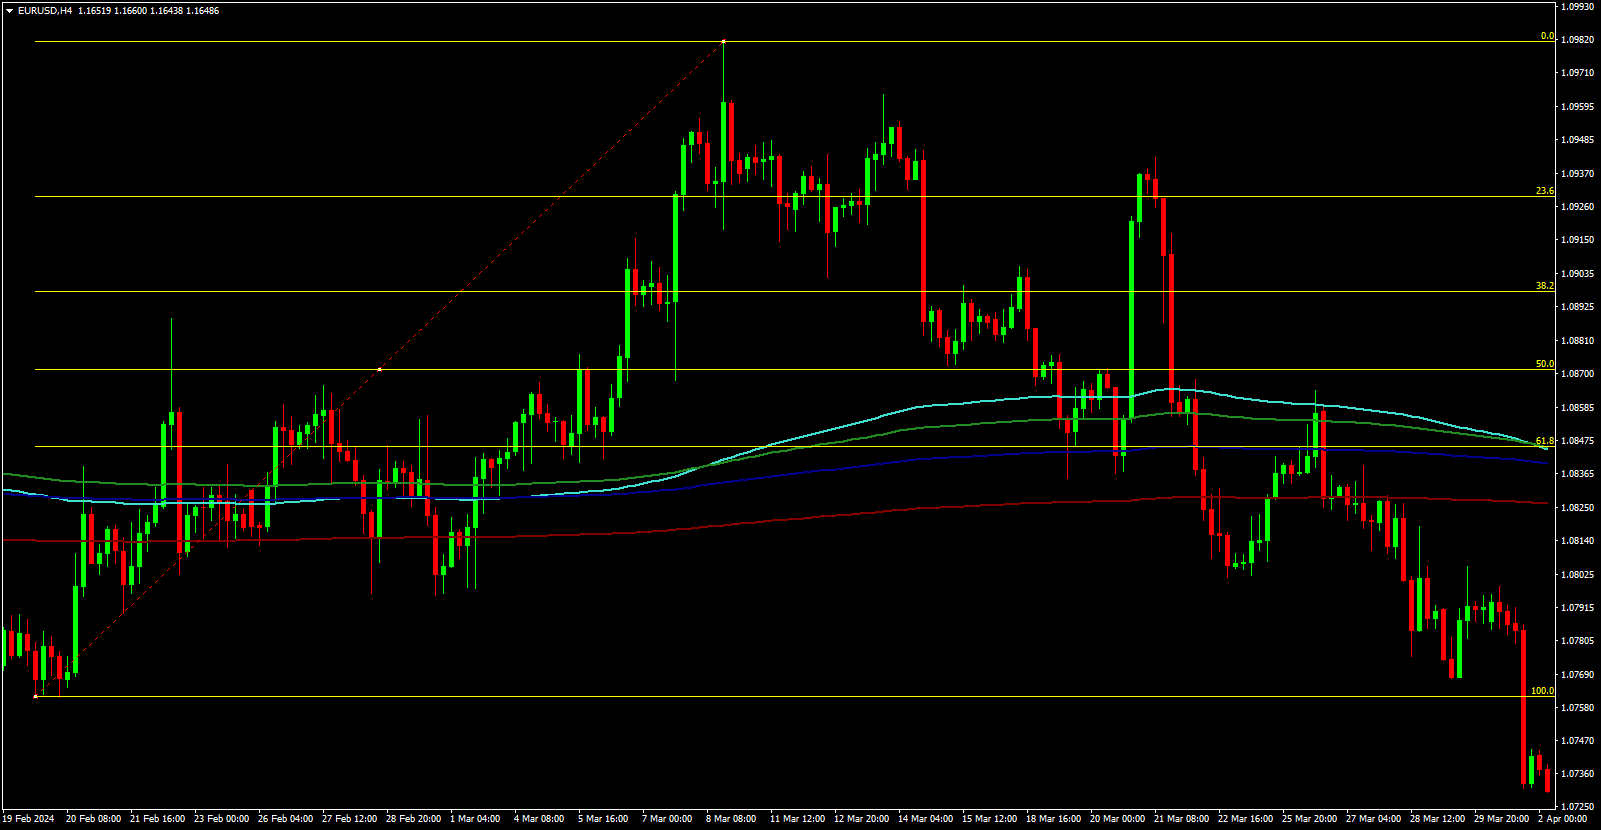
Why It Works:
When the dynamic support of the EMAs aligns perfectly with a static Fibonacci retracement level, it creates a “Confluence Zone.” These zones have a statistically higher probability of rejecting price and resuming the trend.
Summary: Why Use This Tool?
The Fibonacci Moving Averages Indicator addresses the two biggest hurdles in trend trading: Lag and Noise. By smoothing out price action using Fibonacci mathematics, it allows you to:
- Ride Trends Longer: Stay in the trade until the market structure actually reverses, rather than exiting on minor fluctuations.
- Asset Versatility: Apply the same logic to Forex, Indices, or Commodities.
- Visual Clarity: Replace multiple messy indicators with one clean, color-coded system.
Disclaimer: Trading leveraged products like Forex carries a high degree of risk. Past performance is not indicative of future results. Ensure you understand the risks and test this strategy on a demo account before trading with real capital.
Admin this is wonderful!
Very good strategy with the especially 55 MA with the Fibo 38, 50 or 61.8. It works really well. Thanks!