
This is a counter-trend rsi forex trading strategy. We know that many of you do not trade against the trend; however, you are not looking for a trend move but more of a scalp with this strategy. Our target depends on the signal timeframe. The point here is to choose a precise point and exit early with few pips (depending on the timeframe). So, in a nutshell:
- This is a counter-trend strategy
- This forex strategy is based on selling when the market is overbought and buying when the market is oversold
- The indicator we use is RSI MTF,You can Download it Below.This plotted in 1min timeframe so you clearly can see the RSI levels in one window without having to change to each timeframe from 1 minute to 1-week timeframe
- You must take a small profits and not try to pick a top or bottom because markets can stay overbought / oversold for an extended period. Use positioning/stops If you wish to catch a more significant move and place TP on entry when it starts moving in your favor.
- Works on all currency pairs/all timeframes
Before we show you some example trades, including trades that we’ve taken using this method, let us say that :
We know that many will disagree with trading against the trend, but we found for our trading style that we can pick temporary tops/bottoms with this method and get some pips (Well, the key here is not to be greedy and also be confident about your setup)
So how a trading signal is generated?
First, put the indicator and open the 1m chart. It will show you the RSI levels on all timeframes for that currency pair. Please also add the levels below 20/17, 80/83 to the rsi indicator and make them RED lines so you can see when a pair does an extreme reading.
We enter long when:
The RSI reaches 20 or less we enter long. A better signal is when two or more timeframes have the same low RSI with alert signals. A more powerful signal would be a forex divergence on the chart that suggests our position from that entry.
We enter short when:
The RSI reaches 80 or more we enter short. A better signal is when two or more timeframes have the same high RSI signal. A more powerful signal would be a forex divergence on the chart that suggests our position from that entry.
Ok, We believe that charts are worth a lot more than words, so we’ll share some setups.
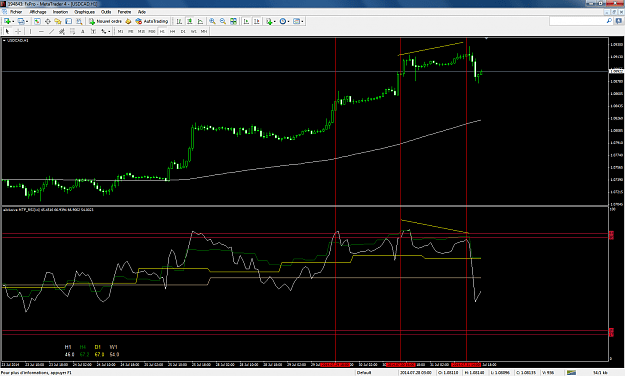
These are some USDCAD opportunities in this current strong uptrend.
In the first chart setup, even though it moved down then up to continue a strong up move, you could get at least 10pips; as I said, your target should take timeframe into account. The first signal appeared only in the 1-hr chart. It takes some consolidation to free up the ob reading.
The white line is 1hr rsi.
In the second setup, Both 4hr and 1hr were above 80, a stronger signal to sell into correction; the chart price corrected 30 pips without spread almost. True, it goes up again. However, that’s not our main goal. We only use to get pips during the trend corrective move.
The third chart signal was so strong because it shows that RSI (1hr/4hr) both are close to/above 80, the price made a higher high, and rsi made a lower high, which is a stronger signal to sell the price corrected about 50 pips.
We’ve traded all 3, but we get about 7-8 pips and exit; We do not use a trailing or stop; that’s something up to you, really.
Do not be greedy; one or two forex reversal candles can be good for you. Please do not wait for the entire reversal of the trend because it needs more than that. Example: If you “feel” or technically study that it’s a top, open two lots trade the same size, and make one +10 TP and the other at BE or like that, you can catch more significant moves or trail stop.
Setup:
Put exclusive mtf rsi on a 1min chart, add levels 20/17/80/83, and remove levels 70/30/50. Make the level line red and clear as they are on RSI extremes.
Put a 200 WMA on the chart (This is only just for guidance, so we can see how far the chart price went away from the moving average). we have seen in many situations how chart prices try to narrow the distance between this MA and not stay far away, especially when the market is at the extreme. We will need a good eye to catch clear opportunities.
What Not To Do
- Overtrade
- Trade the news
- Trade Friday
What Need To Do
Add to the position if it moves against your trade, and stay confident that you can close your positions with a small profit or at least at breakeven.
Read More: THE RSI DIVERGENCE STRATEGY