

Technical analysis, the study of past market data primarily through price and volume charts, plays a crucial role in trading. A fundamental aspect of this practice involves identifying trends and drawing trend lines, which are essential for understanding market movements and making informed trading decisions.
In this article, we will talk about the concepts of trends and trend lines in technical analysis, looking at their importance and their application in forex trading.
What are Trends in Technical Analysis?
A trend in financial markets refers to the general direction in which the price of an asset is moving.
Prices cannot move in one direction forever because buyers eventually need to sell, and short sellers eventually need to buy back. This basic principle of supply and demand causes prices to move in different trends.
The idea about trends is that they stick around. If something’s been trendy for a while, it’s likely to stay that way for a bit. This happens because people believe the trend will continue, so they buy or support it, which keeps it going. It’s kind of like a self-fulfilling prophecy.
Trends can be categorized into three main types:
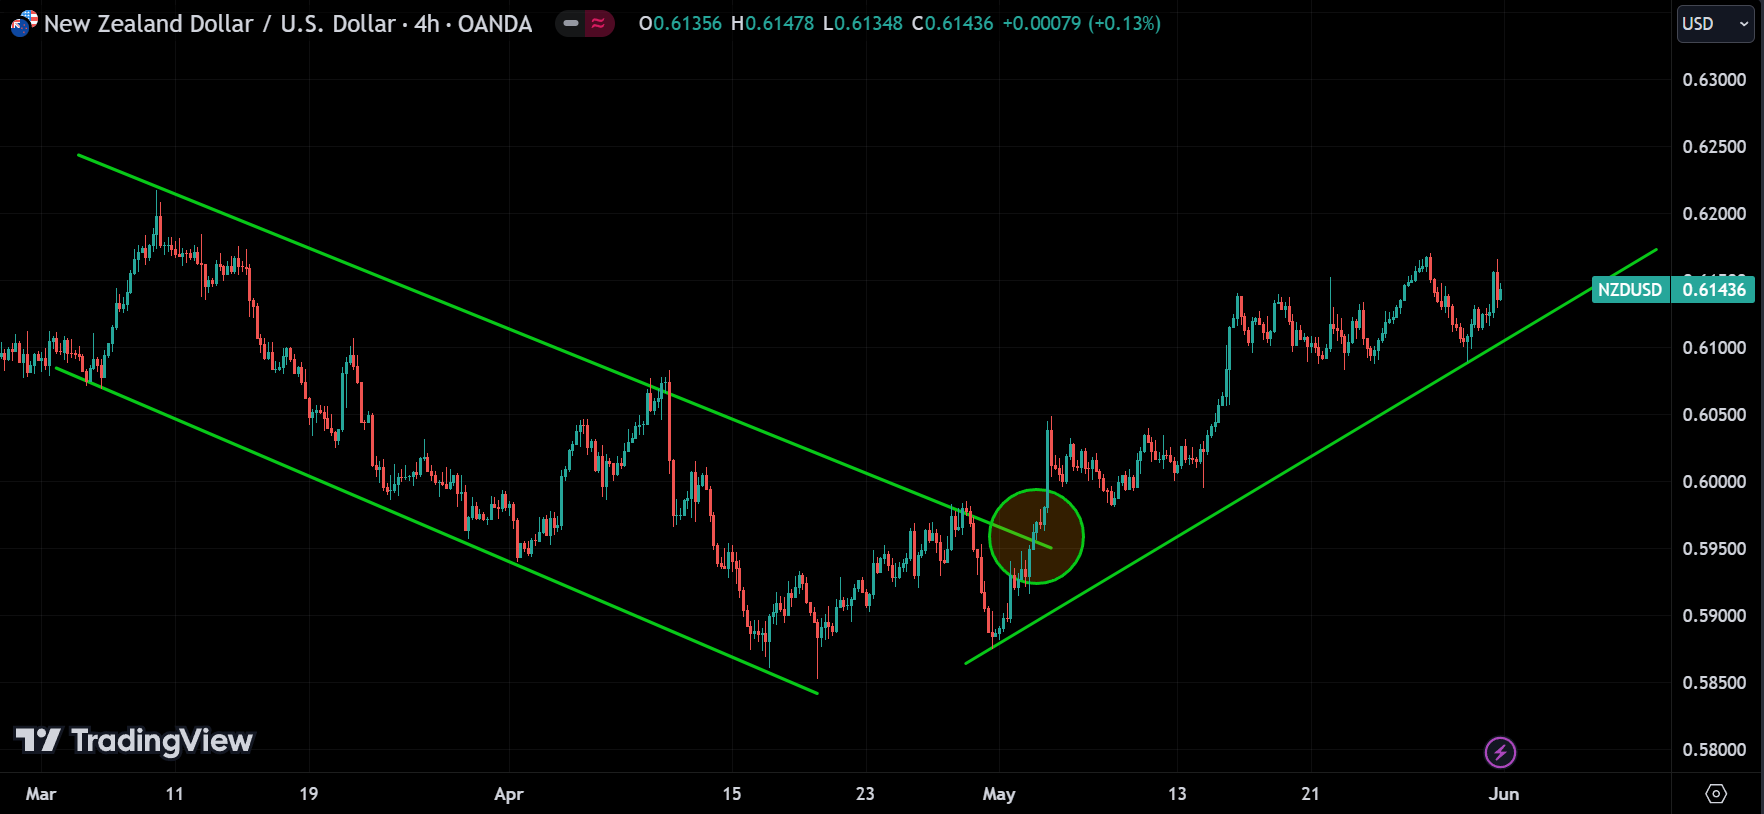
Uptrend:
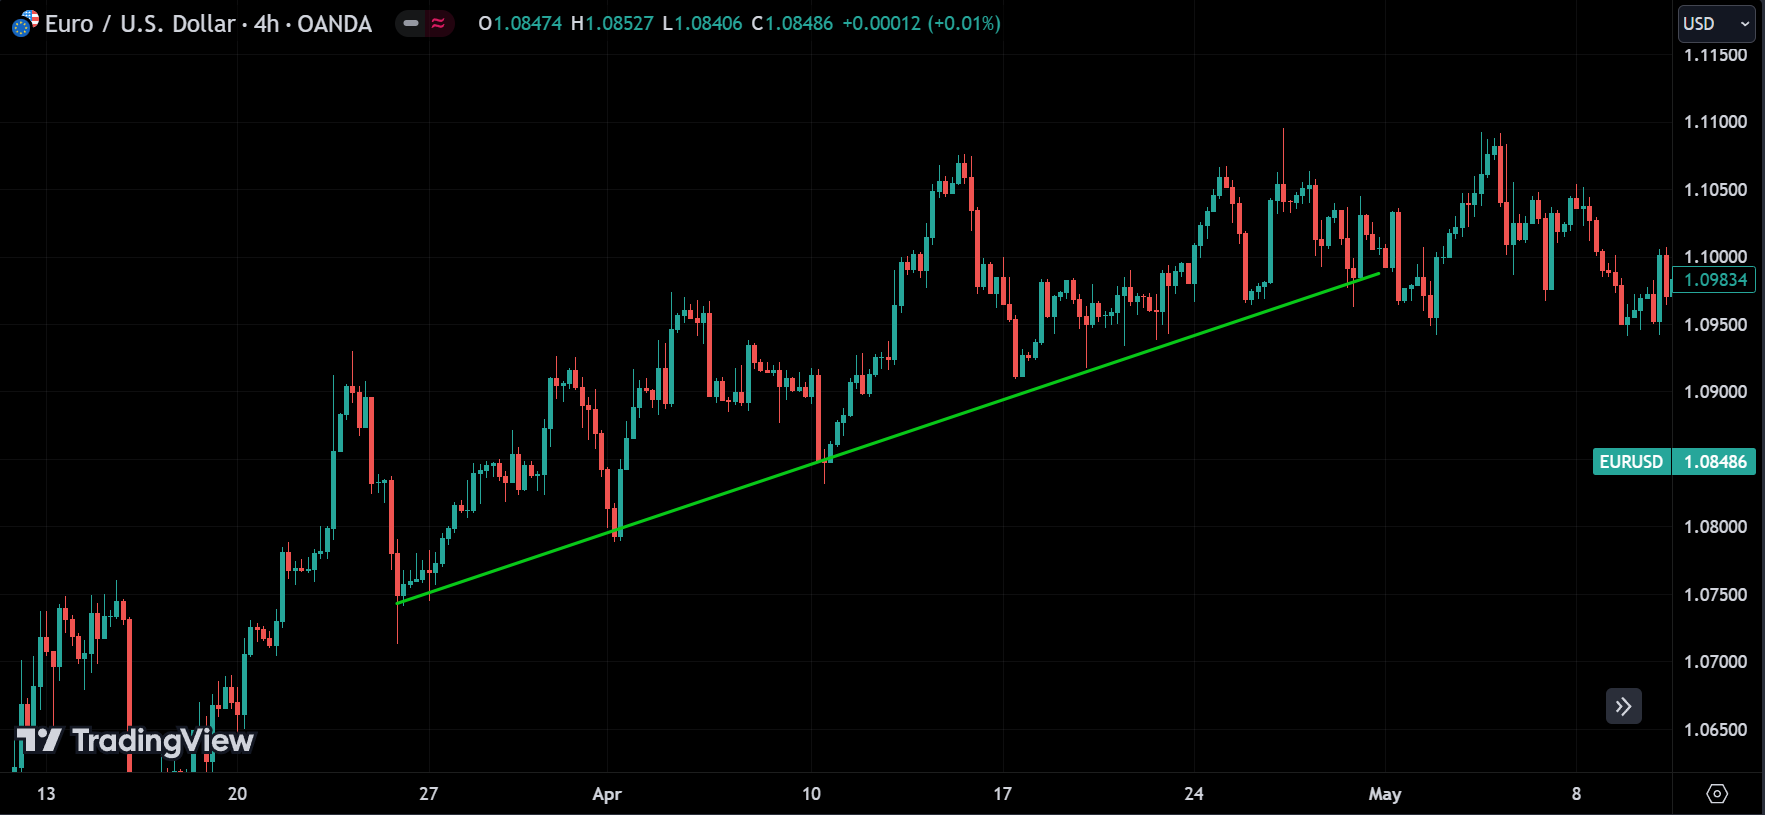
An uptrend is characterized by higher highs and higher lows. It indicates that the price is consistently moving upwards over time, suggesting bullish market sentiment.
Downtrend:
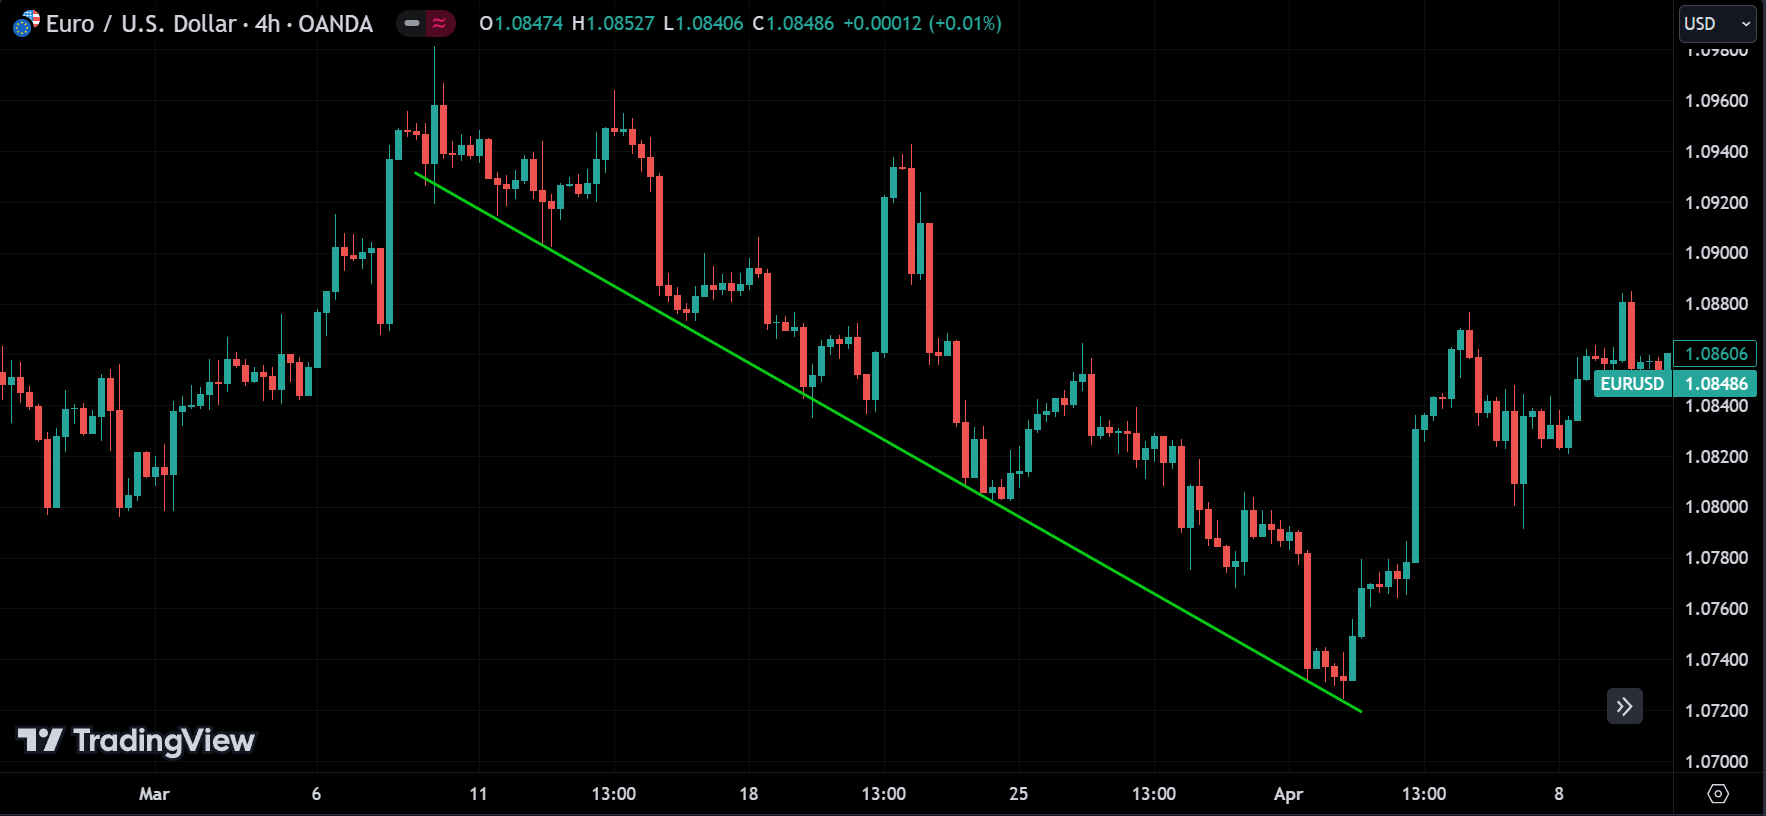
A downtrend is marked by lower highs and lower lows, indicating that the price is consistently moving downwards, reflecting bearish market sentiment.
Sideways/Horizontal Trend:
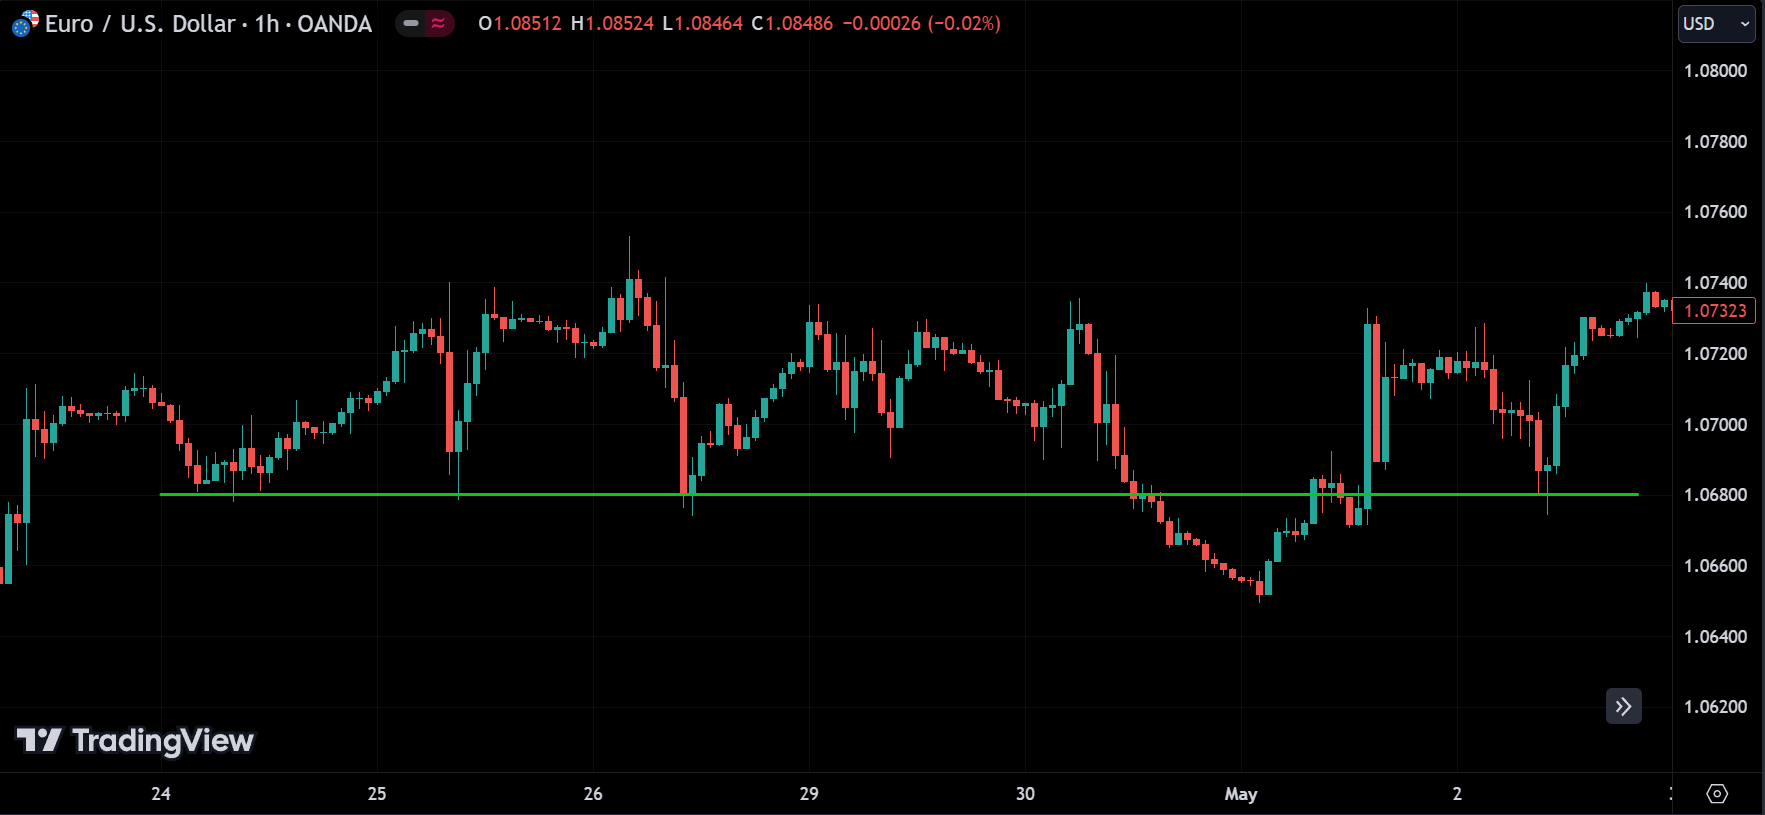
A sideways trend occurs when the price fluctuates within a horizontal range, showing no clear upward or downward movement. This trend suggests market indecision or consolidation.
What are Trend Lines in Technical Analysis?
Trend lines are straight lines drawn on a chart that connect significant price points, such as highs or lows, to visualize the direction and strength of a trend.
Trend lines serve several purposes:
Identifying Trends:
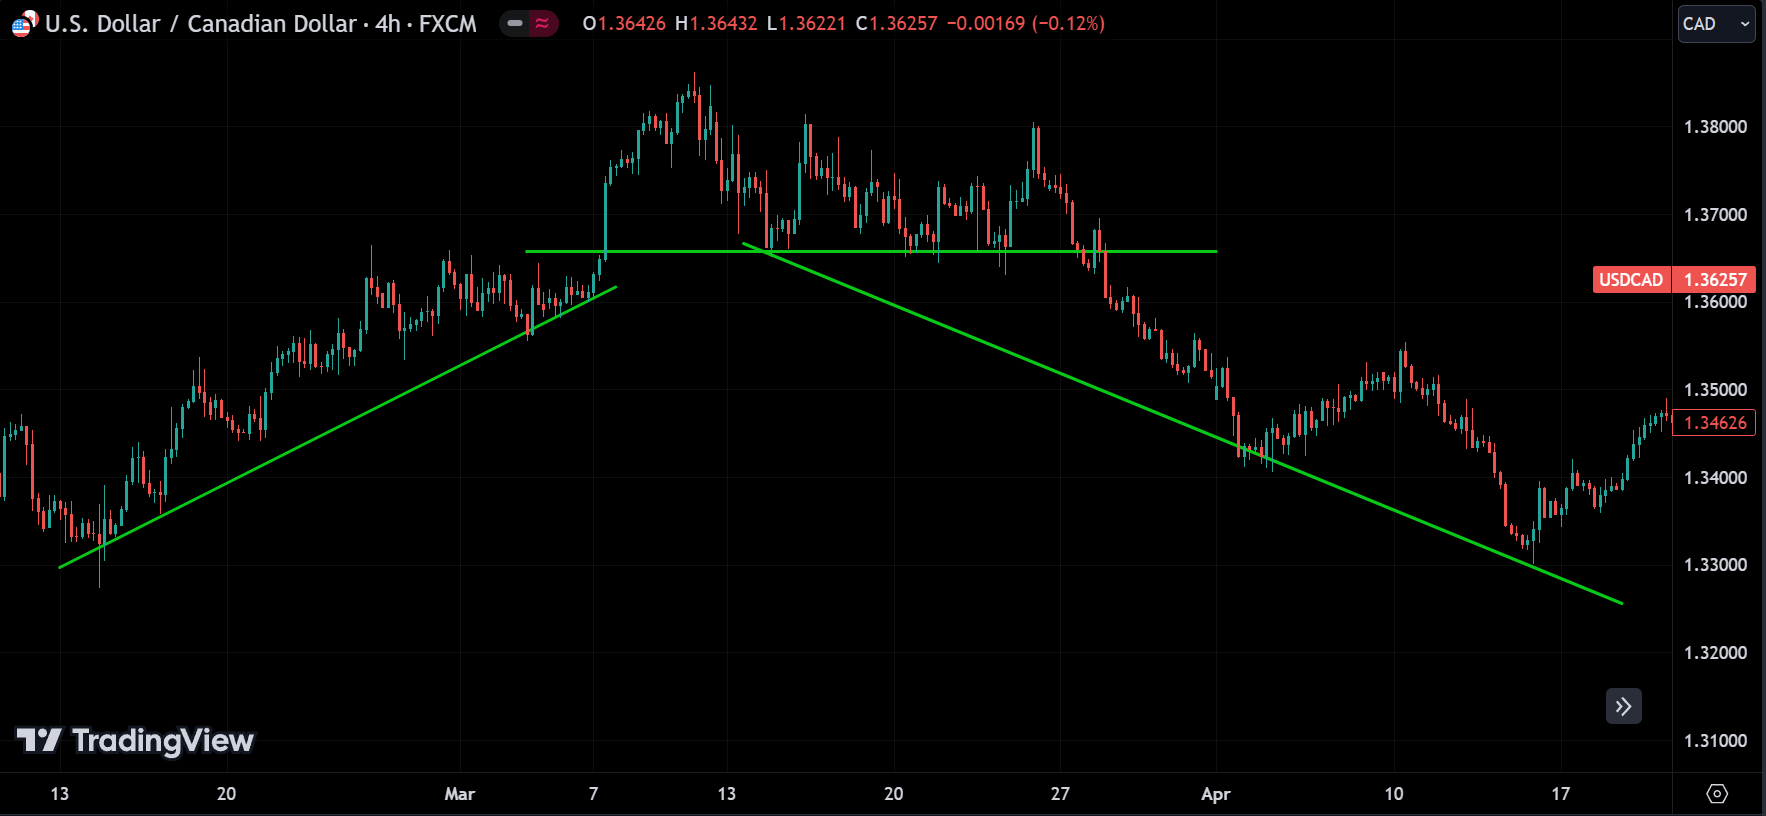
Trend lines help traders and analysts identify the prevailing market trend. By connecting consecutive highs or lows, they can confirm whether an uptrend, downtrend or sideways trend is in place.
Support and Resistance:
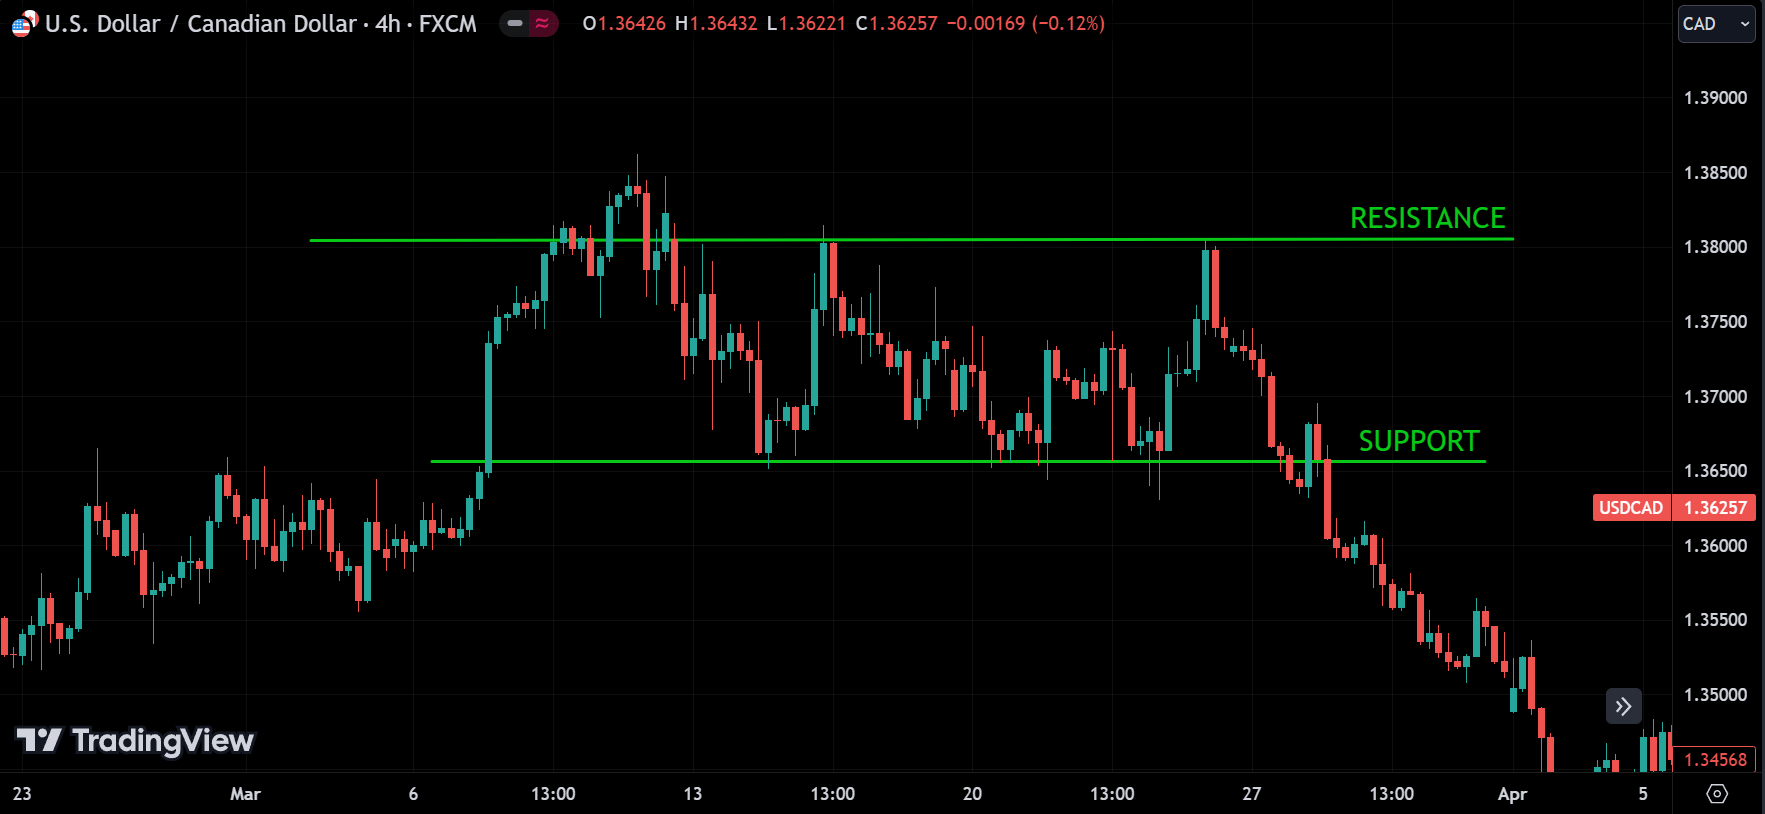
Trend lines act as dynamic support or resistance levels. In an uptrend, a trend line drawn below the price action (connecting the lows) can serve as a support level. In a downtrend, a trend line drawn above the price action (connecting the highs) can act as a resistance level.
Trend Reversals:
Breaking a trend line often signals a potential trend reversal. For example, if the price breaks below an uptrend line, it may indicate a shift towards a downtrend, and vice versa.
Drawing Trend Lines
Drawing accurate trend lines needs a step-by-step method. Don’t try too hard to find trends; they should be easy to spot. If only you see the trend, it won’t affect the market. For the trend to be effective, others need to see it too, so they can support the price and thereby support the trend.
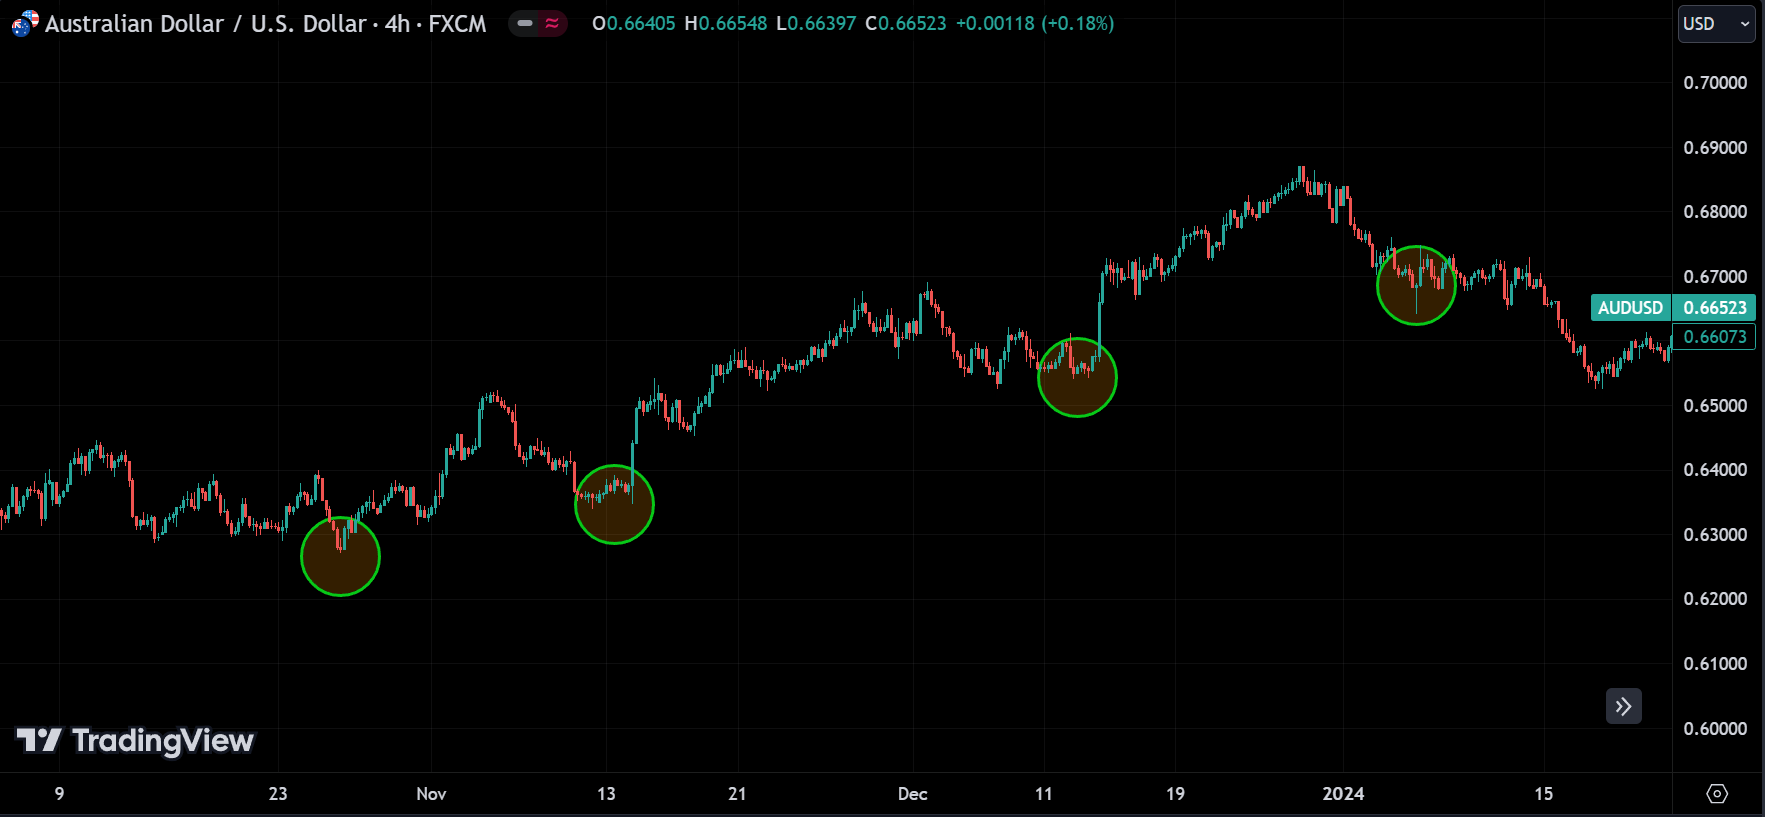
- Step 1: Identify Significant Points: In an uptrend, select at least two significant lows to connect with a straight line. In a downtrend, choose two significant highs.
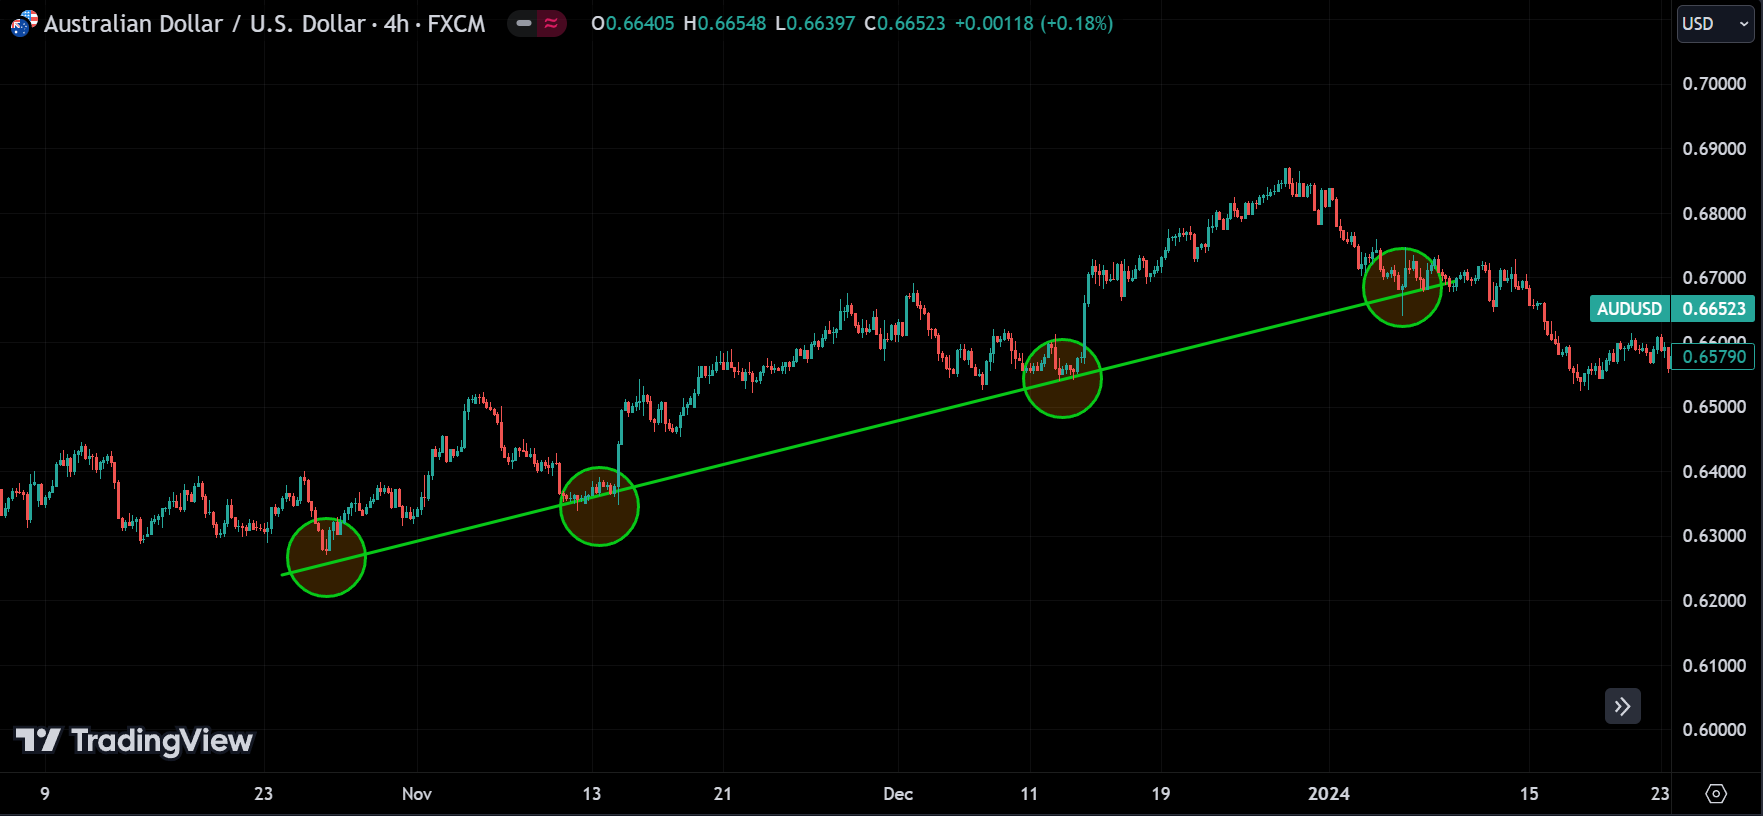
- Step 2: Extend the Line: Extend the trend line into the future to project potential support or resistance levels.
- Step 3: Adjust for Accuracy: Use multiple points to refine the trend line for greater accuracy. The more points a trend line touches, the more reliable it is considered.
Practical Application of Trend Lines
To illustrate the practical application of trend lines, consider the following example:
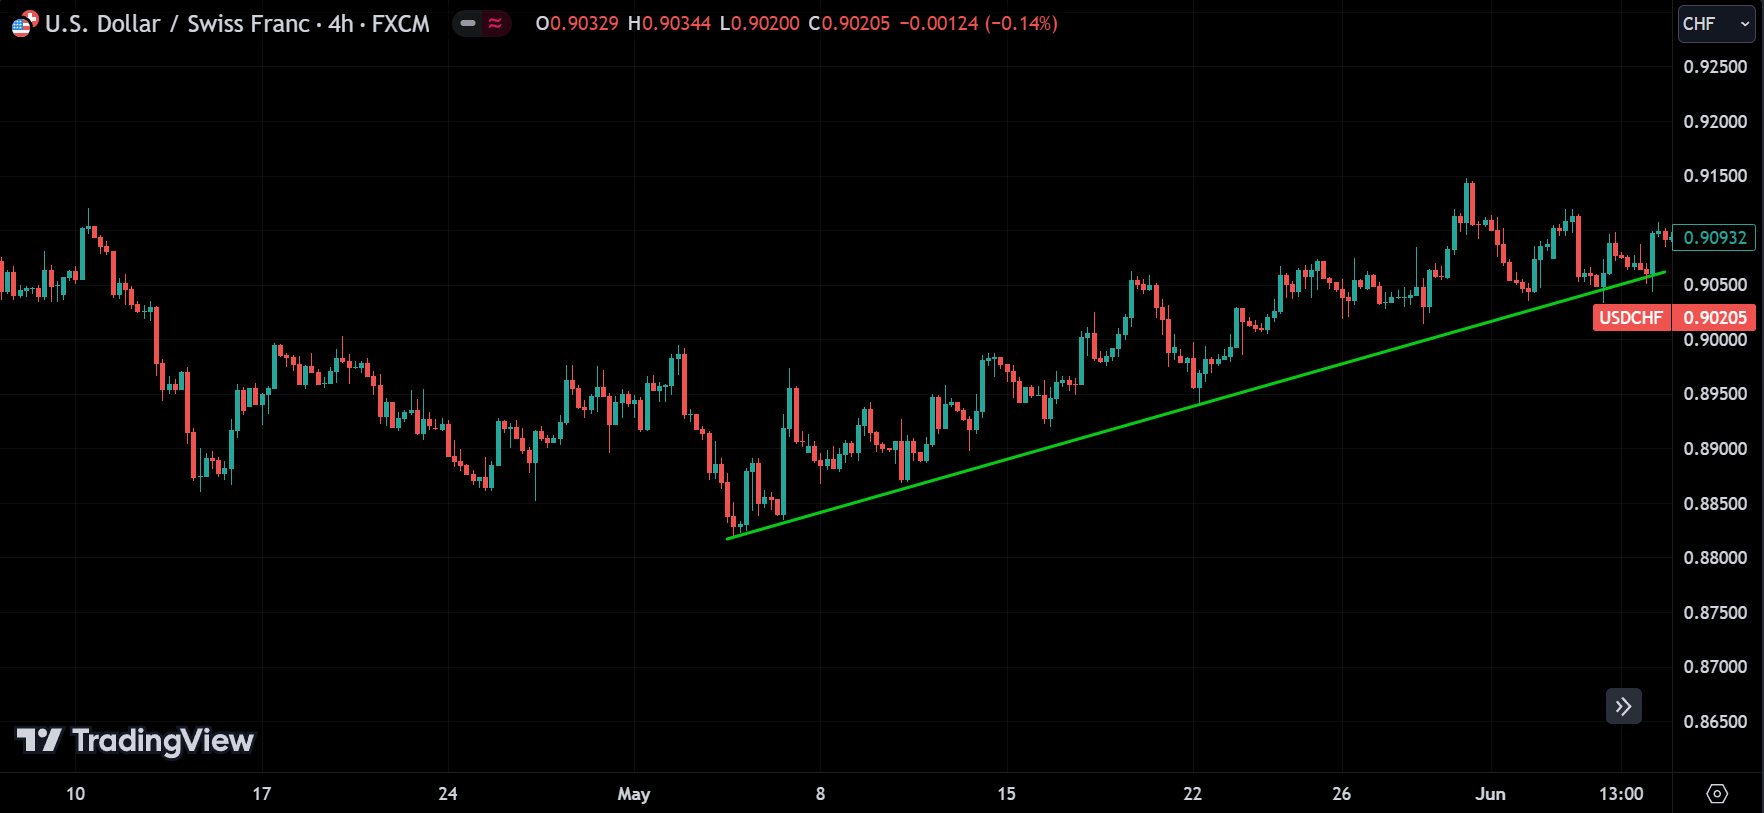
Identifying an Uptrend: On a daily chart of a forex pair, you notice the price has been making higher lows. You draw a trend line connecting these lows. The price consistently bounces off this trend line, confirming the uptrend.
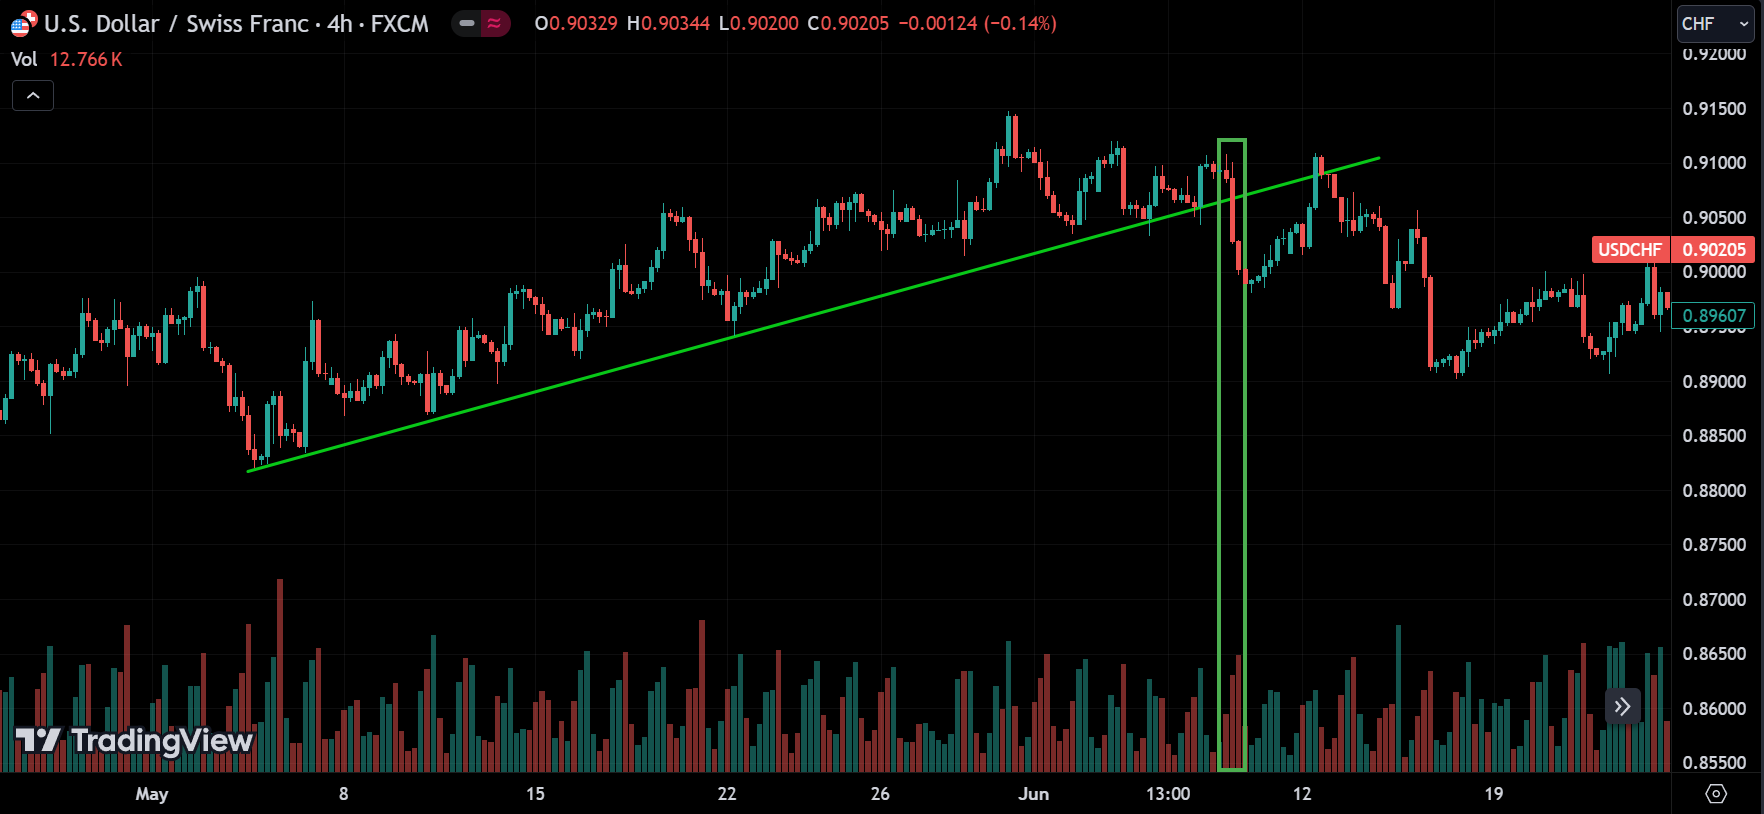
Monitoring for Reversals: As the price approaches the trend line again, you watch for a break below it. A decisive break with increased volume may indicate a trend reversal, signaling a potential sell opportunity.
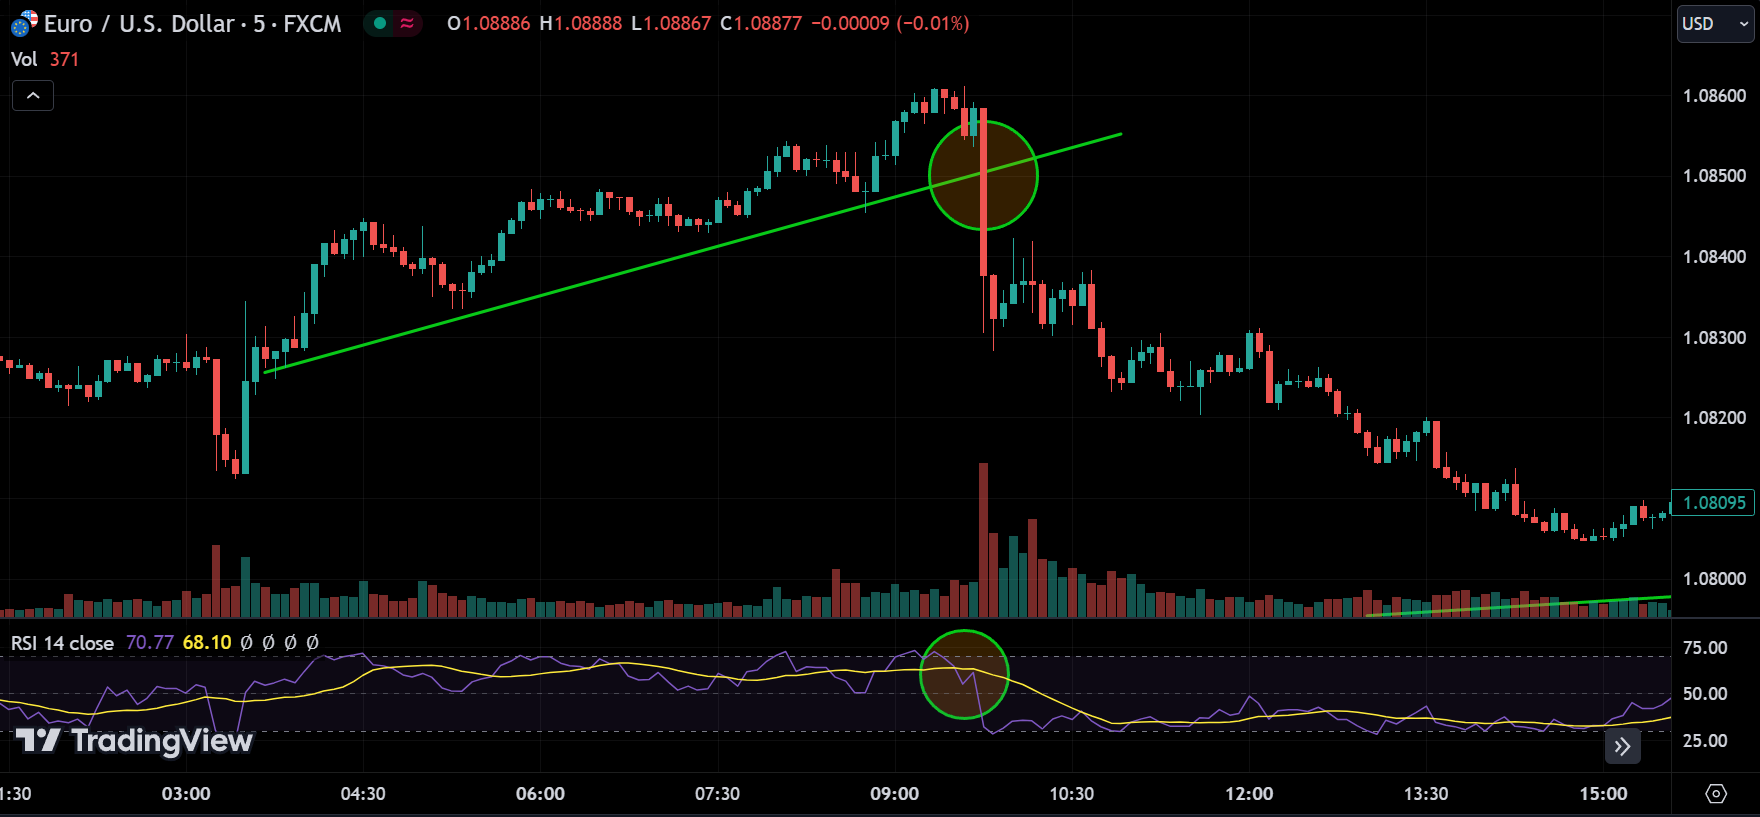
Combining Indicators: To strengthen your analysis, you integrate the trend line with an RSI indicator. When the RSI also indicates overbought conditions, the likelihood of a trend reversal increases.
Conclusion
Like with any other skill, practice makes perfect. TradingView offers free tools for everyone to analyze the markets. Be sure to make the most of them.
Trends and trend lines remain fundamental components of technical analysis, providing essential insights into market behavior. The ability to accurately identify trends and draw trend lines is crucial for traders and investors seeking to navigate financial markets effectively. While trends and trend lines alone cannot constitute a complete trading strategy, they play a vital role in determining the best entry and exit points within a broader strategy. By integrating these elements with other technical indicators and analysis tools, traders can enhance their decision-making process and improve their chances of success in the financial markets.