

If you trade anything related to the US dollar — whether that’s EUR/USD, gold, or even crude oil — you probably already know how important it is to keep an eye on where the dollar is heading. The problem? Most traders check the DXY on TradingView or some other platform, then switch back to MetaTrader to place their trades. It breaks your workflow.
That’s exactly why the Dollar Index (DXY) indicator exists for MT4 and MT5. It brings the entire DXY calculation right into your chart window, so you never have to leave your trading platform. In this guide, I’ll walk you through what this indicator actually does, how to set it up, and — more importantly — how to use it to get a real edge in your trades.
If you’re brand new to forex and not sure what any of this means yet, check out our What Is Forex Trading? guide first — then come back here.
Table of Contents
What Is the Dollar Index (DXY), and Why Should You Care?
Here’s the short version: the Dollar Index (DXY) tracks the US dollar’s strength against six other major currencies. It was created back in 1973 (right after the Bretton Woods system collapsed), and it’s been the go-to benchmark for dollar strength ever since. The Intercontinental Exchange (ICE) maintains it, and every institutional trader on the planet watches it.
The starting value was set at 100. So if DXY is trading at, say, 104 — the dollar is 4% stronger than that 1973 baseline. If it’s sitting at 96, the dollar has weakened.
Now, here’s what most people don’t realize — the DXY is heavily skewed toward the Euro. Like, really heavily. Take a look:
DXY Currency Basket & Weights
| Currency | Weight | Forex Pair |
|---|---|---|
| Euro (EUR) | 57.6% | EUR/USD |
| Japanese Yen (JPY) | 13.6% | USD/JPY |
| British Pound (GBP) | 11.9% | GBP/USD |
| Canadian Dollar (CAD) | 9.1% | USD/CAD |
| Swedish Krona (SEK) | 4.2% | USD/SEK |
| Swiss Franc (CHF) | 3.6% | USD/CHF |
Yeah — the Euro alone makes up nearly 58% of the entire index. That means whenever EUR/USD makes a big move, the DXY reacts almost immediately. Keep this in mind when you’re using the indicator. It’s not a perfect measure of “global” dollar strength — it’s really a measure of how the dollar is doing against mostly European currencies.
That said, it’s still incredibly useful. And since basically every major bank and hedge fund uses it as a reference, the DXY tends to become a self-fulfilling prophecy at key levels. If you want to understand how different currency pairs relate to each other, our Currency Pairs Correlation Indicator is another great tool to pair with the DXY.
How This Indicator Actually Works Inside MetaTrader
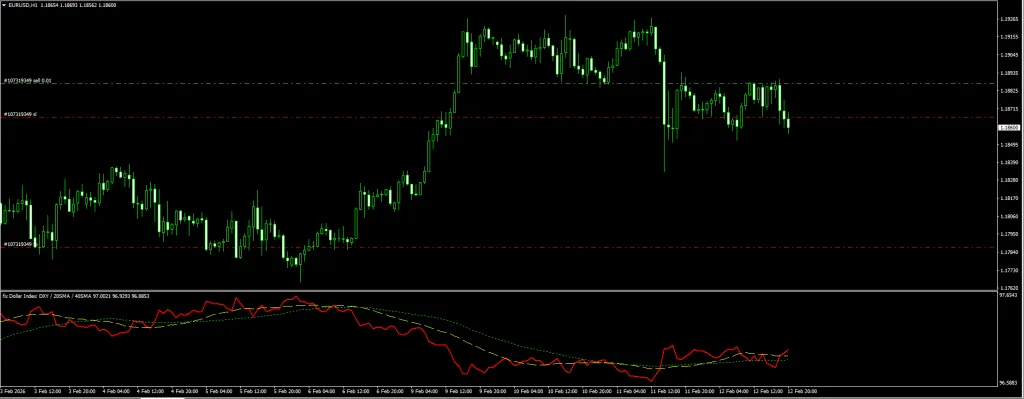
So here’s what happens behind the scenes: the indicator grabs live price data from all six currency pairs in the DXY basket (EUR/USD, USD/JPY, GBP/USD, USD/CAD, USD/SEK, USD/CHF), runs them through the weighted geometric mean formula that ICE uses, and plots the result as a line in a separate window below your chart.
You don’t need to open six charts. You don’t need to calculate anything manually. Just attach it to whatever chart you’re trading on, and you’ve got a live DXY feed right there.
What makes this version particularly useful is the built-in moving averages. The indicator comes with two SMAs overlaid on the DXY line — a fast one (default: 20 period) and a slow one (default: 40 period). This gives you an instant read on whether the dollar trend is accelerating, slowing down, or potentially reversing.
Here’s What You Get
- Live DXY value that updates tick-by-tick — no lag, no delay
- Two customizable moving averages for spotting trend changes and crossover signals
- Color-coded trend line so you can see at a glance whether USD is bullish or bearish
- Works on literally any chart — it calculates independently using the six DXY pairs, regardless of what pair you have open
- Clean sub-window display that doesn’t mess with your price action analysis
- Both MT4 and MT5 versions included in the download
If you’re looking for more trend-based indicators to combine with this, we’ve got a full collection worth checking out.


Download a Collection of Indicators, Courses, and EA for FREE
Indicator Settings : What to Tweak (and What to Leave Alone)
Honestly, the default settings work fine for most traders. But if you want to dial things in for your specific style, here are the parameters you can adjust:
| Setting | Default | What It Does |
|---|---|---|
| Short-Term SMA Period | 20 | Controls the fast moving average — lower values = more responsive, but noisier |
| Long-Term SMA Period | 40 | Controls the slow moving average — used for confirming the bigger trend |
| Lookback | 500 | How many candles the indicator uses for its calculation. If your chart looks blank on the left side, bump this up |
| Chart Theme | Dark | Switch between Light, Dark, or Custom to match your chart setup |
If you’re a scalper working on the M5 or M15, try dropping the SMA periods to 10 and 20 — you’ll catch trend shifts earlier. If scalping is your thing, you might also want to check out our best scalping strategies for some systems that pair well with the DXY filter. Swing traders on H4 or Daily should go the other direction: 30 and 60 gives you a smoother read that filters out the intraday noise.
Recommended Settings by Trading Style
| Your Style | Short SMA | Long SMA | Lookback |
|---|---|---|---|
| Scalping (M5–M15) | 10 | 20 | 300 |
| Day Trading (M30–H1) | 20 | 40 | 500 |
| Swing Trading (H4–Daily) | 30 | 60 | 800 |
Installation : Step by Step (MT4 & MT5)
This is pretty straightforward. I’ll cover both platforms since the process is almost identical. If you need a refresher on MetaTrader basics, our forex education hub has you covered.
For MT4:
- Download the indicator file (.ex4) from below
- In MT4, go to File → Open Data Folder
- Open the MQL4 → Indicators folder
- Drop the .ex4 file in there
- Go back to MT4, right-click in the Navigator panel and hit Refresh (or just restart the platform)
- Find “Dollar Index DXY” under your indicators list and drag it onto any chart
- This part is important: when the settings popup appears, click the “Common” tab and tick the box that says “Allow DLL imports”
- Hit OK and you’re good to go
Looking for more MT4-specific indicators? We’ve got hundreds available for free download.
For MT5:
- Download the MT5 version (.ex5)
- Go to File → Open Data Folder in MT5
- Navigate to MQL5 → Indicators
- Paste the file, refresh your Navigator, drag it onto a chart
- Same deal — make sure you enable DLL imports in the settings
We also have a growing library of MT5 indicators if you’re trading on the newer platform.
Quick heads up: The DLL imports thing isn’t optional. The indicator needs to pull data from six different currency pairs at once, which requires that permission. Without it turned on, the indicator just won’t load. I’ve seen traders struggle with this one thinking the indicator is broken — 9 times out of 10, it’s just the DLL setting.
How to Actually Use This in Your Trading
Alright, this is the part most indicator articles gloss over. The DXY on its own doesn’t give you “buy here, sell here” signals. What it gives you is something arguably more valuable — a directional bias for the US dollar. And once you know which way the dollar is likely heading, you can stack the odds in your favor on any USD pair.
The Correlation Playbook
This is the bread and butter of DXY trading. The concept is dead simple:
| When DXY Is… | EUR/USD, GBP/USD, AUD/USD, NZD/USD | USD/JPY, USD/CAD, USD/CHF |
|---|---|---|
| Going up (USD strong) | 📉 These tend to drop — look for sells | 📈 These tend to rise — look for buys |
| Going down (USD weak) | 📈 These tend to rise — look for buys | 📉 These tend to drop — look for sells |
So let’s say the DXY is in a clear uptrend on the H4 — the line is above both moving averages, and the fast MA just crossed above the slow MA. That tells you the dollar is gaining strength. Now you open your EUR/USD chart and start looking for sell setups. Maybe there’s a support & resistance level nearby with a rejection candle forming. That’s a high-probability trade because you’ve got the entire dollar flow working in your favor.
Without the DXY? You’re guessing. With it? You’ve got institutional-level context.
Using the Moving Average Crossover
The two built-in SMAs aren’t just for show. When the fast SMA (20) crosses above the slow SMA (40) on the DXY indicator, that’s an early warning that the dollar is starting to strengthen. These crossovers often happen before individual pairs make their big moves.
Here’s how I’d use it:
- Spot a bullish crossover on the DXY indicator (fast above slow)
- Switch to EUR/USD or GBP/USD
- Wait for your regular entry signal — could be an order block rejection, a chart pattern break, or a candlestick signal
- Enter the sell with more confidence because you know the dollar tide is turning
The key difference here: you’re not using the DXY crossover as a standalone entry signal. You’re using it as a filter. “Is the dollar getting stronger? Cool, then I only take sell setups on EUR/USD today.” That kind of discipline is what separates consistent traders from the rest.
If you’re interested in other crossover-based strategies, our Fibonacci Moving Averages strategy guide walks through a similar concept.
Watching for Divergences
This is a more advanced technique, but it’s worth learning because it catches some seriously good reversals.
Normally, if DXY goes up, EUR/USD should go down. They’re inversely correlated. But sometimes they don’t behave. The DXY pushes higher… and EUR/USD just sits there. Doesn’t drop. Maybe even creeps up a little.
That kind of divergence is a red flag. It usually means one of two things: either the DXY rally is running out of steam and is about to reverse, or EUR/USD is being propped up by something (like hawkish ECB expectations) and will eventually snap back into correlation.
Either way, it’s telling you that something is about to change. Pay attention to it. The TDI RT Divergence Indicator is another great tool for catching these kinds of divergence-based reversals.
What About Gold?
If you trade XAU/USD, this indicator is basically mandatory. Gold has one of the strongest inverse correlations with the dollar — when DXY goes up, gold almost always goes down, and vice versa. I’m not saying the correlation is 100% — nothing is — but it’s consistent enough to be a reliable filter for your gold entries.
Before entering a gold trade, just glance at the DXY window on your chart. Are you trying to buy gold while the DXY is in a strong uptrend? That’s fighting the current. Wait for DXY weakness before going long on gold — or at least be aware that you’re taking a counter-trend trade.
For automated gold trading, some traders pair DXY analysis with a scalping EA or even a specialized gold trading robot to execute once the DXY confirms direction.
Who Is This Indicator For?
Honestly, anyone who trades USD pairs will benefit. But here’s who I think gets the most out of it:
- EUR/USD and GBP/USD traders — These pairs are most sensitive to DXY moves, so the indicator’s value is immediate and obvious
- Gold traders — The inverse correlation makes the DXY practically a required tool for XAU/USD analysis
- Traders who follow fundamentals — If you trade around Fed meetings, NFP releases, or CPI data, the DXY shows you how the market is actually digesting the news in real time. Our forex market hours guide can help you time your sessions around these events
- Swing traders — The Daily and H4 DXY trends give you a clean directional bias for the entire week
- Anyone tired of checking TradingView separately — Having DXY right in your MT4/MT5 chart is a genuine quality-of-life upgrade
Not sure which trading strategy fits your style? Browse our complete strategy library and find one that works with the DXY filter.
The Good and the Not-So-Good
| ✅ What I Like | ❌ Keep in Mind |
|---|---|
| Real-time DXY right inside MetaTrader — no more tab switching | You need to enable DLL imports (minor inconvenience, but it trips people up) |
| Built-in MAs make trend reading instant | Your broker needs to have all 6 DXY currency pairs in their feed |
| Works on any pair, any timeframe | It’s not a signal indicator — won’t tell you “buy now” or “sell now” |
| Completely free | History is limited by the Lookback setting |
| Great for beginners and experienced traders alike | Heavy Euro weighting (57.6%) means it doesn’t fully capture USD strength against all currencies |
Download Dollar Index (DXY) Indicator – MT4 & MT5
Both versions are included. Just grab the one that matches your platform — or download both if you use MT4 and MT5.
📥 MT4 and MT5 Version
Mirror Download Dollar Index Indicator
Works with: MetaTrader 4 (Build 600+) and MetaTrader 5. Compatible with any broker that provides EUR/USD, USD/JPY, GBP/USD, USD/CAD, USD/SEK, and USD/CHF data feeds.
You Might Also Like
- Currency Pairs Correlation Indicator – Free Download
- ForexCracked Trend Breath Indicator for MT4
- Wave Trend Oscillator – Strategy & Free Download
- Ultimate Forex Indicators Guide: How to Read & Combine Them
- SuperTrend Strategy for MT4/MT5
- Forex EA vs Manual Trading – Which Wins?
- Best Forex Breakout Strategies
Frequently Asked Questions
What exactly is the Dollar Index (DXY)?
It’s a benchmark that measures the US dollar against six other currencies: the Euro (which makes up a massive 57.6%), the Japanese Yen, British Pound, Canadian Dollar, Swedish Krona, and Swiss Franc. It was created in 1973 with a base value of 100, and it’s still the most widely used measure of dollar strength in the world.
How does the DXY indicator help me trade better?
Think of it as a compass for the dollar. If DXY is trending up, that tells you the dollar is getting stronger — which means pairs like EUR/USD and GBP/USD are likely heading down, while USD/JPY and USD/CAD are probably going up. It gives you a directional bias so you’re not trading blind.
Does it work on every timeframe?
Yep. M1 all the way up to Monthly. Though realistically, you’ll get the most useful signals on M15 and above. M1 and M5 tend to be noisy on any indicator, and the DXY is no exception.
Why does EUR/USD move in the opposite direction of DXY?
Because the Euro is 57.6% of the DXY basket — by far the largest component. So when the dollar strengthens and DXY goes up, EUR/USD mechanically drops. They’re basically mirror images of each other most of the time.
Can I use this for gold (XAU/USD) trading?
Absolutely, and I’d actually say gold traders should consider this indicator essential. Gold and the dollar have a well-documented inverse correlation — when the DXY rallies, gold usually drops. Using this indicator as a filter before entering gold trades can save you from a lot of counter-trend losses.
The indicator won’t load — what’s wrong?
Almost certainly a DLL imports issue. Go to the indicator settings, click the “Common” tab, and make sure “Allow DLL imports” is checked. The indicator needs this permission because it’s pulling data from six different currency pairs at once. Without it enabled, MetaTrader blocks the indicator from working.
Is this indicator free?
Yes, completely free. Both the MT4 and MT5 versions are available for download with no subscription, no trial period, and no hidden upsells.
What’s the difference between DXY and currency strength meters?
The DXY measures the dollar against a fixed basket of 6 currencies with set weights. A currency strength meter compares all currencies against each other in real time. The DXY is better for tracking the dollar specifically, while strength meters give a broader view of all 8 major currencies.