
Grid & Martingale Strategy Safe Forex Trading
Every experienced forex trader knows the sinking feeling: you are in a drawdown, the market is moving against you, and...
Master the markets with our collection of proven forex trading strategies for MetaTrader 4 and MT5. Each strategy includes detailed guides, chart examples, and free indicator downloads. From scalping to swing trading, breakout entries to reversal setups — find a strategy that fits your trading style.
Browse by Strategy Type:
| Strategy | Type | Timeframe | Best For |
|---|---|---|---|
| RSI Trend Catcher | Trend Following | H1 – Daily | Catching Trends Early |
| MTF Reversal Scalping | Scalping + Reversal | M5 – M15 | Quick Reversals |
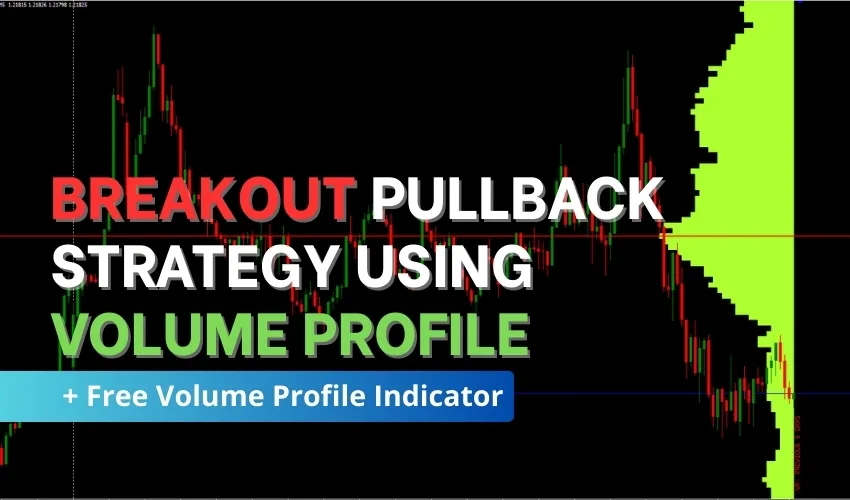
| Breakout Pullback (Volume) | Breakout | H1 – H4 | Breakout Entries |
| Smart Money Order Block | ICT / SMC | M15 – H4 | Institutional Trading |
| Prop Firm Strategies | Multi-Strategy | All | Funded Accounts |
💡 Pro Tip: New to trading? Start with the RSI Trend Catcher Strategy — it’s simple, rule-based, and works on higher timeframes where signals are more reliable.
252 posts found
![Forex Gladiator – Non-Repaint Indicator That Trades for You [Sale – 20% OFF]](https://www.forexcracked.com/wp-content/uploads/2026/03/Non-Repaint-Indicator-That-Trades-for-You-sale-ForexCracked.com_.jpg.webp)


Trend following strategies are the best starting point for beginners. They follow the market's direction rather than trying to predict reversals, which reduces complexity. Start with a simple moving average crossover or the RSI Trend Catcher strategy on H1 or H4 timeframes. Avoid scalping until you have more experience with market mechanics.
Scalping aims to capture small, quick profits from 5–20 pip moves on lower timeframes (M1–M15), with trades lasting minutes. Swing trading targets larger moves of 50–200+ pips on higher timeframes (H4–Daily), with trades lasting days or weeks. Scalping requires more screen time and fast execution, while swing trading is more suitable for traders with limited time.
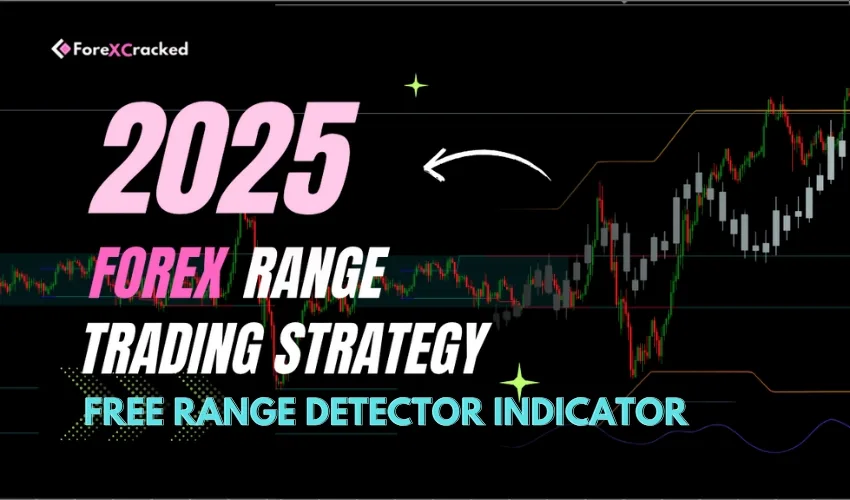
Most strategies work across all major and cross pairs, but performance varies. Trend following strategies work best on trending pairs like EUR/USD and GBP/USD. Range trading strategies suit range-bound pairs like EUR/CHF. Breakout strategies work best during high-volatility sessions. Always backtest a strategy on your preferred pair before trading it live.
Yes. Many strategies here are suitable for prop firm challenges. Key requirements for prop trading are: consistent risk management (1-2% per trade), avoiding martingale or grid approaches, and maintaining steady equity growth. Our Prop Firm Strategies guide covers specific approaches designed for funded account challenges.
Consider three factors: (1) Your available time — scalping needs full-time attention, swing trading doesn't. (2) Your risk tolerance — aggressive strategies like breakout trading have higher risk/reward, while trend following is steadier. (3) Your experience level — beginners should start with trend following on higher timeframes before attempting complex methods like harmonic patterns or ICT concepts.