

You’ve stared at that resistance for hours. Suddenly, price punches through, adrenaline surges, and you hit “Buy.”… Two candles later, EURUSD is right back below the line, taking a slice of your account with it. The pain usually comes from skipping the second half of the equation: You traded the breakout but ignored the retest.
A breakout only says something changed; the retest reveals whether that change is real. Waiting for price to “kiss” the broken level filters out most fake moves, puts you in sync with institutional order flow, and can double your reward‑to‑risk, provided you have the patience to watch dozens of charts and the discipline to strike only when confirmation appears.
Patience is psychological; chart monitoring can be automated. In this step‑by‑step guide, you’ll learn how to trade breakout and retest setups with confidence:
- The market logic that makes the breakout‑retest pattern so reliable
- Simple chart‑marking rules that keep your support and resistance levels squeaky‑clean
- Precise entry, stop‑loss, and take‑profit triggers you can copy today
- Risk‑management math that protects capital even during losing streaks
- A free MT4 indicator that scans 24/5, flags A‑grade breakout & retest patterns, and pings you the moment they form
By the end, you’ll walk away with a repeatable playbook and a lightweight tool to handle the boring scanning, so you can focus on executing high‑probability trades instead of chasing every spike. Ready? Let’s break down the breakout and retest, one step at a time.
Table of Contents
What Is a Breakout–Retest Strategy?
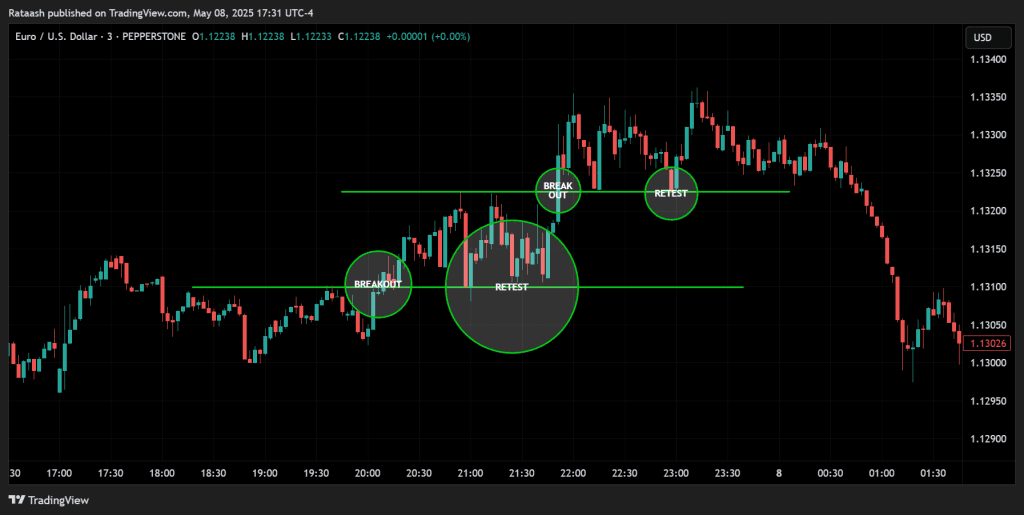
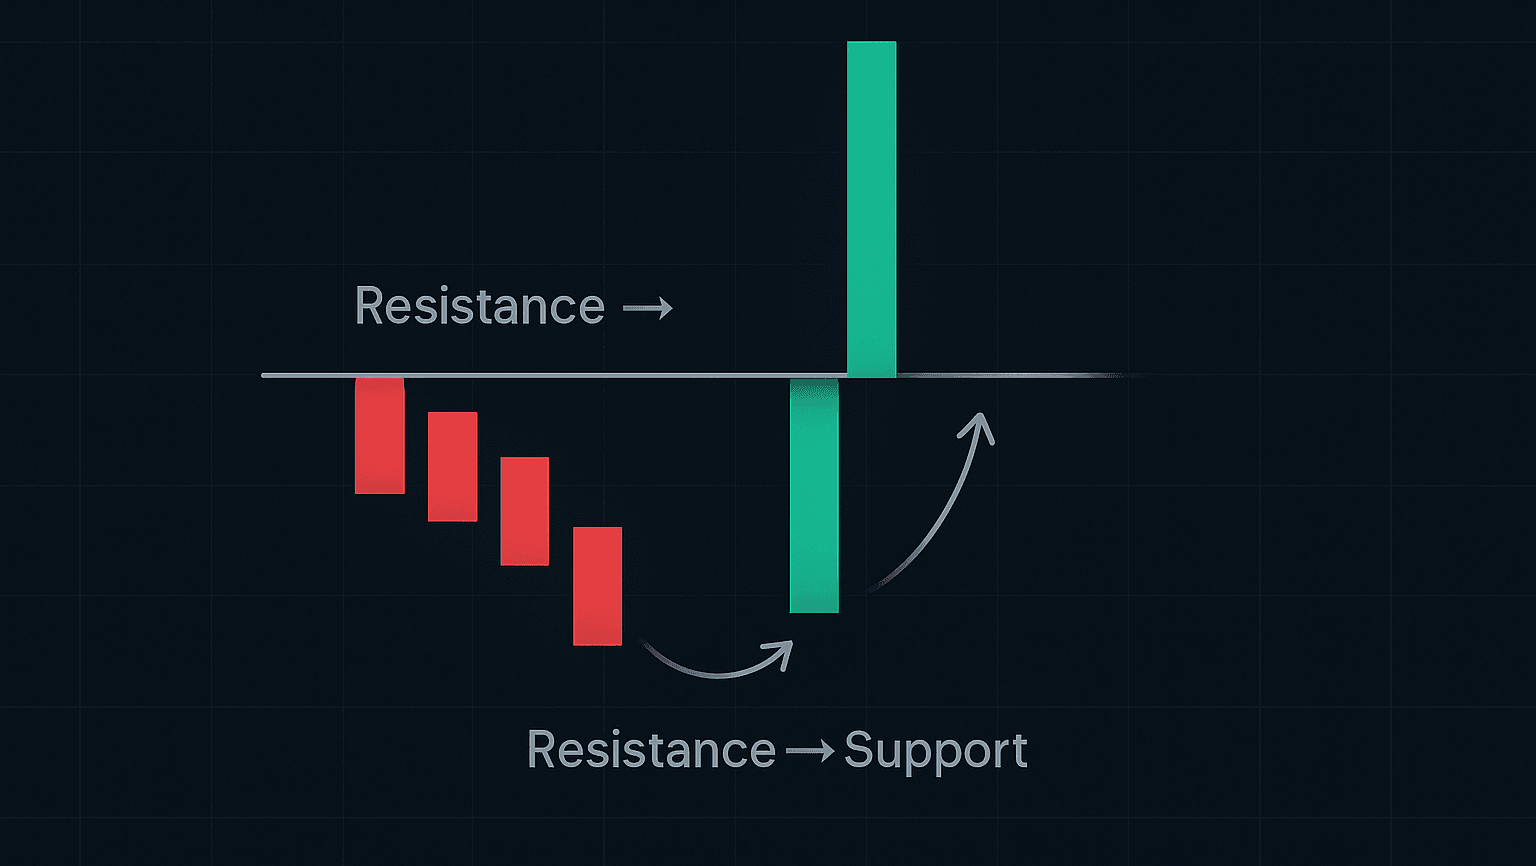
A breakout occurs when price closes beyond an established support or resistance zone. A retest follows when price pulls back to that same zone now flipped in role and then resumes in the breakout direction. The retest acts like a handshake between buyers and sellers, confirming that supply or demand has genuinely shifted and flushing out weak hands who took the first impulsive entry.
Why the Retest Matters
- Filters fakeouts – Most false moves reverse within a few candles because there isn’t enough participation to drive continuation. Waiting for the pullback weeds out head‑fakes and “bull/bear traps.”
- Offers precision entries – Entering near the retested level lets you hide your stop a handful of pips behind structure instead of dozens behind the breakout candle’s tail.
- Improves risk‑to‑reward – Smaller stops mean you need less distance to target a 2R or 3R profit.
- Shows clear market intent – The retest is where trapped traders exit or reverse, adding fuel for the next leg. Momentum often accelerates after that liquidity injection.
Strategy Foundations
Before charts and checklists, set two ground rules:
- Higher‑time‑frame bias first – Map daily or 4‑hour structure; only trade setups that agree with that bias.
- One risk unit per idea – Commit a maximum of 1 %–2 % of equity to a single trade. Survive long enough to win big.
Pick the Right Market Conditions
- Clear ranges or compression patterns (triangles, flags).
- High‑volatility pairs or indices (e.g., GBPJPY, XAUUSD, NAS100) because they tend to break and run.
- Session overlap – London and New York hours deliver the volume to push through levels.
- Avoid major news releases unless you are experienced; spikes distort the retest logic.
Time‑Frame Mapping
| Purpose | Suggested TF |
|---|---|
| Macro trend & level selection | D1 / H4 |
| Entry signal & trade management | H1 / M15 |
Hopping lower than M15 invites whipsaw unless you’re scalping; stick to clarity over excitement.
Marking Key Levels
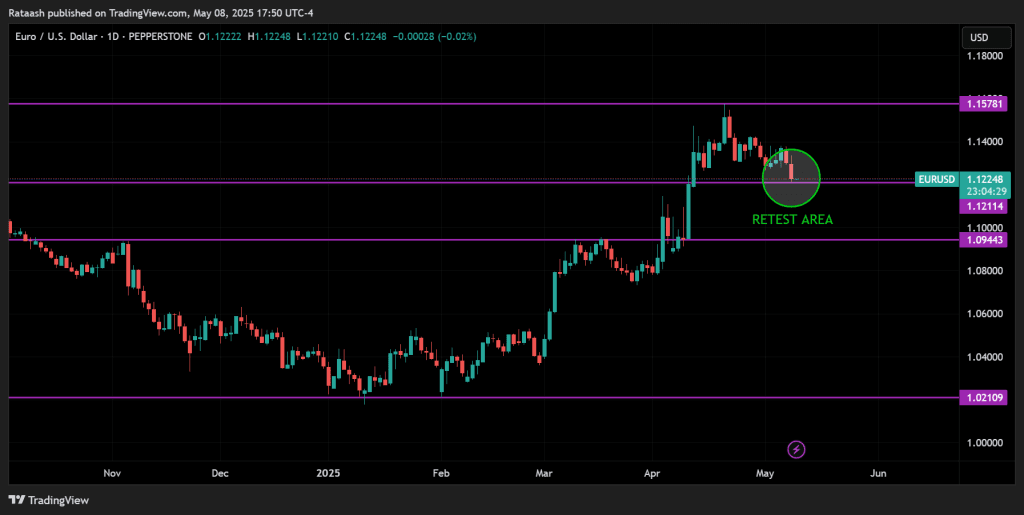
- Zoom out to D1 and draw horizontal zones on swing highs/lows that have at least two touches.
- Refine on H4 – adjust to account for candle bodies more than wicks; bodies represent consensual value.
- Snap a line or zone a few pips thick; don’t obsess over pixel‑perfect placement—markets see areas, not razor edges.
- Label the level (e.g., “EU‑D1‑Res‑1.1000”) so you remember why it matters.
Tip: Fewer, more obvious zones beat clutter. If you can’t spot a level in three seconds, neither can the algos that move price.
Step‑by‑Step Trade Setup
Step 1 | Wait for the Break

Price closes beyond the level with a full‑body candle.
Ignore shallow pierces or wick‑only breaks; they’re bait for breakout chasers. Identify a candle whose body finishes entirely on the other side of the zone. Volume upticks on the break add conviction.
Step 2 | Watch for the Retest

Price pulls back and touches or slightly pierces the flipped level. Common patterns:
- Pin bar/hammer with a long rejection wick
- Bullish/bearish engulfing candle at the level
- Inside bar break on the following candle
Any of these shows commitment by the side now in control.
Step 3 | Enter on Confirmation

Two common triggers:
- Aggressive: Market order as soon as the retest candle closes against the level (tightest stops).
- Conservative: Set a stop order a couple of pips beyond the retest candle’s high/low in the breakout direction (filters second retest scenarios).
Step 4 | Place Stop‑Loss

- Structure‑based: 3‑5 pips (or 0.2 × ATR) beyond the rejection wick.
- Volatility‑based: 1 × ATR(14) beyond the level if market is choppy.
Step 5 | Set Profit Targets

- TP1: Equal to risk distance (1R) – move stop to break‑even here.
- TP2: Next higher‑time‑frame level or 2R.
- Trailer: For runners, trail stop one candle behind each new swing.
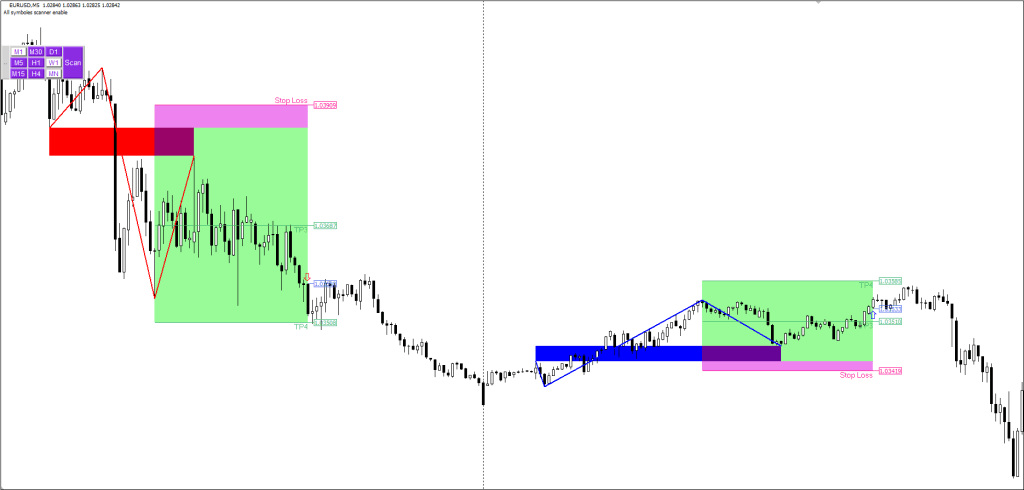
Here is an example (EURUSD H1)
Resistance at 1.1000 marked on D1.
- 10:00 London candle closes at 1.1014 – solid breakout.
- Price retraces to exactly 1.1000; 13:00 pin‑bar prints with 15‑pip wick.
- Entry long at 1.1016 as next candle breaks pin‑bar high.
- Stop under wick at 1.0997 (19 pips).
- TP1 at 1.1035 (1R) hit in 30 min; TP2 at 1.1073 (3R) hit by NY open.
Same playbook, different day.
Risk Management – The 2 % Lifeline
Risk is the only variable you completely control. Here’s the distilled math:
- Determine account risk per trade: 1 % for beginners, 2 % maximum.
- Measure trade risk: pips between entry and stop.
- Calculate position size:
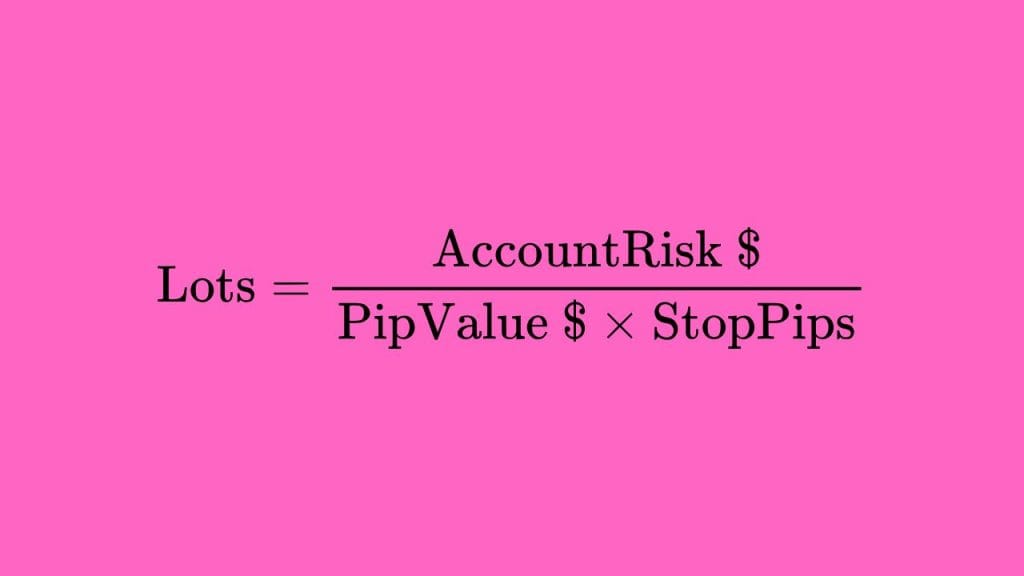
Example: $10 000 account, 1 % risk ($100), EURUSD (pip = $10/standard lot), 20‑pip stop → 0.5 lot.
Position sizing calculators make this a 10‑second task.
Equity Curve Reality Check
Even a 60 % win rate with 2R reward can suffer a streak of eight losses in 100 trades; that’s –16 R. At 1 % risk per trade you’re down 16 % painful but recoverable. At 5 % risk you’re out of the game. Survive first, thrive later.


Download a Collection of Indicators, Courses, and EA for FREE
Common Pitfalls
| Pitfall | Fix |
|---|---|
| Entering on the first poke above a level | Wait for candle close + retest |
| Drawing micro levels everywhere | Focus on swing highs/lows that halted price twice or more |
| Ignoring session context | Trade during liquid sessions; skip Asian drift unless pair is JPY‑centric |
| Moving stop to break‑even too soon | Let price clear 1R first; premature stop hunts are real |
| Oversizing because signal “looks perfect” | Stick to fixed % risk; edge shows over series, not one trade |
Turbo Charging the Strategy – Your “Simple MT4 Boost”
Watching 28 pairs × 6 time‑frames is soul‑crushing; an auto breakout indicator can help. Enter the Breakout & Retest Scanner, a free MT4 indicator that automates the hunt.
What the Scanner Does
- Algorithmic pattern recognition – Scans chosen symbols/TFs for candles that close beyond defined support/resistance and flags the subsequent retest pattern.
- Real‑time alerts – Pop‑ups, sound, email, or push notifications let you step away from screens.
- Built‑in trade map – Suggests entry, stop, and target zones based on candle geometry.
- One‑click UI – Hit the Scan button, and a dashboard lists all current opportunities by pair and timeframe, green for bullish, red for bearish.
Why it helps: You still make every trading decision, but the bot filters noise and time‑wasting chart surfing. Think of it as hiring a 24‑hour intern who only taps you on the shoulder when your exact setup appears.
Grab Your Free Scanner
Ready to let software watch the levels so you can focus on execution? Download the free MT4 Breakout & Retest Scanner and bolt it onto the strategy you’re learning here.
Installation Guide
- Download & copy the
.ex4file into…/MQL4/Indicators/. - Restart or refresh MT4; find “Breakout‑Retest Scanner” in Navigator.
- Drag‑drop onto any chart.
- Select pairs & time‑frames in the inputs (default scans majors on H1/H4/D1).
- Activate alerts – choose pop‑up, email, mobile, or all three.
Tuning Parameters
- BodyMinPercent – minimum % of candle body beyond the level (filters wicky breaks).
- RetestLookback – how many candles to allow for the pullback (3–5 typical).
- AlertOnCloseOnly – avoids intra‑candle noise; set true for clarity.
- ATRMultiplierSL – auto‑sets SL at X × ATR; 1.0–1.5 suits most majors.
Spend an evening in demo adjusting settings to match your chart style.
Advanced Optimizations – Squeezing More Edge from the Same Setup
Once you’re reliably profitable with the vanilla breakout‑and‑retest play, resist the urge to add random indicators. Instead, layer one enhancement at a time, benchmark it for 30 trades, then keep it only if the expectancy improves. Below are five proven tweaks that price action traders bolt on to refine entries, increase win‑rate, or smooth their equity curves.
1. Volume Confirmation
A breakout backed by a surge in participation is far likelier to run than one that slips through on thin liquidity.
- How to apply:
- Plot tick volume (MT4’s green/red bars) or On‑Balance‑Volume (OBV) under your chart.
- Require the breakout candle volume to print above the 20‑bar average or register a clear OBV spike.
- Skip trades where price closes beyond the level but volume is muted these often turn into fades or stop‑hunts.
- Why it helps: confirms that real money not just algos hunting stops is behind the move, filtering 10‑15 % of weak signals.
2. Session Bias Overlay
Market sentiment shifts with geography and news flow; trading in sync with the most active session avoids aimless drift.
- Rule of thumb:
- Buy setups only if they trigger during London–New York overlap and the daily candle is already green (bearish criteria reversed for sells).
- Mark the overlap (≈ 12 GMT to 16 GMT) with a soft background shade on your chart to see at a glance whether a signal qualifies.
- Edge gained: aligning intraday entries with the dominant daily bias shaves down false reversals and prevents taking longs in a broader daily down‑move.
3. ATR‑Based Targets
Static take‑profits ignore volatility regimes; ADR60 on EURUSD can swing from 50 pips in summer to 100 pips in crisis.
- Implementation:
- Calculate ATR(14) on the trade’s time‑frame.
- Set TP1 = Entry + 1 × ATR, TP2 = Entry + 1.5 × ATR (mirror for shorts).
- Keep the same structure‑based stop; only the targets float.
- Benefit: maintains a roughly constant time‑in‑trade across different market conditions and sidelines you when volatility is too cramped to justify a decent R‑multiple.
4. Multi‑Time‑Frame Trend Filter
The lower the time‑frame, the noisier the chart. A simple higher‑time‑frame filter can turn 55 % accuracy into 65 %+.
- Quick setup:
- Plot a 20‑EMA on D1.
- Only take H1 longs if that EMA is sloping up and price is above it (and vice‑versa for shorts).
- Review once per day no need to clutter your intraday screen.
- Why it works: the filter removes counter‑trend trades that often stall after 10–15 pips, converting marginal wins into graceful skips.
5. Partial Profit Scaling
Cognitive bias makes holding winners harder than cutting losers. Locking in something early keeps emotions quiet.
- Process:
- Bank 50 % of the position at 1 R (or at the ATR‑based TP1).
- Slide the stop to break‑even plus a pip.
- Trail the remainder behind each new swing low/high or an EMA until TP2 or a reversal tag‑out.
- Psychological edge: removes the “all‑or‑nothing” stress, letting you obey the original plan instead of bailing too soon.
Bottom line: every add‑on prunes a slice of trade frequency but boosts expectancy by either lifting average R‑return or trimming avoidable losses. Test them incrementally, document results, and keep the blend that best suits your temperament and account goals.
Frequently Asked Questions
u003cstrongu003eDoes every breakout retest?u003c/strongu003e
No. Around a third of clean breaks run without looking back. We accept missing those to avoid the higher percentage of fakeouts that do retest. Strategy edge lies in selectivity, not FOMO.
u003cstrongu003eWhich pairs respect retests the best?u003c/strongu003e
Majors with deep liquidity (EURUSD, GBPUSD, USDJPY) and high‑beta crosses (GBPNZD) show crisp reactions. Exotic pairs can work but widen spreads and warp risk maths.
u003cstrongu003eIs the scanner non‑repaint?u003c/strongu003e
Yes. Signals are fixed after candle close; the indicator does not retro‑paint arrows or dashboards.
Hu003cstrongu003eu003cstrongu003eow many trades per week can I expect?u003c/strongu003eu003c/strongu003e
Scanning 10 majors on H1/H4 typically yields 6–12 qualified setups. Filter by higher‑time‑frame bias and you’ll take 2–5 live trades—a sweet spot for focus and review.
u003cstrongu003eCan I swing‑trade this on Daily charts?u003c/strongu003e
Absolutely. Use the same logic; widen stops and expect multi‑day holds. Position size shrinks, but pip profit expands.
Putting It All Together
Trading success rarely comes from complex indicators or exotic math; it’s born from simple concepts executed with military consistency. The Breakout & Retest Strategy is as old as technical analysis itself, yet it remains one of the clearest visual representations of market psychology: a barrier breaks, skeptics test it, and when it holds, a new trend marches on.
Your action plan:
- Back‑test the rule set on 50 historical trades.
- Demo‑trade live market conditions for 20 trades; journal results.
- Refine your entry trigger or SL placement if win‑rate < 50 % at 2R.
- Add the MT4 scanner to eliminate manual scanning toil.
- Go live with 1 % risk and scale only after 30 trades prove your edge.
Key Takeaways
- Breakouts alone are unreliable; the retest is where edge lives.
- Structure‑based stops and 2R+ targets skew payoff in your favour.
- 1 %–2 % risk per trade keeps drawdowns survivable.
- Technology can scan dozens of charts for textbook patterns so you don’t have to.
- Patience, journaling, and incremental improvement turn a good blueprint into a profitable reality.
Trade safe, test thoroughly, and let the market confirm its intentions before you commit capital. When you combine disciplined price‑action reading with a smart scanner as your lookout, breakout trading transforms from a gamble into a calculated, repeatable play.
Happy trading, and may your next retest be the springboard to your biggest winner yet.