

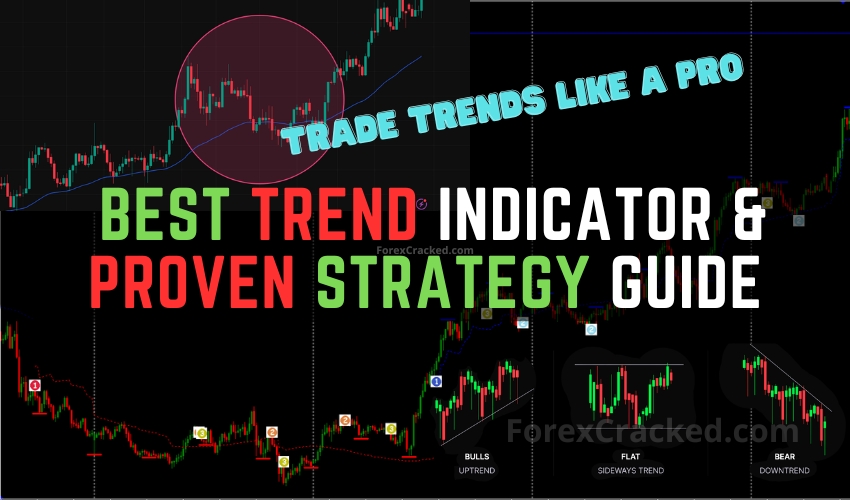
If you ask most consistently profitable traders how they make their money, you’ll hear the same thing:
They follow the trend.
Forex Trends trading works because the market spends most of its time moving in waves. Catching those waves riding the momentum means you’re flowing with the big money, not fighting it. But how do you actually do it without a PhD in chart reading or dozens of screens?
This guide breaks it all down with a step-by-step, beginner friendly forex trend trading strategy that just works proving that simple strategies like the ZigZag WS Channel often deliver the most positive results when optimized and followed correctly.
And if you want an edge, I’ll even show you a bonus free indicator at the end that does a lot of the hard work for you.
Table of Contents
What Makes a Trend, and Why Should You Care?
Before you can trade trends successfully, you need to recognize what a trend actually is and why it matters for your trading results.
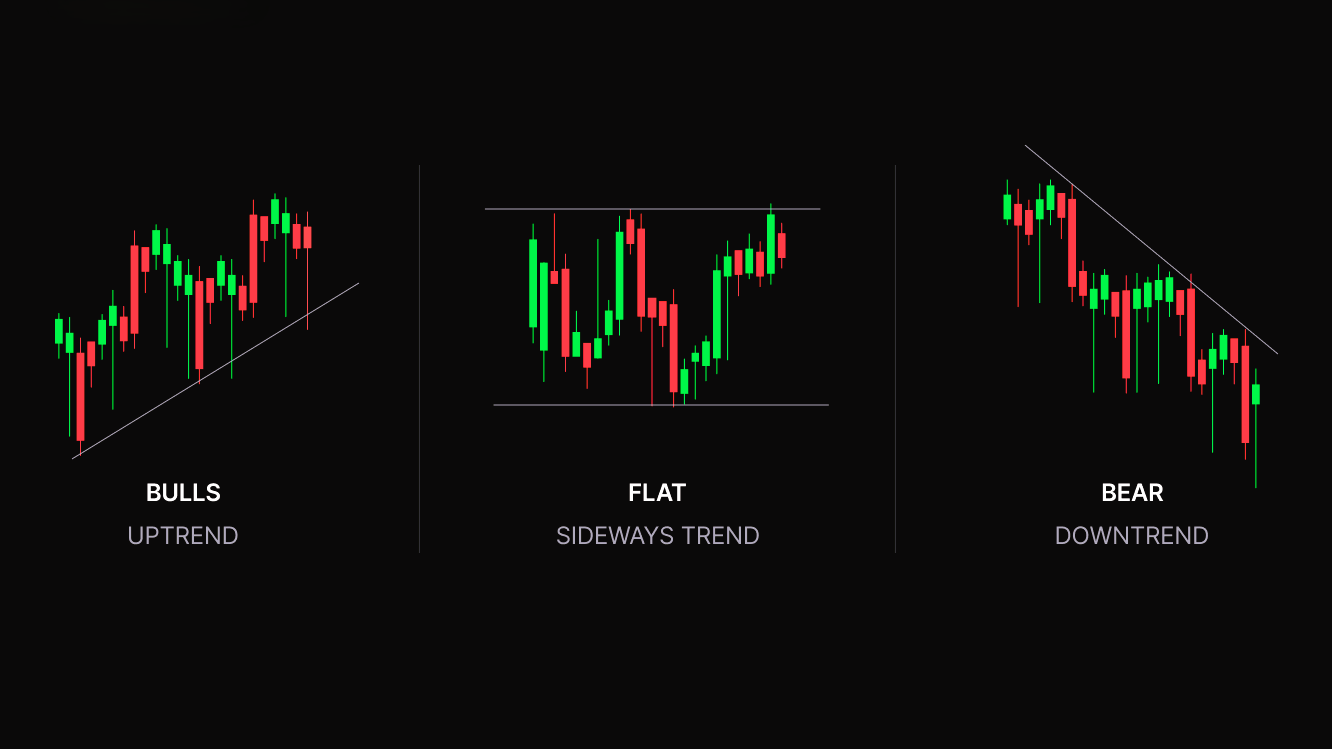
A trend in forex simply means price is moving consistently in one direction over time.
- Uptrend: The market is moving higher, creating a pattern of “higher highs” (each peak is above the last) and “higher lows” (each dip is higher than the previous one).
- Downtrend: The market is moving lower, forming “lower lows” (each bottom is lower than the last) and “lower highs” (each bounce is weaker than before).
If the price isn’t making clear new highs or new lows and just moves sideways in a tight range that’s called a sideways or choppy market. It’s best to avoid trading in these conditions, as trends are weak or non-existent.
Why does this matter?
Trends show you the path of least resistance the direction where buyers or sellers are winning.
- Trading with the trend puts the odds on your side, letting you ride the momentum instead of fighting it.
- Trends can last for hours, days, or even weeks, creating multiple opportunities for consistent profits if you know how to spot and join them.
The goal isn’t to predict the exact top or bottom, but to jump in once the trend is clear and ride it for as long as it lasts. This approach avoids unnecessary guessing and keeps you flowing with the market’s natural movement, not against it.
Step-by-Step Forex Trend Trading Strategy
Ready to trade forex trends with confidence? Here’s a proven, easy to follow strategy you can use with almost any major forex pair. Whether you’re trading the 1-hour, 4-hour, or daily chart, this approach is built for real world conditions and real traders no complicated stuff, just what works.
1. Pick the Right Market and Timeframe

Start with the strongest foundation your market and timeframe.
- Focus on major forex pairs like EURUSD, GBPUSD, USDJPY, and AUDUSD. These pairs usually have the tightest spreads and the cleanest, most reliable trends.
- Choose your timeframe based on your lifestyle:
- 1H (1-hour) charts for active traders or those who can check the market a few times a day.
- 4H (4-hour) charts for swing traders who want fewer, higher-quality signals.
- Daily charts if you prefer a slower pace and minimal screen time.
- Avoid trading during major news releases (like NFP or central bank announcements). High impact news can spike volatility and ruin even the best trend setups.
2. Spot the Trend
Identifying a genuine trend is the secret sauce of this strategy.
- For an uptrend – Look for price making at least two higher highs and two higher lows.
- For a downtrend – Look for at least two lower lows and two lower highs.
- Don’t overcomplicate it you can spot this just by looking at the chart.
Bonus Tool:
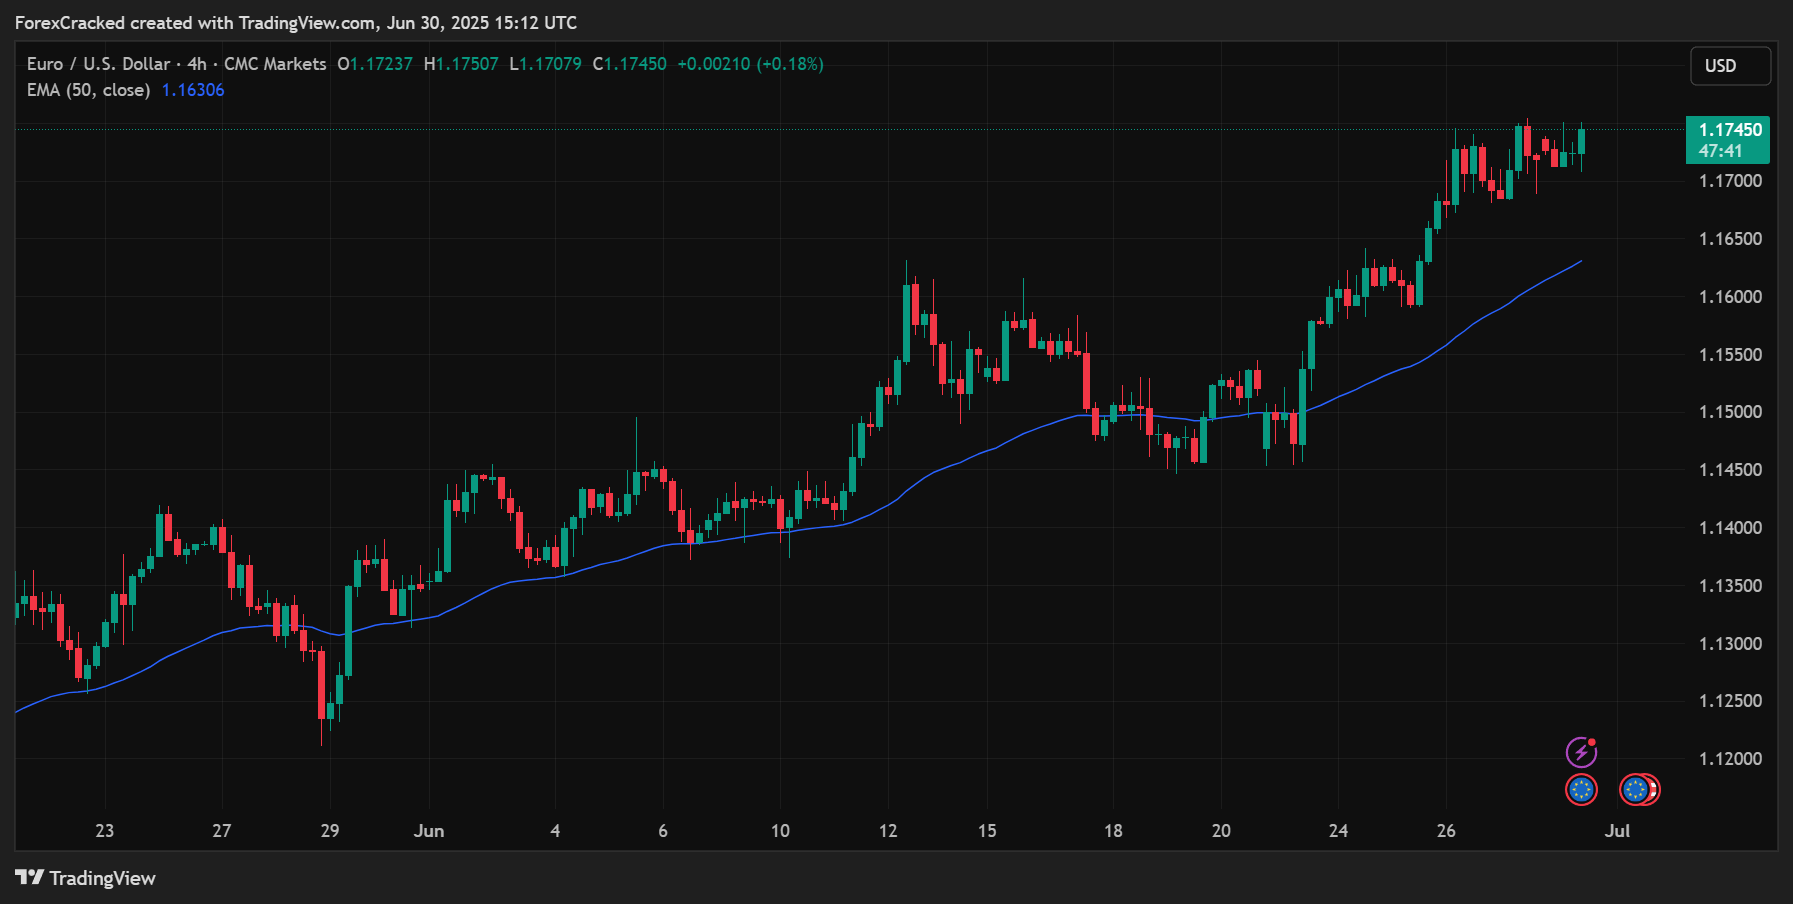
- Add a 50-period Exponential Moving Average (EMA) to your chart.
- If price is consistently above the 50 EMA, focus on buying opportunities.
- If price is below the 50 EMA, look for selling setups.
This moving average acts as a dynamic trend filter and helps you quickly confirm the market direction.
3. Wait for the Pullback Don’t Chase the Move!
Patience pays. The best entries come to you.
- Once you spot a clear trend, resist the urge to jump in immediately.
- Wait for price to pull back either to the 50 EMA or to a key support (in uptrends) or resistance (in downtrends) zone.
- Pullbacks are often where smart money enters and where you’ll get the best reward-to-risk setups.
- Remember: Most losing traders chase. Winning traders wait.
4. Look for Confirmation Before Entering
Don’t guess let the chart confirm your entry.
- Candlestick confirmation:
- In an uptrend, look for a bullish engulfing candle or a strong bullish bar at the pullback area.
- In a downtrend, look for a bearish engulfing candle or a decisive bearish bar at the resistance zone.
- EMA “respect”:
- Notice how price reacts to the 50 EMA or your chosen support/resistance level. If price bounces off cleanly, that’s a strong sign.
- Momentum filter (optional):
- Add the Relative Strength Index (RSI). In an uptrend, RSI crossing above 40 adds extra confidence; in a downtrend, RSI below 60 helps confirm weakness.
5. Enter the Trade (With Risk in Mind)
Once you’ve got your setup, it’s time to take action.
- Entry: Buy or sell at the close of your confirmation candle.
- Stop-loss: Always protect yourself.
- For buys, place your stop-loss just below the most recent swing low.
- For sells, put it just above the most recent swing high.
- Take-profit:
- Aim for at least 2 times your stop-loss distance for a strong risk/reward ratio.
- Or, use the next clear resistance (for buys) or support (for sells) level as your target.
- Never skip the stop-loss it’s your insurance policy against the unexpected.
6. Manage Your Trade Like a Pro

Trade management is where consistency is built.
- Once the price has moved in your favor (about 1x your risk), consider moving your stop-loss to break even this locks in a no-loss situation.
- As the trade develops, you can “trail” your stop-loss behind each new swing high (for sells) or swing low (for buys). This lets you ride big trends while protecting profits.
- If the price hits your take-profit, celebrate your win.
- If price reverses and breaks the trend structure (e.g., a lower low forms in an uptrend), exit the trade and reassess.
7. Real-Life Example (Putting It All Together)
Let’s see the strategy in action:
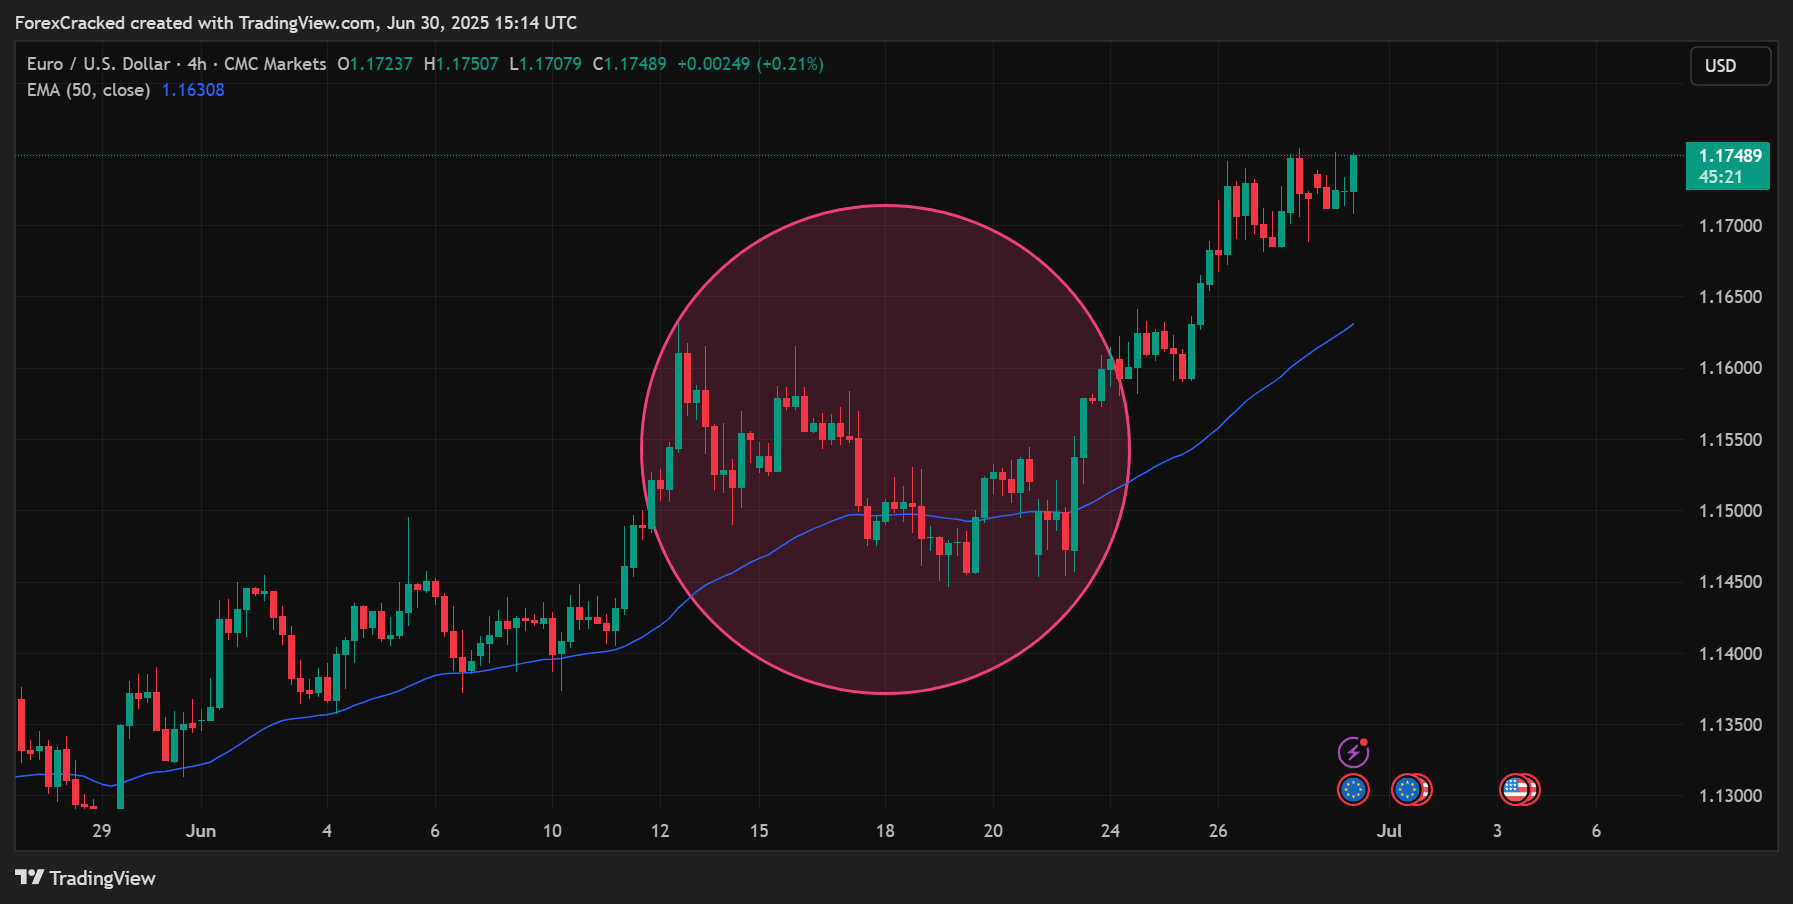
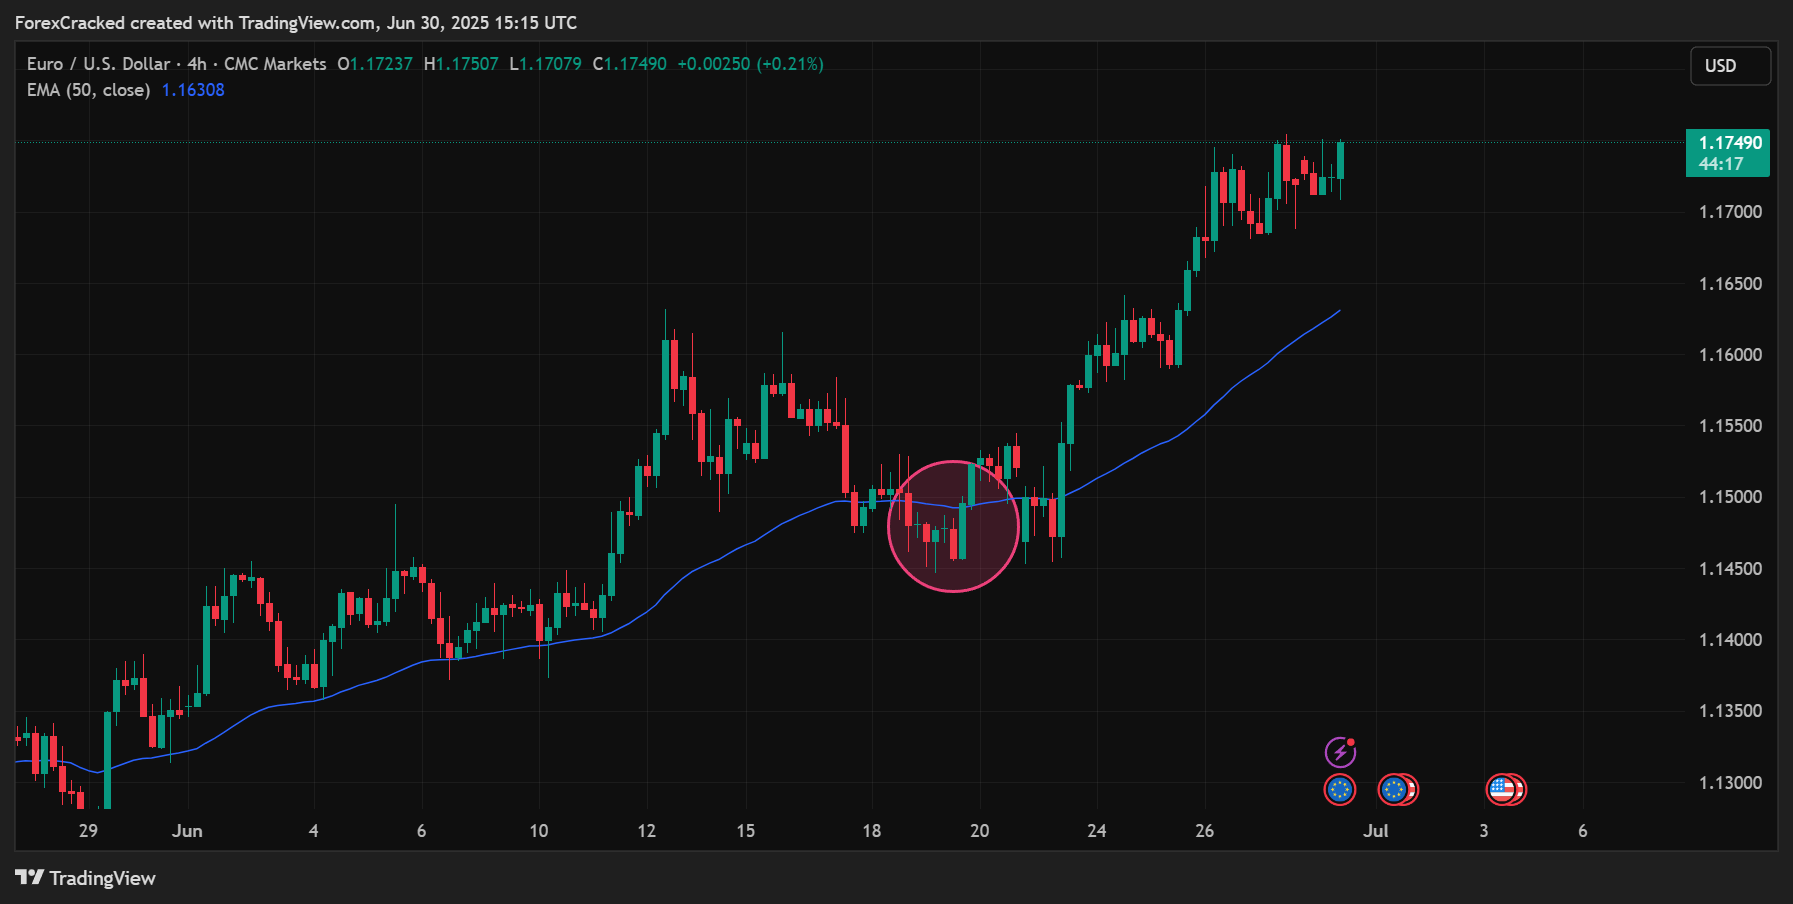
Suppose you’re watching the EURUSD on the 4H chart:
- The price is above the 50 EMA, making clear higher highs and higher lows (strong uptrend).
- Price pulls back and taps the 50 EMA.
- At the EMA, a bullish engulfing candle forms plus, RSI just crossed above 40.
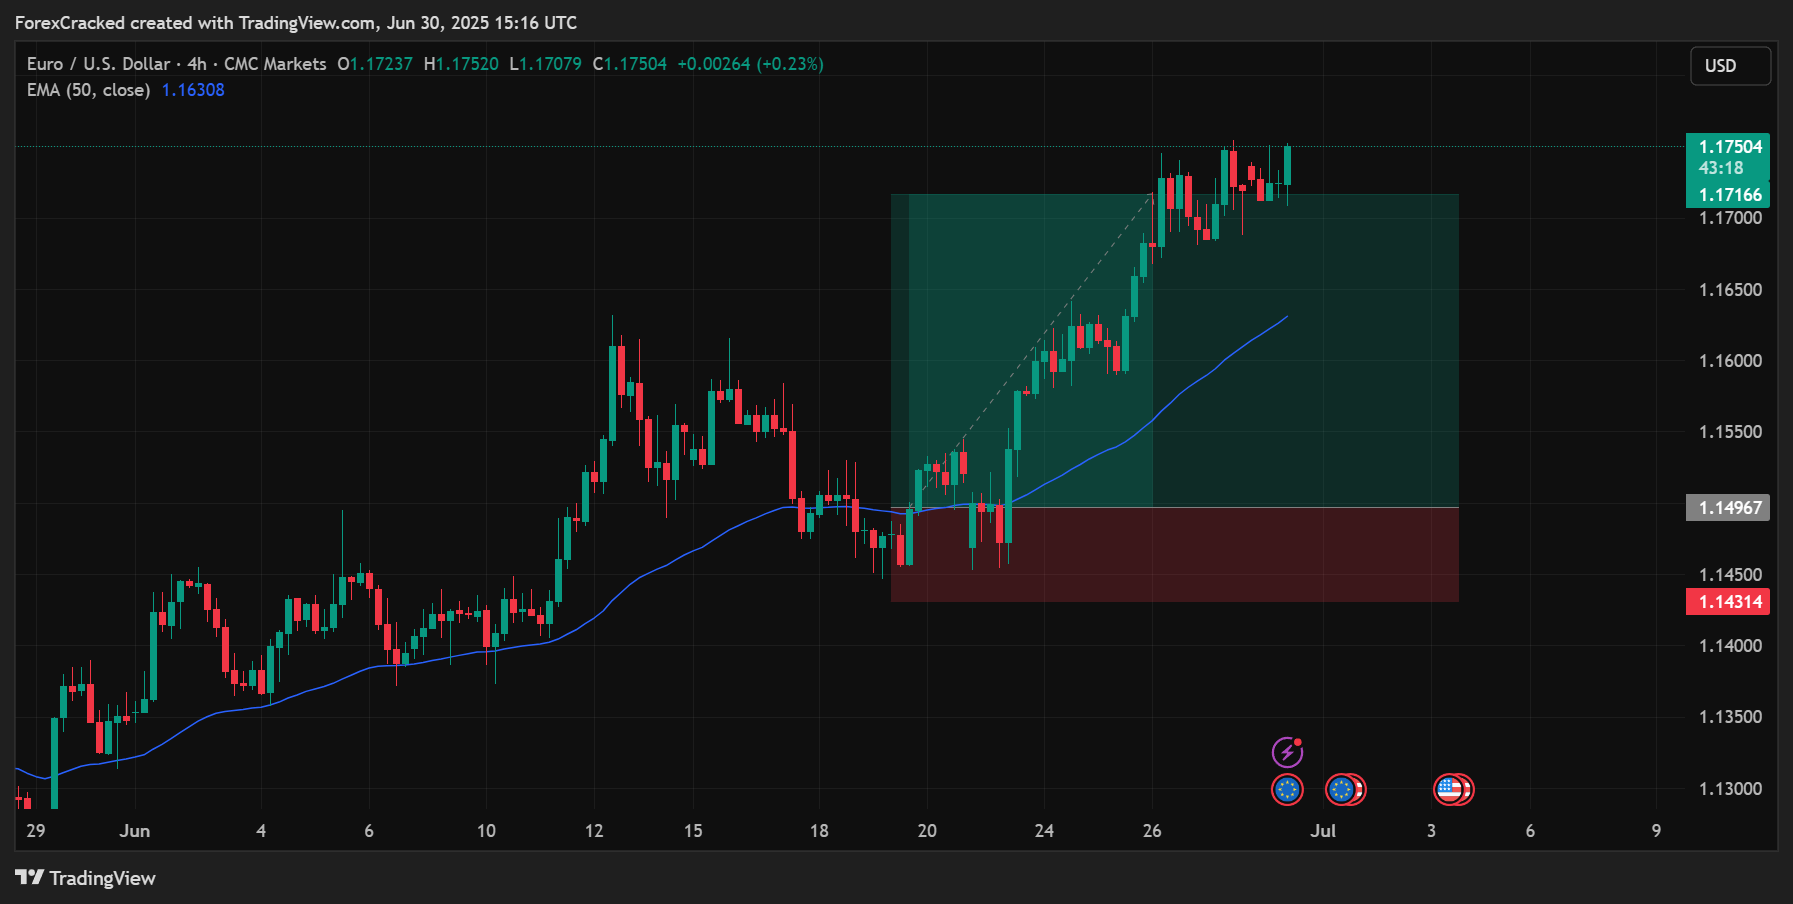
- You buy at the close of the engulfing candle.
- Stop-loss: 20 pips below entry, beneath the recent swing low.
- Take-profit: 40 pips above entry, at a logical resistance level.
If the trend continues, you’ll catch a smooth move. If not, your loss is small and controlled. That’s professional risk management.
8. Strategy Optimization & Backtesting
Before risking real money, take time to optimize and backtest your trend trading strategy. This not only builds confidence, but also helps you spot strengths and weaknesses you’d miss in live trading.
How to Backtest Your Strategy:
- Choose a pair and timeframe:
Start with a major pair (like EURUSD) on the 1H, 4H, or daily chart. - Scroll back on your chart and look for setups:
Apply the exact rules from your strategy (trend, pullback, confirmation, entry, stop-loss, take-profit). - Log every trade in a spreadsheet or journal:
Record entry and exit points, stop-loss and take-profit levels, win/loss outcome, and notes about the setup.
What to Look For in Your Results:
- Win Rate:
What percentage of your trades are winners? For trend trading, even a 40-50% win rate can be profitable if your winners are bigger than your losers. - Average Risk/Reward Ratio:
Aim for at least 1:2 or better. This means your average winning trade is at least twice as large as your average loss. - Maximum Drawdown:
This is the largest drop in your account during a losing streak. Knowing this helps set realistic expectations and position sizes.
Optimizing Your Strategy:
- Review your trade journal after every 20-30 trades:
Look for patterns are you losing more in certain market conditions? Are your best trades happening at a specific time of day? - Tweak your rules:
Adjust your entry, stop-loss, or take-profit guidelines if you notice consistent weaknesses. Always test any changes on past data before using them live. - Don’t over-optimize:
Your strategy should work across multiple pairs and market conditions, not just on “cherry picked” trades.
Why This Matters:
A well-tested strategy gives you real confidence. You’ll know exactly how it performs in different conditions, and you’ll be less likely to second-guess your plan when you start trading live.
8. Extra Tips for Consistent Results
- Only trade clear trends skip sideways or choppy markets.
- Stay out during high-impact news even perfect setups can get wrecked.
- Focus on 1–2 pairs to learn their habits; don’t spread yourself thin.
- Keep a trading journal:
- Write down each trade, why you took it, what worked, and what didn’t.
- Over time, review your journal to spot patterns and improve your decision making.
With this clear, step by step trend trading strategy, you’re no longer guessing you’re trading with structure, discipline, and the same logic as professionals. Stick to these steps, and you’ll set yourself apart from the crowd.


Download a Collection of Indicators, Courses, and EA for FREE
Bonus: Best Trend Trading Indicator FREE Download
Want to skip the manual work and just have the trend/pullback/breakout marked on your chart?
Here’s a free MT4 indicator (“Best Trend Trading Indicator”) you can use as a training wheel or as an extra confirmation.
What It Does:
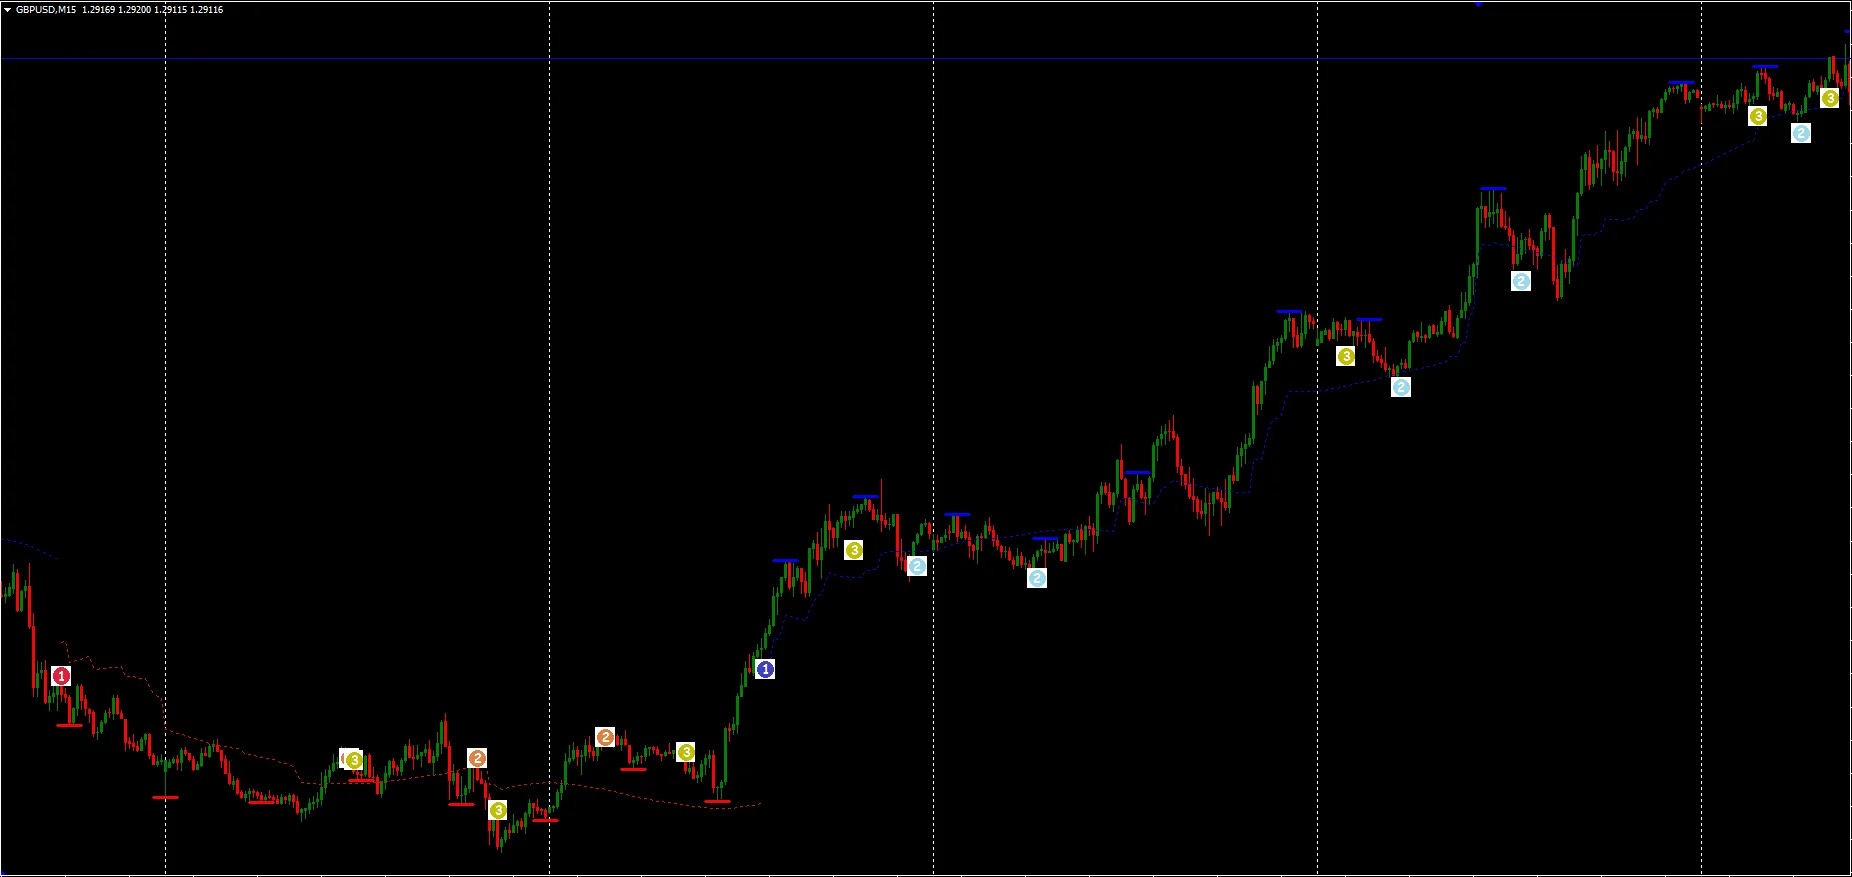
- Marks trend beginnings, pullbacks, and breakouts with clear signals (labeled 1, 2, 3).
- Works on any pair or timeframe.
- Sends alerts by pop-up, mobile, or email.
- Heads up: Some users mention possible repainting on certain settings use with confirmation, not blindly.
How to use it:
- Install on MT4 (quick guide: Download > drag to indicators folder > restart MT4 > add to chart)
- Use signal “1” for trend start, “2” for pullback entry, “3” for breakouts.
- Still follow your stop-loss and take-profit rules don’t skip the strategy!
Frequently Asked Questions (FAQ)
- What’s the best timeframe for trend trading?
1H, 4H, and daily charts work best for trend trading, offering clear signals and less noise. Beginners may prefer 4H or daily for fewer, stronger setups. - Can I use this strategy for scalping or day trading?
Yes, but trend strategies are most effective on higher timeframes. For scalping, expect more false signals and adjust risk management accordingly. - How do I tell if the market is trending or ranging?
Look for clear higher highs/lows (uptrend) or lower lows/highs (downtrend). If price moves sideways without direction, it’s best to wait. - Is the 50 EMA required?
It’s optional but helpful for confirming trend direction. You can use price action alone if you prefer. - How much should I risk per trade?
Risk 1–2% of your account per trade. Always use a stop-loss. - Does the bonus trend indicator repaint?
It may on lower timeframes. Use it for confirmation, not as your only entry signal. - Can I use this for gold, crypto, or other assets?
Yes! The same strategy and principles apply to any trending market. Always backtest first. - Do I need paid indicators or special software?
No. The strategy and indicator are free and work on most charting platforms. - How do I know my strategy is working?
Track your trades and review your win rate, risk/reward, and drawdown after at least 20–30 trades.
Still need help? Drop them in the comments below!
Final Thoughts
You don’t need a thousand indicators or a PhD to trade forex trends like a pro.
Master these basics, stick to the plan, and let the probabilities work for you. Use the bonus indicator if you want extra support, but always trust your own eyes and rules first.
Ready to catch your next big trend?
Give this strategy a shot let me know how it goes, and drop your results or questions in the comments.
i am tested. it is repaint :((