
v2v Indicators is not the usual thing out there. It doesn’t have any directional arrows and trigger alerts for long/buy or short/sell signals. For such, it needs critical thinking of the One in between the keyboard and a chair. Yes, that is you.
The system requires One’s due diligence to understand or to know more about this system. Sadly, it may take some precious time to finish the user manual due to constant development/updates.
This system includes more than dozens of indicators.
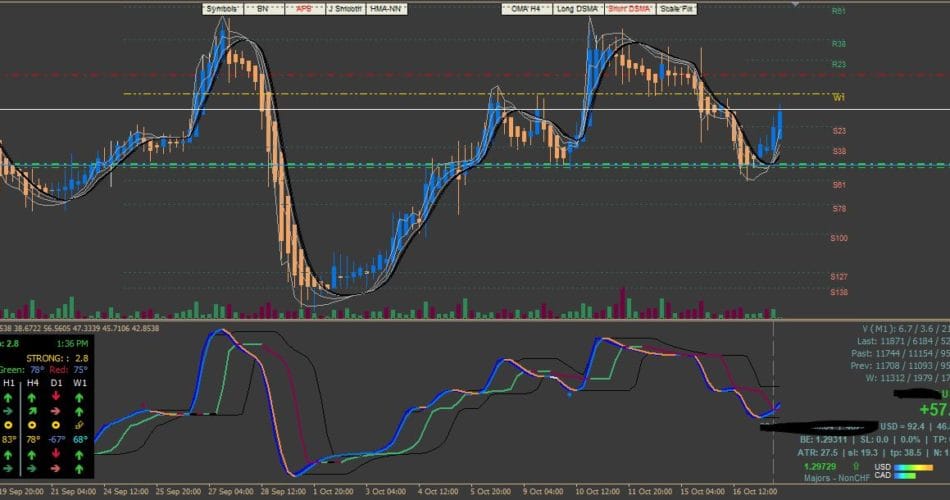
The VWAP bands on this system
This one is built with an Average True Range/Average Range or Average Daily Range wherein the shifted VWAP bands (from the midpoint – main VWAP line) are calculated based on statistical z-scores. The main VWAP starting point of calculation is based on Dr. Paul Levine’s (R.I.P.) lecture about his MIDAS system.
The statistical z-score value is getting injected inside an algorithm or as an option to be part of an equation for predicting trend-end probability. The vertical line guides on this system (from & to) are used for plotting from price inflection points or session range (4-hour, daily, weekly, and monthly or 8-hour or 24-hour market range). The setup included a feature that can switch from MVWAP (MA-based VWAP ) to classic VWAP. The MA (Moving Average) is a Hull MA non-lag fused using a Fulks Matulich way of calculation of a T3-based MA. As a result, I called it a T3-HMA.
The MAs inside the system are mostly linear volume-weighted with applied Jurik-based MA smooth filter (but some of it only as the rest are using an adaptive calculation with Price) before adding DSMA filter (Deviation-Scaled MA by John F. Ehlers). Then, other tools were fused within the system… Such as a Regression Analysis tool that can switch instantly between a normal Price Close and Heiken Ashi – APB Close. And the MA’s period calculation within the system is calculated/assigned dynamically based on the current Dominant Cycle Period, an algorithm by John F. Ehlers.
Dynamic Zones by Leo Zamansky Ph.D. and David Stendahl
The Dynamic Zone indicator can elaborately show how it solves common trading complications. Extreme investing employs the use of oscillators to exploit tradable trends in the market. This style of investing follows a very simple form of logic: only enter the market when an oscillator has moved far above or below traditional trading levels. However, these indicator-driven systems, cannot evolve with the market because they use the fixed buy and sell zones. Traders typically use one set of buy and sell zones for a bull market and substantially different zones for a bear market.
Herein lies the complications. Once traders begin introducing their market opinions into trading equations, they negate the system’s mechanical nature by changing the zones. The objective is to have a system automatically define its own buy and sell zones and thereby profitably trade in any market — bull or bear. Dynamic Zones offer a solution to the complications of fixed buy and sell zones for any indicator-driven systems.
Jurik filter ─ phase and smoothing
This TDI version uses JMA’s (Jurik Research Moving Average) phase and smoothing calculation. Have you noticed how moving averages add some lag (delay) to your signals? … especially when price gaps up or down in a big move, and you are waiting for your moving average to catch up? Wait no more! JMA eliminates these complications forever and gives you the best of both worlds: low lag and smooth lines.
Ideally, for instance, a filtered signal may both be smooth and lag-free. Lag causes delays in your trades, and increasing lag in your indicators typically results in lower profits. In other words, latecomers get what’s left on the table after the feast has already begun. The JMA’s improved timing and smoothness will astound you.
JMA is a powerful adaptive tracker that can smooth time series data with a very small lag, no overshoots, and no oscillations. The algorithm is stable and avoids the complexities of neural networks. JMA delivers the best all-around performance for smoothness, accuracy, and timeliness.
RSI-Trend Strength Index (RSX) by Mark Jurik
RSI is a very popular technical indicator because it takes into consideration market speed, direction, and trend uniformity. However, its widely criticized drawback is its noisy (jittery) appearance. The RSX retains all the useful features of RSI, but with one important exception: the noise is gone with no added lag.
Best Formula: Using Average Price Bar ( APB )
Average Price Bars provide a better depiction of the current market by eliminating or reducing fluctuations in nominal price action often referred to as “choppiness” of current High, Low, and Close price action. In other words, APB removes the noise of price distortion.
Uses Hull MA (by Allan Hull) but this one is a variation from Low lag to zero-lag
There are many types of moving averages, the most basic being the Simple Moving Average (SMA). Of all the moving averages the SMA lags price the most. The Exponential and Weighted Moving Averages were developed to address this lag by placing more emphasis on more recent data. The Hull Moving Average (HMA), developed by Allan Hull, is an extremely fast and smooth-moving average. The HMA almost eliminates lag and manages to improve smoothing at the same time. The dynamic MyRSI with NET combined with T3 Hull MA variation with Jurik filters, and phase & smoothing ultimately eliminates lagging.
Ehler’s Deviation-Scaled Moving Average ( DSMA )
The new DSMA was made by John Ehlers and featured in the July 2018 issue of TASC magazine. The DSMA is a data smoothing technique that acts as an exponential moving average with a dynamic smoothing coefficient. The smoothing coefficient is automatically updated based on the magnitude of price changes. In the Deviation-Scaled Moving Average, the standard deviation from the mean is chosen to be the measure of this magnitude. The resulting indicator provides substantial smoothing of the data even when price changes are small while quickly adapting to these changes.
RSI & RSX haDelta
haDelta is a simple formula originally developed and published by Mr. Dan Valcu. The idea behind haDelta is to quantify HA candles. One can measure momentum, which is very important when you use haDelta for reversals. It measures the difference between HA Close and HA Open. Caution: High sensitivity if used.
Vertical Horizontal Filter ( VHF )
Vertical Horizontal Filter (VHF) was created by Adam White to identify trending and ranging markets, similar to the Hikkake Pattern indicator. VHF measures the level of trend activity, similar to ADX in the Directional Movement System. Trend indicators can then be employed in trending markets and momentum indicators in ranging markets.
(TRIX) by Tim Tillson
The reason for the development of this moving average was to improve the noise filter and decrease a lag, presented in most of the moving averages. The indicator is based on multiple exponential smoothing of price.
Dominant Cycle Period ( DCP )
The DCP generated value is being used as a dynamic Period parameter value (for dynamic MyRSI with NET).
Homodyne means I use the signal multiplied by itself one bar ago to produce a zero-frequency beat note. This beat note carries the phase angle of the one-bar change. Still using the basic definition of a cycle, the one-bar rate of change of phase is exactly the cycle period.
Linear Momentum ─ a.k.a. MomenTicks
Linear momentum is defined as the product of a system’s mass multiplied by its velocity. In symbols, linear momentum is expressed as p = mv. Momentum is directly proportional to the object’s mass and also its velocity. Thus the greater an object’s mass or the greater its velocity, the greater its momentum.
MyRSI with NET ( Noise Elimination Technology )
The MyRSI with NET is a technical indicator that employs Kendall correlation to remove nonlinear noise. Two main plots are calculated: MyRSI and NET. Each plot can be used as a confirmation of the other. NET stands for noise-eliminating technology.
MyRSI is a modified Relative Strength Index, similar to what is used in RocketRSI. It is calculated as the ratio of the sum of recent one-bar close price differences to the sum of absolute values of these differences.
NET is calculated as Kendall correlation of MyRSI. The NET plot is less noisy than MyRSI, however, usage of additional filters may be beneficial.
THIS IS EXPIRED