
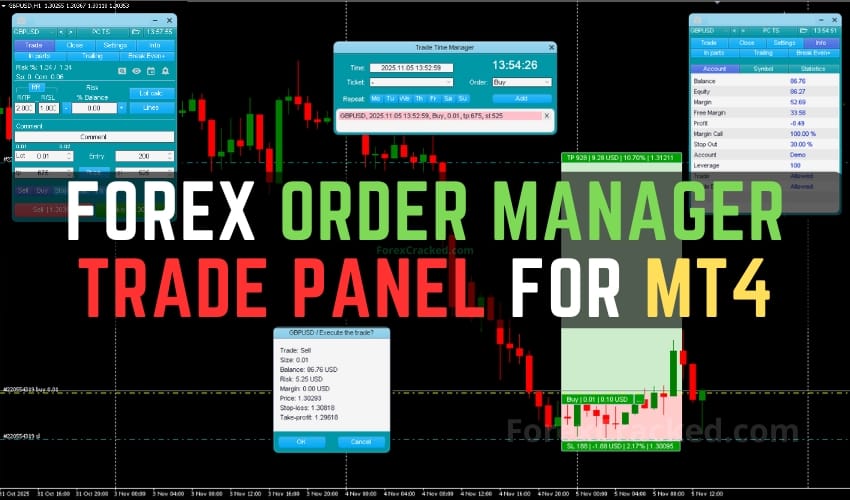
Forex Order Manager – Trade Panel for MT4 FREE Download
Traders utilizing manual strategies often find value in tools that enhance precision, control, and efficiency. A trade panel designed for...
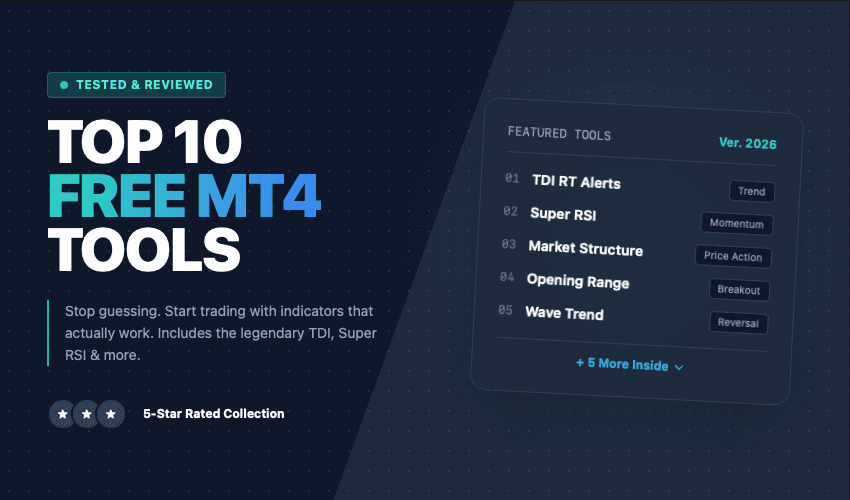
Browse the largest library of free forex indicators for MetaTrader 4 and MT5 — over 660 tools and growing daily. Every indicator is tested, verified as non-repainting, and available for instant download. Whether you need trend arrows, scalping signals, smart money tools, or oscillators — find the perfect tool for your strategy below.
Browse by Indicator Type:
| Indicator | Type | Best For |
|---|---|---|
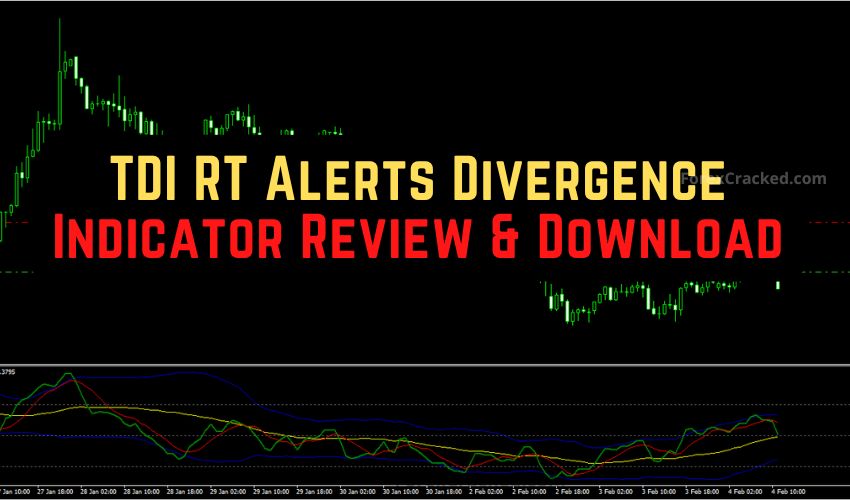
| TDI RT Alerts Divergence | All-in-One | Replaces multiple tools |
| Chandelier Exit | Exit Tool | Volatility-based stop loss |
| SMI Ergodic Oscillator | Reversal | Smooth momentum signals |
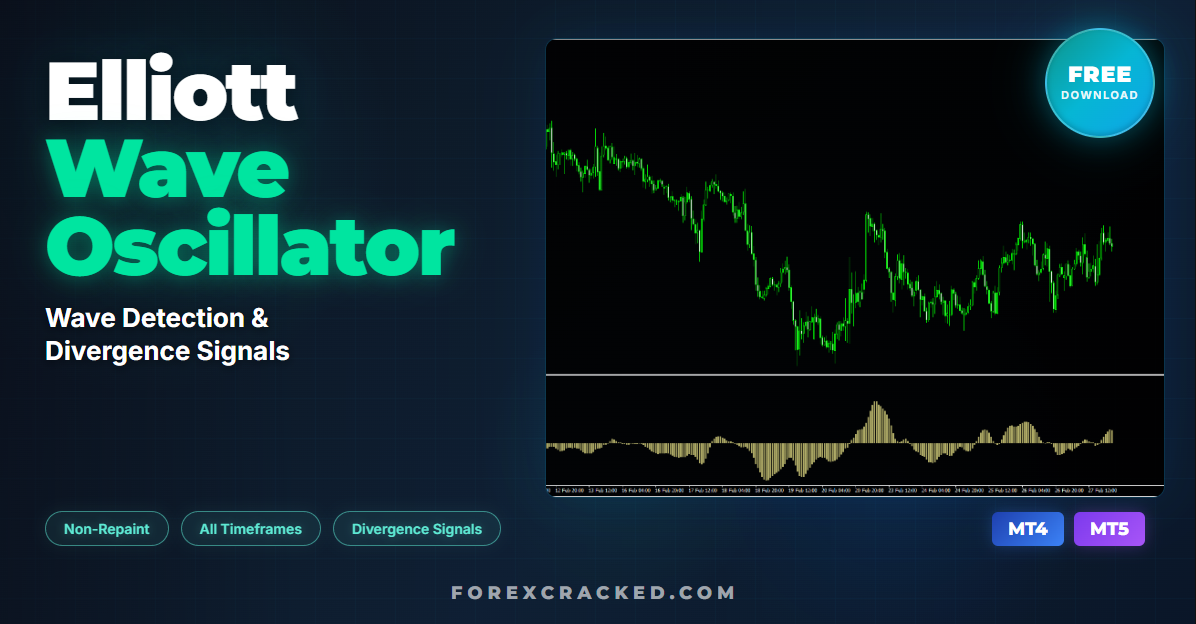
| Wave Trend Oscillator | Momentum | Overbought/oversold entries |
| Market Structure Oscillator | Smart Money | BOS & CHoCH detection |
| Didi Index | Breakout | Predict breakouts early |
| Super Signal Scalping | Scalping | Multi-confluence M5 signals |
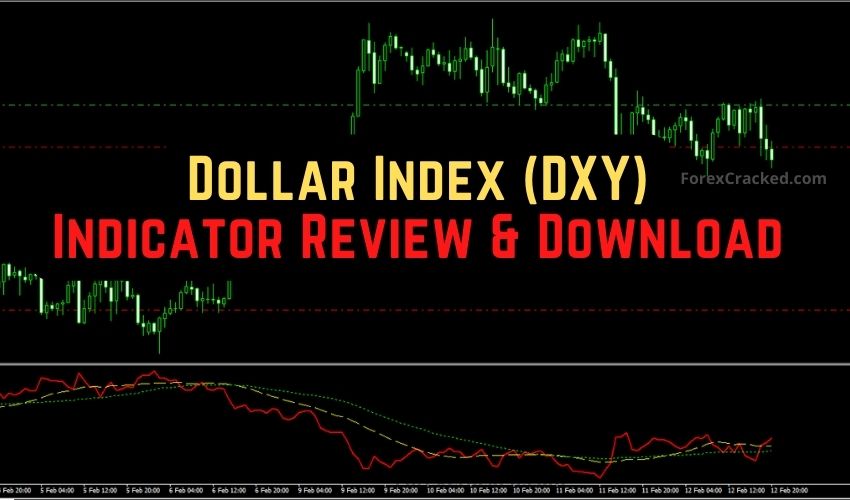
| Dollar Index (DXY) | Analysis | USD strength tracking |
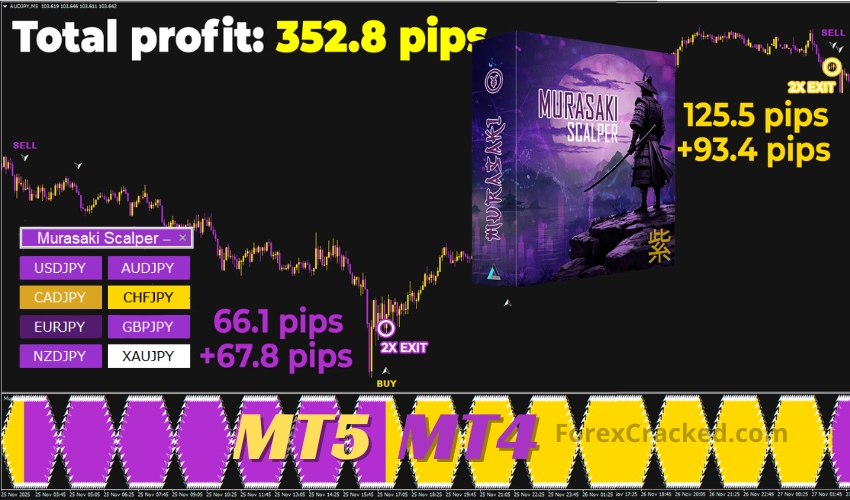
| Murasaki Scalper | Trend | JPY pair specialist |
| Eagle Scalper | Scalping | High win-rate signals |
💡 Pro Tip: Not sure which indicator is right for you? Read our expert-reviewed Top 10 Best Free MT4 Indicators for 2026 — with complete trading strategies, comparison tables, and setup guides for each tool.
675 posts found
![Forex Gladiator – Non-Repaint Indicator That Trades for You [Sale – 20% OFF]](https://www.forexcracked.com/wp-content/uploads/2026/03/Non-Repaint-Indicator-That-Trades-for-You-sale-ForexCracked.com_.jpg)
![RFI Levels Indicator FREE Download [2026 Update]](https://www.forexcracked.com/wp-content/uploads/2025/02/RFI-Levels-Indicator-FREE-Download-ForexCracked.com_.jpg)

Yes, we verify all indicators to ensure signals don't change after the candle closes. Non-repaint indicators are clearly labeled with the "non-repaint" tag for easy identification.
For scalping on M1-M15 timeframes, we recommend the Super Signal Scalping Indicator and Eagle Scalper. Both provide clear arrow signals without repainting.
Many indicators are available for both MT4 and MT5. Check our dedicated MT5 Indicators section for compatible tools, including the SMI Ergodic and Market Structure Oscillator.
Absolutely! We recommend combining trend indicators (like TDI or Wave Trend) with oscillators for confirmation signals. Using 2-3 complementary indicators often produces better results than relying on one.
Yes, all indicators on ForexCracked are completely free to download with full functionality. No hidden fees or limitations.