
Clarity and timing are everything when it comes to trend trading, especially in volatile currency markets. That’s where the Round Price Ext Trading Indicator for MT4 has earned its place in my toolbox. Whether you’re a short-term scalper or holding trades for days, this indicator gives you a clean, visual layout of market momentum without the clutter.
Unlike noisy repainting tools, this one uses a T3 smoothing algorithm, which is a game changer if you haven’t tried it before. It’s faster than traditional moving averages but with less lag and whipsaw.
Let me walk you through how I use it on my charts and why it’s particularly effective when you’re trading trending markets.
What Is the Round Price Ext Trading Indicator?
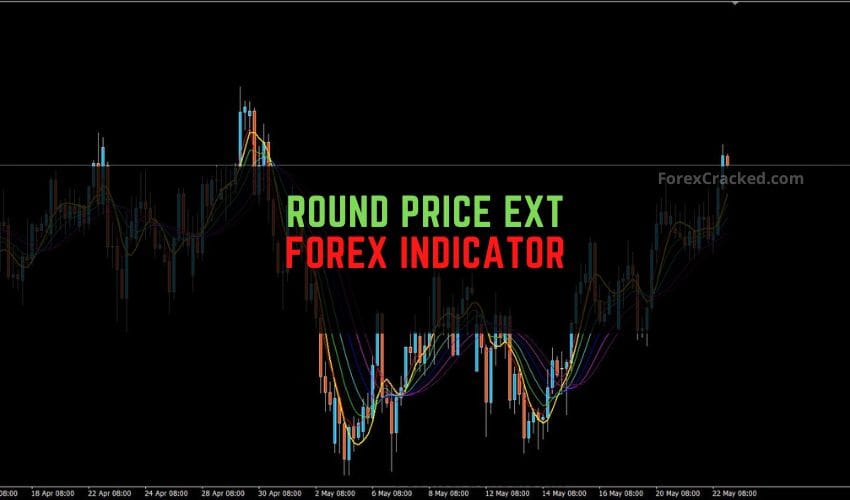
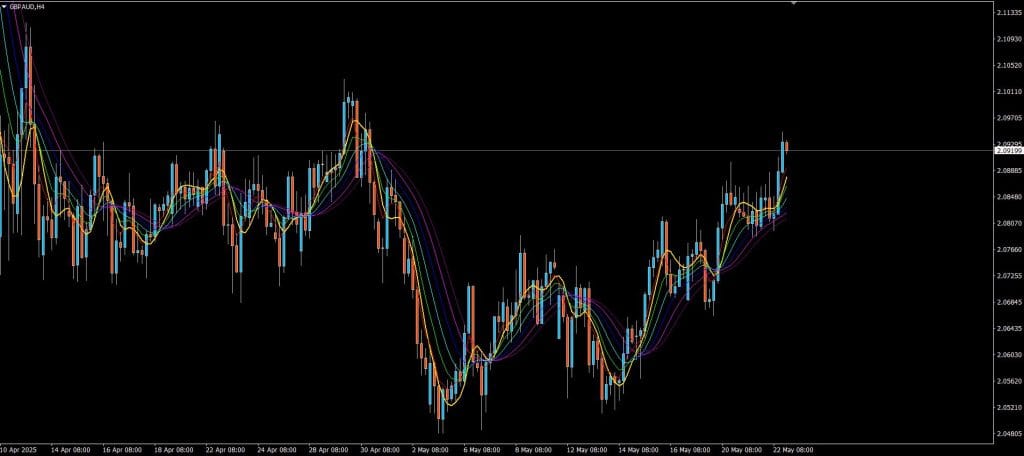
The indicator plots seven T3 moving average lines in different colors—gold, red, lime, aqua, blue, magenta, and purple. But here’s the kicker: the red line is your signal line, and everything revolves around it.
Once you install it on your MT4 platform, you’ll see this rainbow of T3 lines hugging price tightly. That’s because T3 smoothing is designed to follow the price action closely while filtering out the noise.
You can also tweak the smoothing period to fit your trading style—tight for scalping, looser for swing, or position trades.


Trading With Round Price Ext – How I Do It
The logic is straightforward, and that’s what makes it beautiful.
Buy Signal Setup:
- Wait for the red signal line to cross above all the other six T3 lines.
- This cross suggests strong bullish momentum.
- Enter a buy trade once the crossover confirms on a closed candle.
- Stop-loss goes below the last swing low.
- For exits, I trail the stop or use the opposite crossover signal as my final exit.
Sell Signal Setup:
- Look for the red line to cross below the other T3 lines.
- That tells you bearish momentum is building.
- Sell after the confirmation and place your stop just above the previous high.
- Again, either trail it or exit when you get the opposite crossover.
If the red line is tangled in the middle of the other lines, it’s a signal to stay out. That usually means consolidation or indecision—no edge there.
Best Timeframes?
From my experience:
- 1H and 4H timeframes give the most reliable signals.
- Works well on daily charts for swing traders.
- M15 and M30 are okay if you’re scalping, but expect more fakeouts unless you use a confirmation filter like RSI or price action.
Pro Tips for Better Results
- Combine with Support & Resistance: A higher-probability setup is one in which the red line crossover happens at a known S/R level.
- Don’t force trades in sideways markets. This is a trend-following indicator. You’ll get chopped up if the market’s stuck in a range.
- Use with price action or candlestick patterns for confirmation, like a bullish engulfing at a crossover.
Free Download Round Price Ext Trading Indicator
Read More Market Reversal Indicator MT4 FREE Download
Final Thoughts
The Round Price Ext Trading Indicator for MT4 is one of those tools that fits seamlessly into almost any trading strategy. It doesn’t repaint, it doesn’t overcomplicate, and it does exactly what it’s meant to do: show you when a real trend is forming.
This one strikes a good balance if you’ve struggled with laggy or overly sensitive indicators. Just remember—it shines in trending conditions. In choppy or sideways markets, sit tight or wait for clear breakouts.
Whether you’re a new trader trying to avoid the noise or an experienced one building a system for auto-trading, this indicator deserves a spot on your chart.
Key Features Recap:
- It uses 7 T3 smoothed moving averages.
- Non-repainting and trend-following
- Ideal for swing, position, and even short-term traders
- Easy-to-read entry signals via red-line crossovers
- It can be customized for different trading styles
What are the 7 smoothes MA’s?
Particularly the Gold and Magenta lines?