

Ever opened a forex chart and felt stuck watching price bounce between two invisible walls with no clear trend in sight?
That’s a classic sign of a ranging market, and it’s where many traders lose money fast. Stop losses get triggered, trend following systems fail, and frustration often leads to poor decisions.
But here’s the truth: a well executed forex range trading strategy can turn those sideways markets into consistent profit opportunities.
Instead of chasing breakouts, this approach helps you treat the range itself as your edge buying low, selling high, and managing risk with precision while others get chopped up.
In this guide, you’ll learn a simple, step-by-step forex range trading strategy, backed by ATR logic and real price structure. Plus, you’ll get a free MT4/MT5 Range Detector Indicator to help you spot trade ready ranges in real time.
Let’s turn that frustrating sideways market into a reliable income stream.
Table of Contents
How Range Trading Really Works (Supply Demand in Balance)
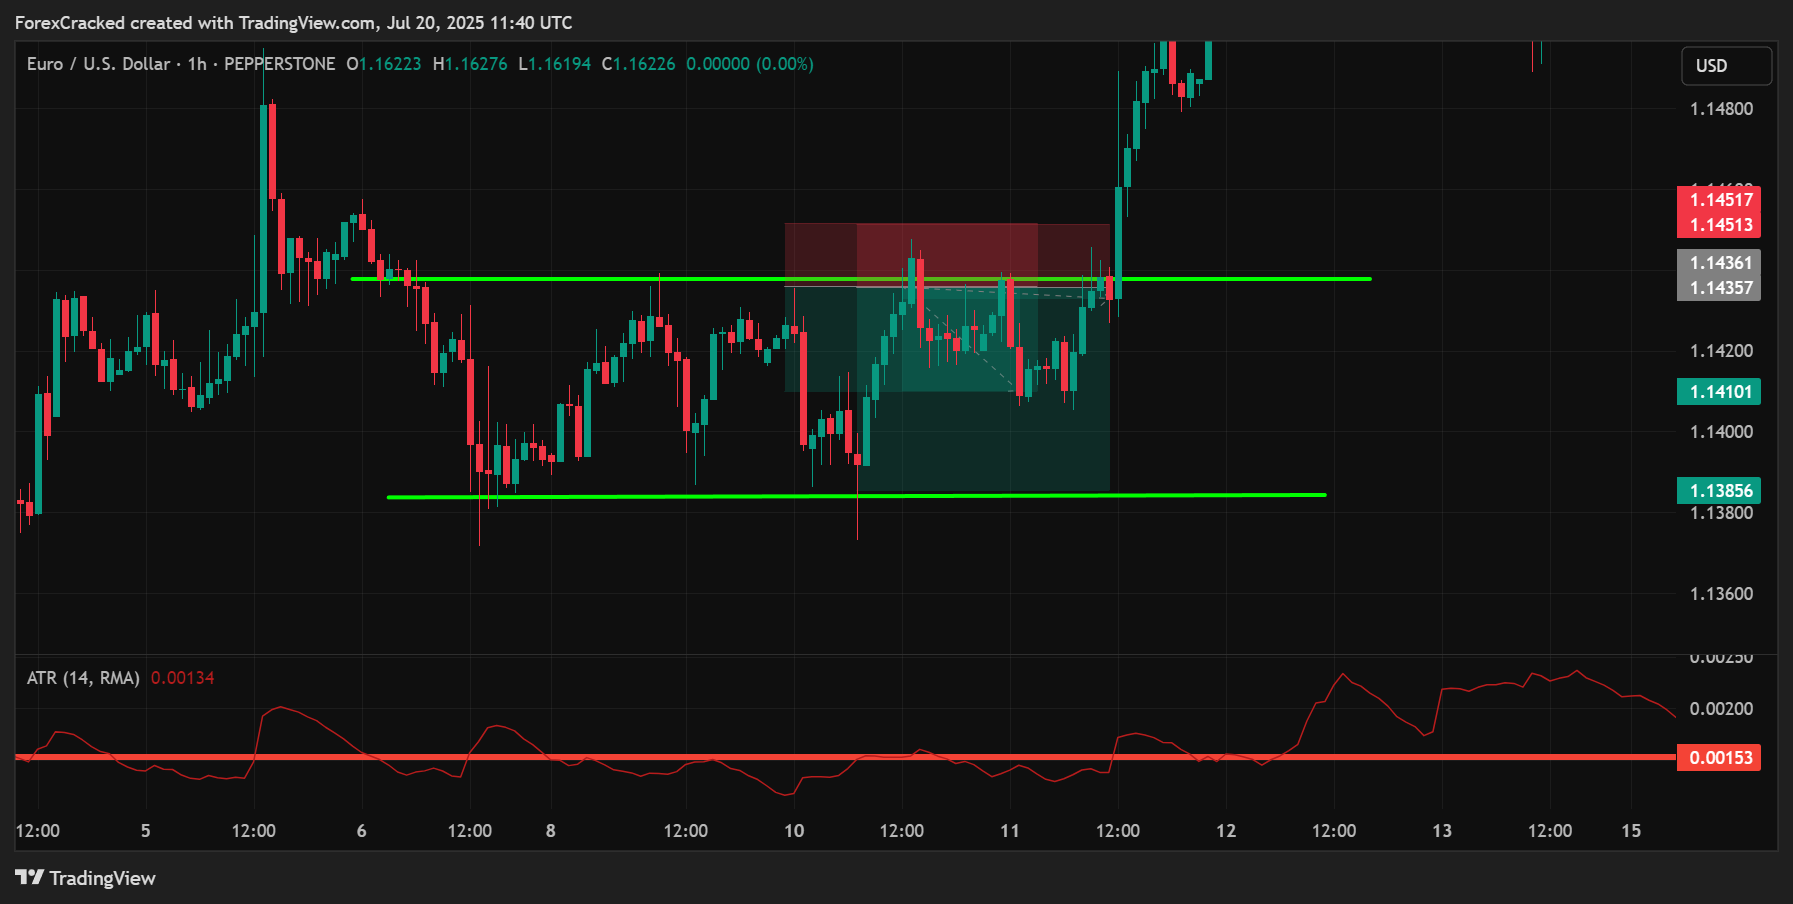
In forex, price doesn’t always trend up or down. Often, it enters what’s known as a range bound market a phase where price moves sideways between two clear levels: resistance (the ceiling) & support (the floor). This happens when buying and selling pressure reach a temporary balance. Neither bulls nor bears are in control, so price just oscillates between those two zones.
Behind the scenes, this is often where big institutions are accumulating or distributing positions. They’re not in a rush. They’re building or unloading large trades quietly, without causing major price moves that could alert retail traders.
During this phase, volatility contracts, the market “rests,” and the same price levels get tested repeatedly. This is where smart traders step in not by guessing breakouts, but by treating the range itself as a reliable trading opportunity.
Here’s the simple formula:
- Identify the Box
Find a well-structured range with at least two touches on both the top and bottom. You’re looking for clear horizontal boundaries no messy, irregular chop. - Fade the Edges
When price nears the top (resistance), consider shorting back toward the middle. When it nears the bottom (support), consider buying. Always confirm with a price action signal like a pin bar, engulfing candle, or rejection wick. - Respect the Breakout
Eventually, price will escape the range. Don’t fight it. If it breaks out with momentum, close your range trades and either stay out or switch to a trend-following setup.
This approach works because it follows what the market is actually doing not what you wish it would do. And when paired with solid risk management, it turns these “dead zones” on the chart into consistent profit opportunities while others get frustrated and overtrade.
Range trading isn’t just about spotting a box. It’s about timing, discipline, and understanding how price behaves when the market goes quiet. Master that, and you’ll unlock one of the most overlooked edges in the forex game.
The 8-Step Forex Range-Trading Blueprint (ATR-Backed Rules)
This range trading strategy is built on clarity, structure, and simplicity. It doesn’t rely on complex indicators or guesswork. Instead, it gives you a repeatable process for identifying clean ranges, entering with precision, and managing trades with discipline. Whether you’re a beginner or a seasoned trader looking to refine your edge, these steps will help you approach sideways markets with confidence.
Step 1: Choose Clean Forex Pairs and Timeframes
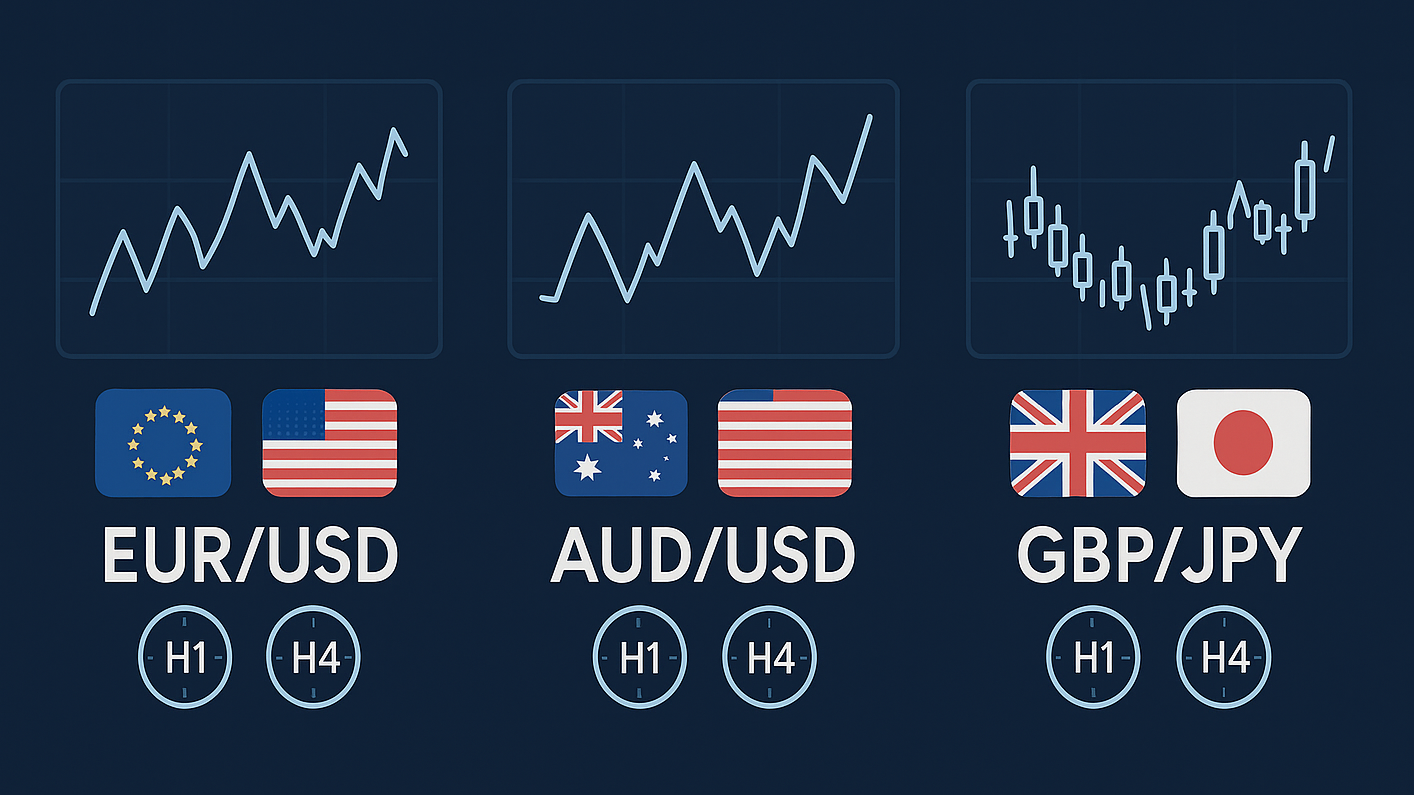
Start by focusing on currency pairs that are known for their structure and liquidity. Major pairs like EURUSD, AUDUSD, and GBPJPY are ideal because they move smoothly and offer tight spreads.
Avoid exotic pairs or highly erratic markets they’re more likely to produce fake ranges or unpredictable wicks.
Use the 1-hour (H1) or 4-hour (H4) charts to find reliable ranges. These timeframes filter out noise while still providing enough trading opportunities.
Also, avoid entering trades around high-impact news events like interest rate decisions or Non-Farm Payrolls. News can cause sudden breakouts that destroy range setups.
Step 2: Pre-Filter with ATR (Average True Range)
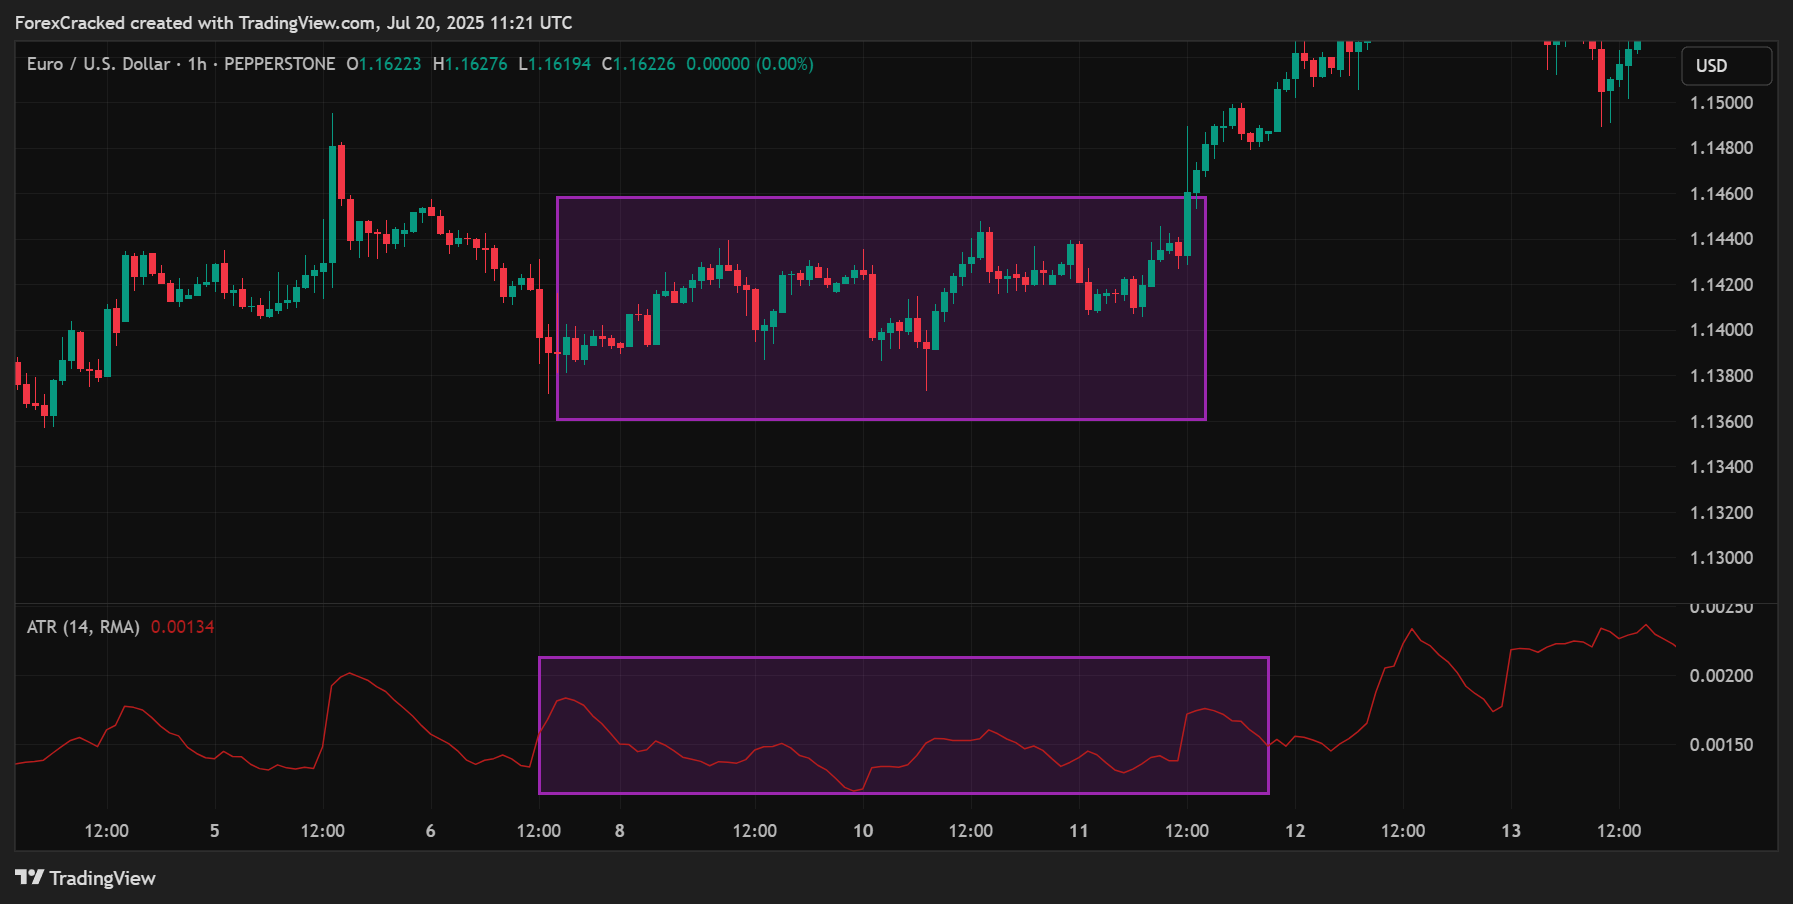
Before looking for entries, you want to be sure the market is actually in a low-volatility phase.
Add the ATR(14) indicator to your chart. This measures volatility over the past 14 candles.
If the ATR has dropped at least 30% compared to recent highs, it’s a strong clue the market is quiet and that a range is forming or already established.
This step helps you avoid false setups in markets that are too volatile to range trade effectively.
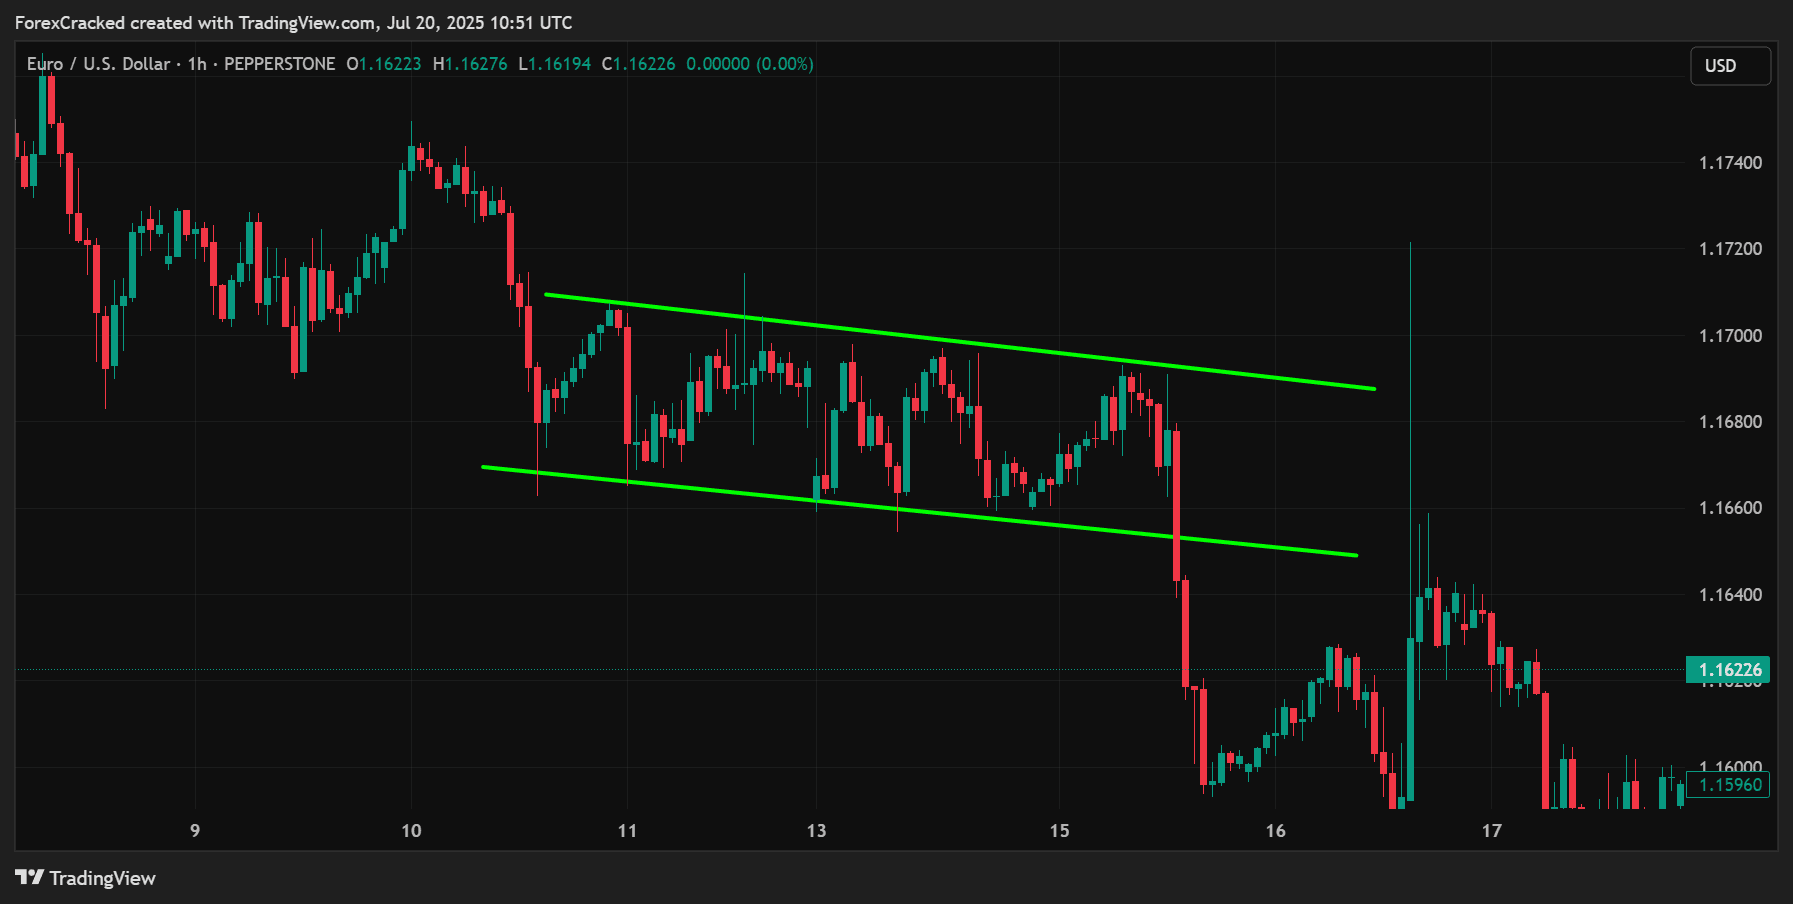
Step 3: Manually Mark the Range
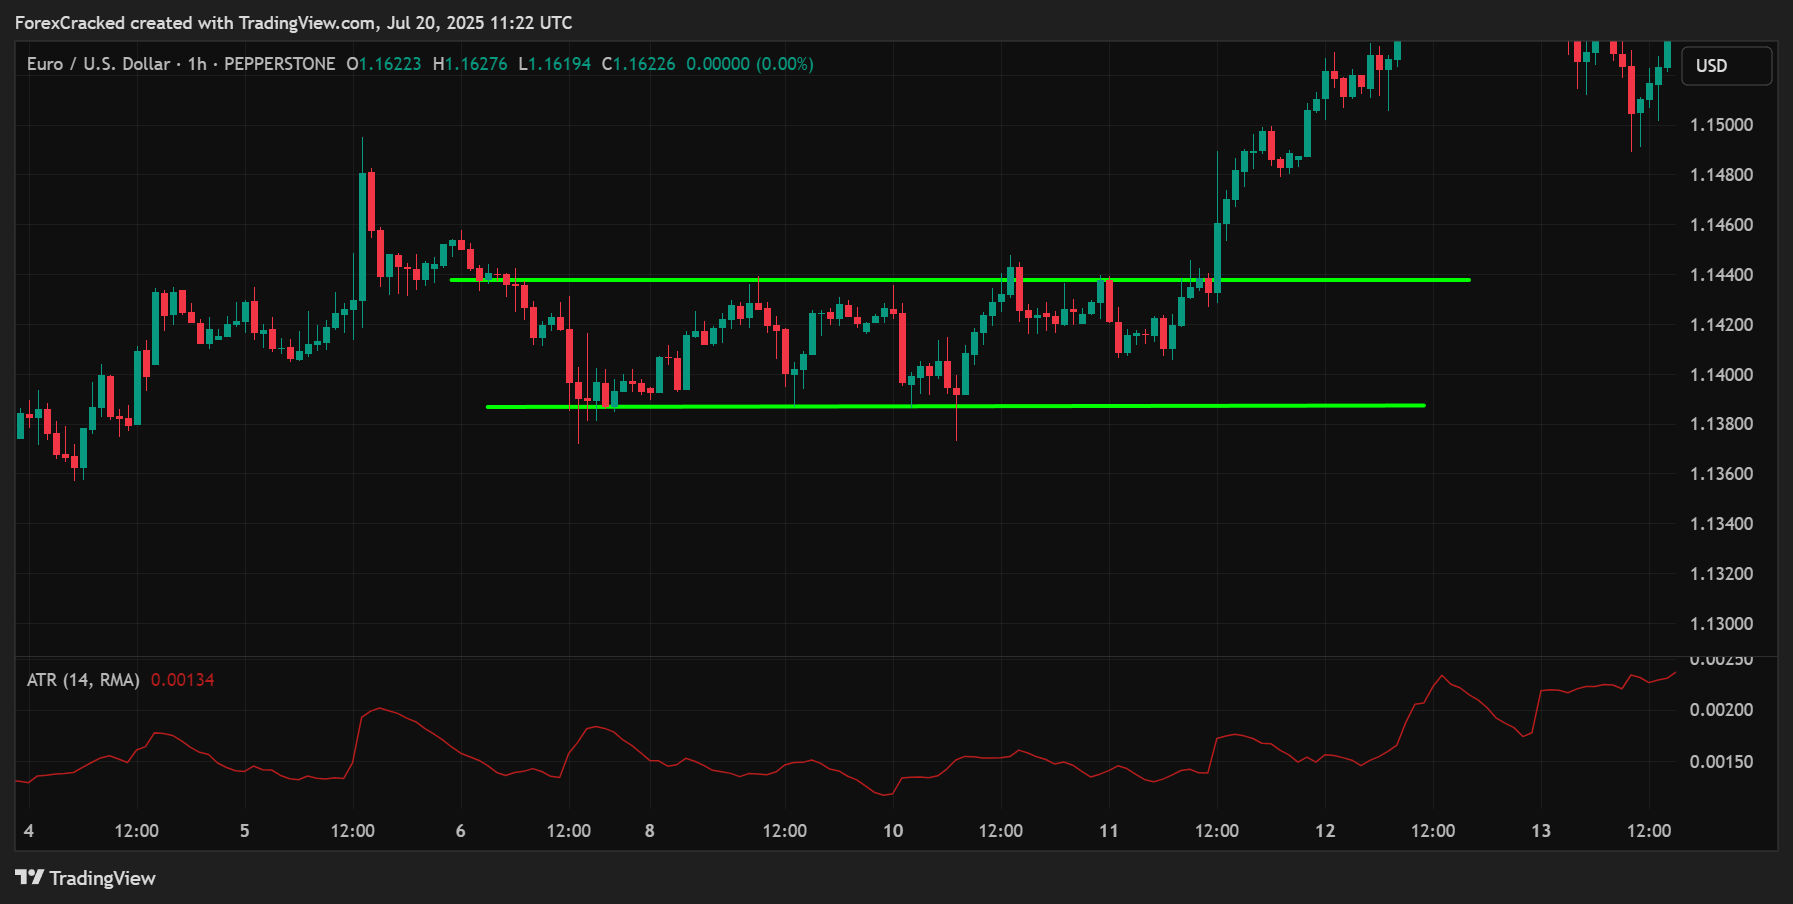
Once you’ve confirmed low volatility, it’s time to define the range. Zoom out slightly so you can view at least two to three full screen widths of price action.
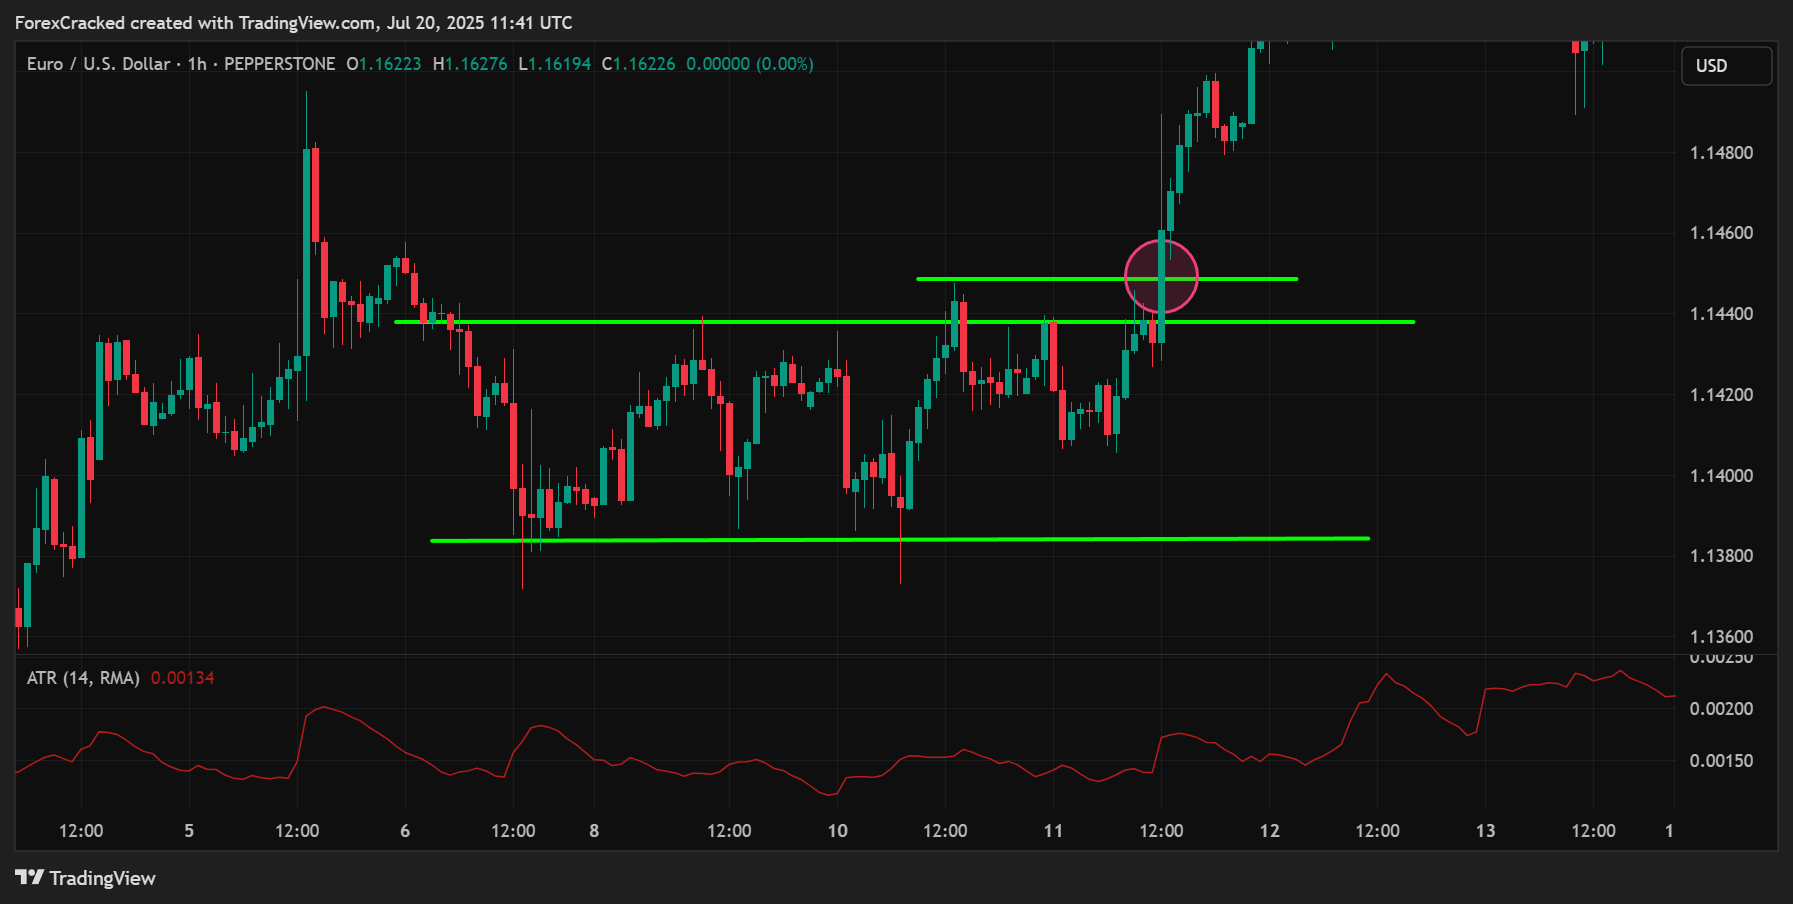
Draw horizontal lines at the top and bottom of the range by identifying at least two matching swing highs and two matching swing lows.
Now calculate the midpoint between those levels simply add the high and low and divide by two. This level becomes your first target zone.
By marking these zones manually, you develop chart awareness and learn to “see” structure even without indicators.
Step 4: Entry Strategy, Fade the Edges with Confirmation
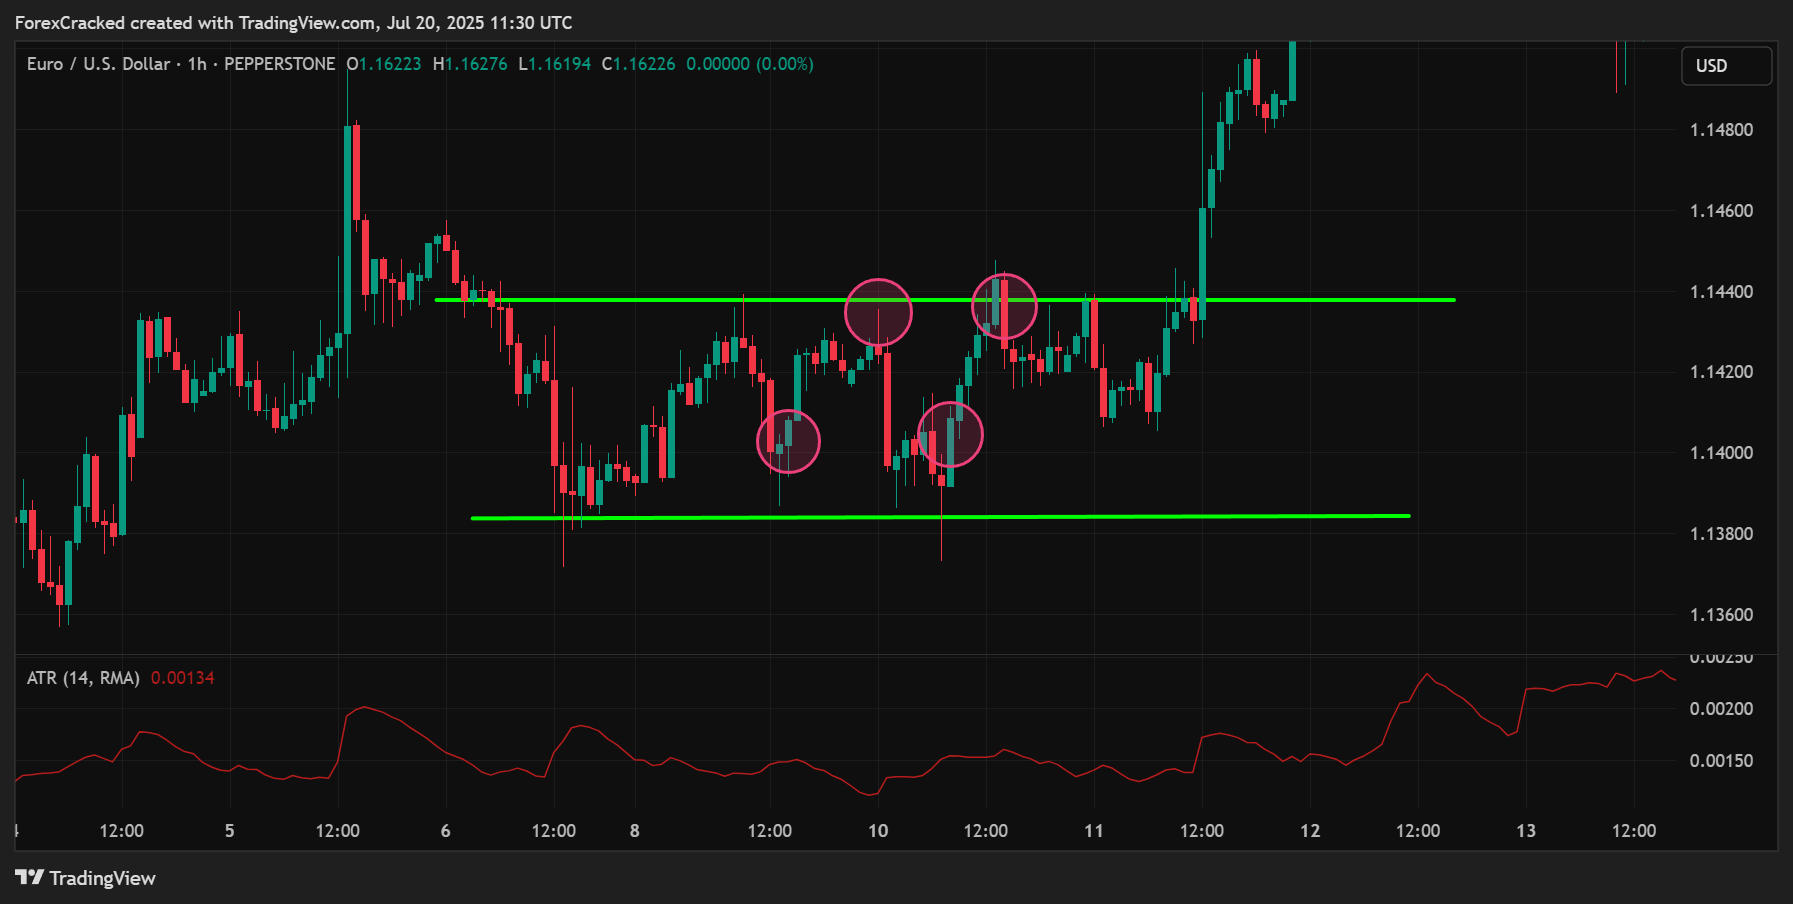
Once your box is in place, be patient. You’re looking for price to approach either the top or bottom of the range.
When it does, wait for a confirming candle pattern to signal exhaustion. These include:
- Bullish pin bar or engulfing candle near the lower boundary (buy signal)
- Bearish engulfing or shooting star near the upper boundary (sell signal)
Place your entry a few pips inside the range around 5 pips above support for buys or 5 pips below resistance for sells.
This small buffer avoids getting trapped by those frustrating “wick fakeouts” where price briefly tags a level before reversing hard.


Download a Collection of Indicators, Courses, and EA for FREE
Step 5: Use ATR-Based Stop Losses
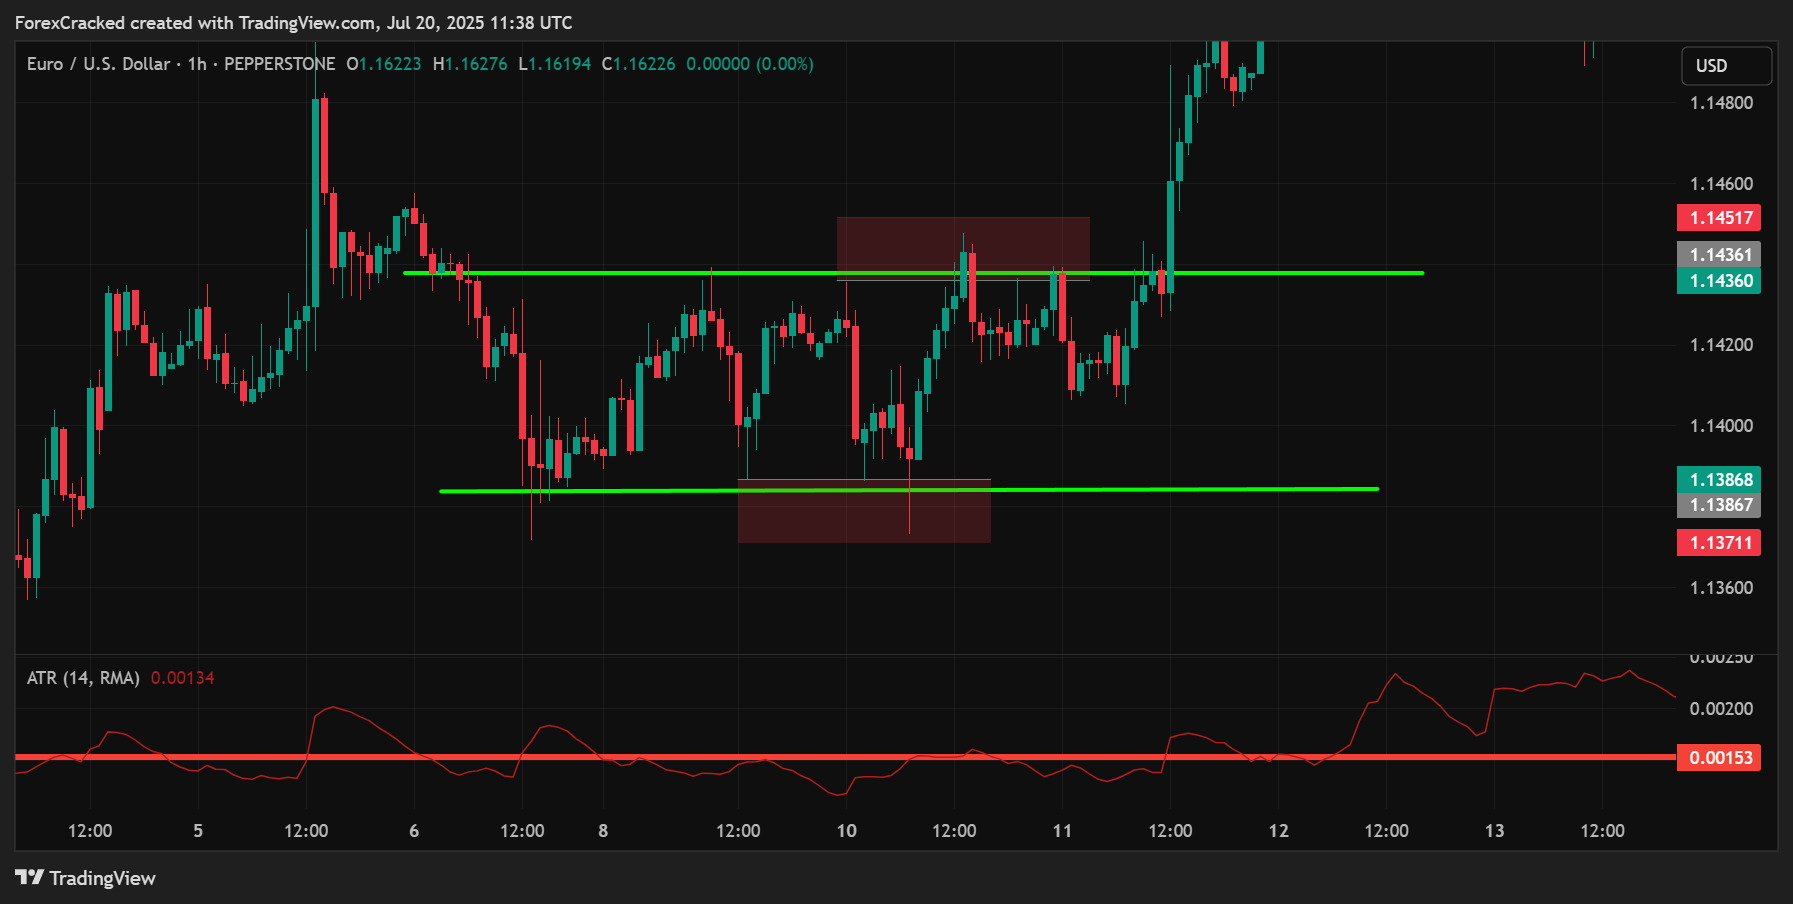
Don’t guess your stop-loss distance. Use a dynamic method based on market conditions.
If you’re going long, place your stop 1 × ATR below the lower boundary of the range.
If you’re going short, place your stop 1 × ATR above the upper boundary.
This way, your stop adapts to the current volatility of the pair tight during quiet times, wider when the market breathes more.
Step 6: Set Realistic Take-Profits
Split your position into two targets:
- Target 1 is the midpoint of the range. Once hit, move your stop to breakeven. This locks in a “free trade.”
- Target 2 is the opposite boundary of the range. This gives you more profit potential while still protecting downside.
Taking profits in stages like this helps balance your win rate with your risk-reward ratio and avoids the frustration of watching green trades turn red.
Step 7: Respect the Breakout
Eventually, every range ends. Price will break out, and when it does, you need to switch gears fast.
If a candle closes beyond the range by more than 1 × ATR, exit any active range-fade trades immediately.
You can then wait for a pullback and look to trade in the direction of the breakout turning a failed range into a breakout entry opportunity.
Use the violated boundary as your new stop level, giving the breakout room to breathe.
Step 8: Stick to a Smart Risk Management Plan
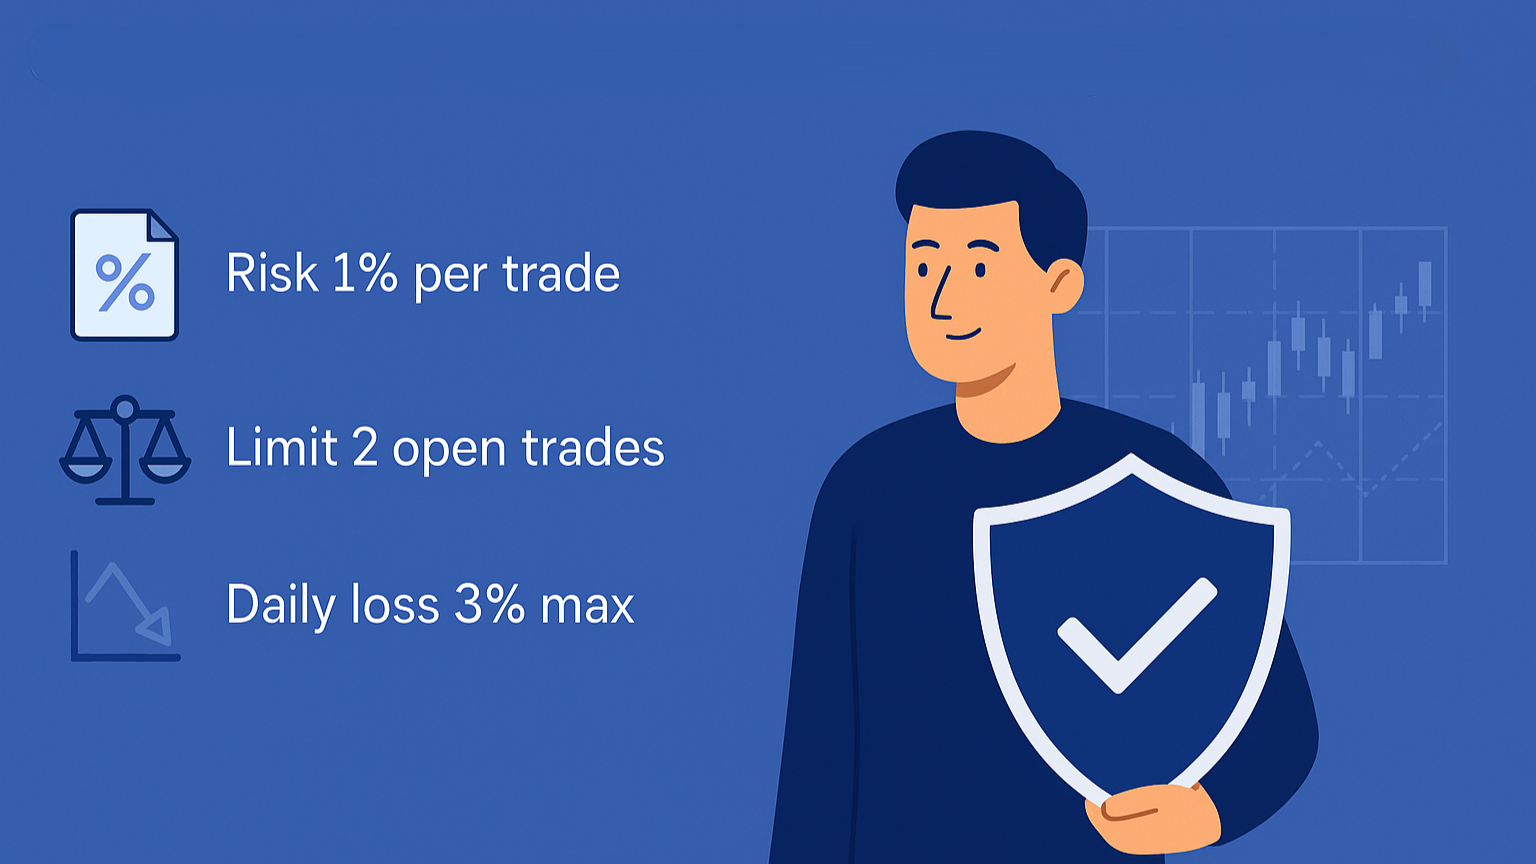
No strategy works without solid money management.
Risk no more than 1% of your account per trade idea. If you’re trading multiple setups within the same range, limit yourself to two open trades max.
Cap your daily loss at 3%, so even if you have a rough day, you live to trade another.
This protects you from drawdowns, keeps emotions in check, and ensures you’re around long enough to benefit from the strategy’s edge.
With this structured, step by step approach, you’ll stop guessing and start trading with precision. Ranges will no longer feel confusing they’ll become clear, repeatable opportunities for steady profits.
Free MT4/MT5 Range Detector Indicator
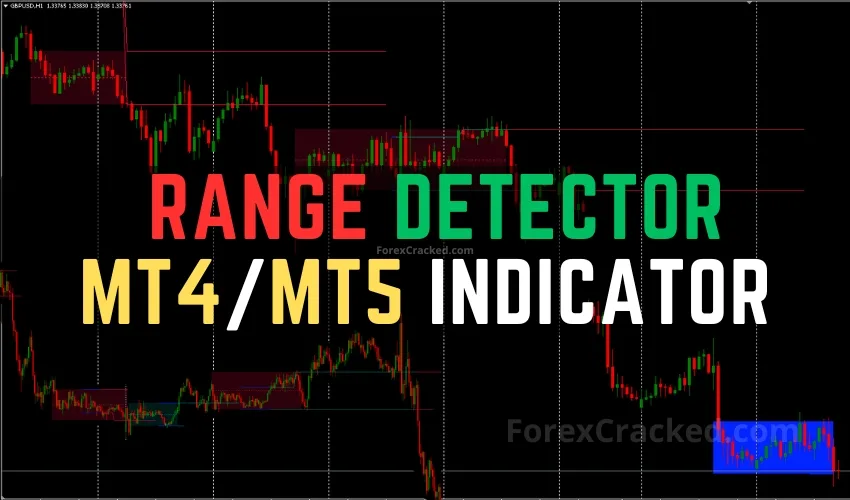
While the range trading strategy we’ve covered so far can be used manually on any platform, MetaTrader 4 and 5 users can save time and boost accuracy with the help of the Range Detector Indicator a powerful free tool that visually maps out consolidation zones and breakout conditions in real time.
If you’ve ever struggled with manually identifying clean ranges or drawing support and resistance levels, this indicator does the heavy lifting for you.
What the Range Detector Does
This tool is designed to help you detect high probability range setups with minimal guesswork. Here’s how it adds value to your strategy:
- Auto-detects consolidation zones – It scans price action continuously and shades valid ranges as soon as they form, saving you the trouble of manual box-drawing.
- Draws live support and resistance lines – These boundaries are shown in blue while the range is active, giving you immediate visual confirmation.
- Color coded breakout alerts – Once price breaks above or below the range, green lines signal a bullish breakout and red lines show a bearish escape. This helps you respond quickly without second-guessing.
- Leaves behind S/R “memory” zones – Even after the range breaks, the indicator leaves a permanent record of the box, helping you identify future reaction zones or pivot levels.
- Works in all market conditions – It adapts to current volatility using ATR (Average True Range), making it useful across currency pairs and timeframes.
How to Tune the Settings for Best Results
To get the most from the Range Detector, you can tweak a few key settings:
- Minimum Range Length – Set this to around 20 candles on the H1 timeframe. Increase it if you want to filter out short, noisy ranges.
- Range Width (ATR Multiplier) – A value of 1.0 works well by default. If markets are more volatile (like during major news weeks), increase this to 1.5 or 2.0 to avoid false ranges.
- ATR Length – Keep it at 14 for standard use. For lower timeframes like M15, shorten it to 7 for quicker but slightly more reactive detection.
How to Use It Within the Strategy
Using the indicator alongside the strategy is simple and powerful:
- Wait for a valid box to appear highlighted with a blue band. Make sure it aligns with your own manual analysis.
- Use the midpoint line as your first profit target. This is automatically plotted, saving you a calculation step.
- Watch for breakouts if a green or red line appears, treat it as confirmation that the range has broken. Then follow Step 7 of the main strategy to either exit or switch into breakout mode.
Remember: the Range Detector is a smart assistant, not a trading robot. Use it to speed up your workflow and improve consistency, but always combine it with your own chart-reading skills and trade plan.
Frequently Asked Questions About Forex Range Trading
Q1. Does range trading work during major news events?
Not reliably. High-impact news like interest rate decisions, CPI reports, or NFP can cause sudden volatility spikes that break through both support and resistance levels. It’s best to exit range trades at least one hour before such events and wait for the market to stabilize.
Q2. Which session is best for range trading?
The Asian session (22:00–02:00 UTC) tends to be the most range bound and stable. Volatility is lower, and price often respects technical levels. This makes it ideal for fading the edges of a defined range.
Q3. Can I automate this range trading strategy?
Yes. You can build an EA (Expert Advisor) that reads objects drawn by the Range Detector Indicator and executes trades based on entry, stop loss, and take profit rules. Be sure to test your bot thoroughly in demo before using it on a live account.
Q4. What’s the typical win rate for range trading strategies?
A well-tested range system usually delivers a 45–55% win rate, depending on the quality of your setup filters and execution. However, because the strategy often uses 1:1.5 or better risk-to-reward, it can still generate positive expectancy even with a lower win ratio.
Q5. How do I avoid fake or weak ranges?
Use a Minimum Range Length of at least 15 20 candles and make sure price has tested both edges multiple times. Confirm with ATR that volatility is low, and watch for clean structure not choppy, irregular moves.
Q6. What timeframes are best for range trading?
The 1 hour (H1) and 4 hour (H4) charts are ideal for spotting tradable ranges. They filter out noise while still providing multiple setups per week. Lower timeframes like M15 can work but may result in more false signals unless your filters are strict.
Q7. Is this strategy beginner-friendly?
Yes. Range trading is one of the simplest ways for new traders to learn market structure, discipline, and risk management. The rules are clear, repeatable, and based on observable price action not complex indicators or subjective trend lines.
Q8. Can I use this with other indicators or confluence tools?
Absolutely. Many traders combine range setups with tools like RSI divergence, volume spikes, or higher timeframe trend bias to improve accuracy. Just be sure not to overcomplicate the system.
Q9. What should I do when a range breaks out?
Follow the breakout protocol in the main strategy. If price closes beyond the range by more than 1 × ATR, close your fade trade. You can either stay out and wait for the next setup or enter in the direction of the breakout on a clean retest, using the broken level as your new stop-loss reference.
Q10. How many trades can I take in one range?
Limit yourself to two trades per range setup to avoid overexposing your account. Stick to the 1% risk rule per trade and manage your daily drawdown carefully. Quality over quantity wins long-term.
Final Thoughts: Master the Range, Master the Game
Sideways markets don’t have to be your enemy. While most traders get frustrated and lose money during consolidation, you now have the tools to turn those quiet zones into a consistent edge.
By following this step-by-step range trading strategy rooted in real price behavior and backed by volatility logic you can approach the market with clarity, discipline, and confidence. And with the help of the Range Detector Indicator on MT4/MT5, spotting trade ready ranges becomes faster and more accurate.
Remember: trading isn’t about constant action it’s about smart action. Ranging markets reward patience, precision, and control. When you stop chasing breakouts and start trading the structure right in front of you, everything changes.
So the next time you see price bouncing between invisible walls, don’t freeze.
That’s not a dead chart it’s your opportunity waiting.