
If you’ve spent any time trading Forex, you’re aware that prices don’t move in straight lines. It pauses, consolidates, and then—boom—it breaks out. One of the clearest signs that something big is brewing? Triangle patterns. Instead of manually trying to spot them (which can be hit or miss), I now rely on the Triangle Pattern Forex Indicator for MT4 to do the job accurately and instantly.
This indicator automatically detects and draws triangle chart patterns—ascending, descending, and symmetrical—right on your chart. If you’re a price action trader or even just someone trying to simplify their entry timing, this tool is a game-changer.
Let me walk you through how I use it in my trading.
What Is the Triangle Pattern Indicator?
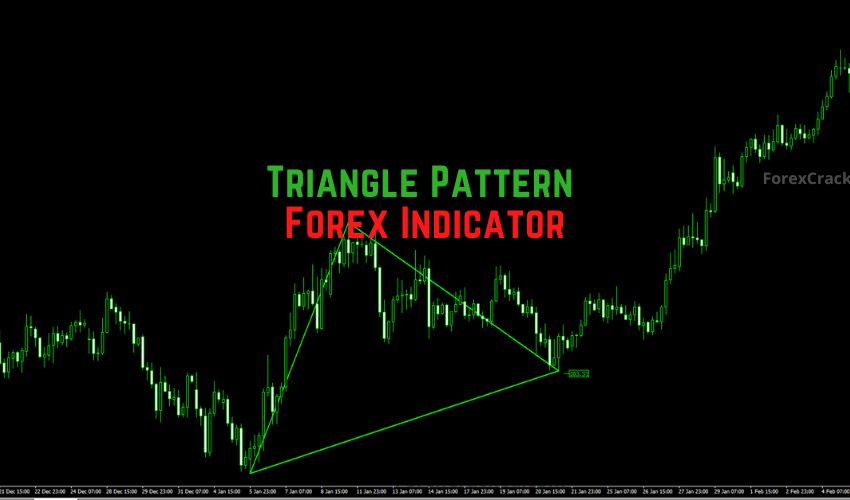
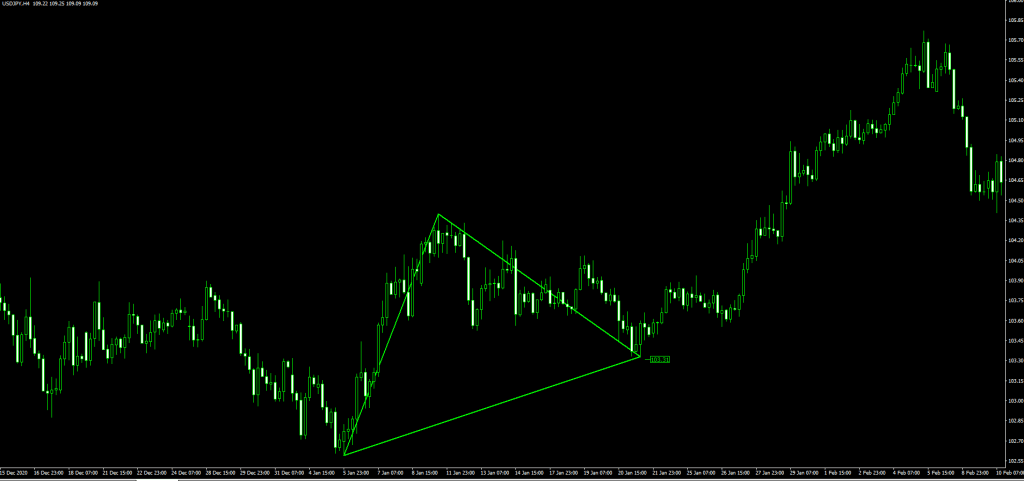
At its core, the Triangle Pattern Indicator is designed to scan your MT4 charts and identify consolidation zones shaped like triangles, which usually signal a continuation of the prevailing trend.
It connects swing highs and swing lows with upper and lower trendlines to form the triangle structure. The great part? You don’t need to squint at your screen and draw trendlines yourself. The indicator does it for you—precisely and consistently.
And yes, it identifies:
- Ascending Triangles (bullish continuation)
- Descending Triangles (bearish continuation)
- Symmetrical Triangles (can break either way)
How I Trade the Triangle Pattern
When I’m trading on higher timeframes, such as H1, H4, or Daily, this indicator helps me spot setups in advance. Here’s my basic approach:
Buy Setup:
- Look for an ascending triangle in an uptrend.
- Wait for a clean breakout above the upper trendline.
- Enter the trade after breakout confirmation (i.e., a candle closes outside the triangle).
- Place a stop loss just below the lower trendline.
- Target the next resistance level or a 1:2 risk/reward zone.
Sell Setup:
- Spot a descending triangle in a downtrend.
- Wait for the price to break decisively below the lower trendline.
- Enter short after confirmation.
- The stop loss is set above the upper trendline.
- Take profit near recent support or with a trailing stop.


Symmetrical triangles require more caution. I like to wait for a strong breakout candle in either direction and only enter after the first retest.
While the Triangle Pattern Indicator is pretty reliable on its own, I typically combine it with a Moving Average or MACD for added confirmation.
Why This Indicator Works
The beauty of triangle patterns is that they compress price action—think of them like a pressure cooker. When the breakout finally comes, the move tends to be strong. This indicator helps you:
- Spot setups faster (no more guessing!)
- Trade with the trend
- Reduce noise by focusing only on clear consolidation patterns
- Improve entry timing without relying on lagging indicators
Free Download Triangle Pattern Indicator for MT4
Read More ICT Kill Zones Indicator MT4/MT5 FREE Download
Final Thoughts
The Triangle Pattern Indicator for MT4 is one of those tools I wish I had when I first started trading. It simplifies a complex task—identifying continuation patterns—and does it with a clean interface and no repainting after the candle closes.
Whether you’re day trading or swing trading, this indicator gives you real, actionable setups. And the best part? It’s free to download.
My recommendation: Always pair the indicator with basic support and resistance analysis or use it alongside MACD/EMA for improved trade confirmation.