
If you’ve been Forex trading for a while, you know the role support and resistance zones play in decision-making. Now, instead of manually drawing those levels every session, what if I told you there’s an indicator that automatically plots high-probability zones based on the actual price structure? That’s exactly what the Fractal Support and Resistance Indicator for MT4 brings to the table.
Let me walk you through how I use this tool and how you can easily fit it into your day trading or swing strategy.
What is the Fractal Support and Resistance Indicator?
This indicator builds horizontal support and resistance lines based on fractal highs and lows rather than just daily pivot points. It’s a big shift if you’re used to pivot-based strategies, because fractals give you zones that are more in tune with price behavior, especially in volatile or ranging markets.
Fractals are already a go-to for many swing traders. But what this indicator does is connect those fractal reversal points and turn them into usable horizontal channels. That means you don’t have to draw lines manually; this tool does it for you, cleanly and automatically.
How It Works on the Chart
The best part? It’s super clean.
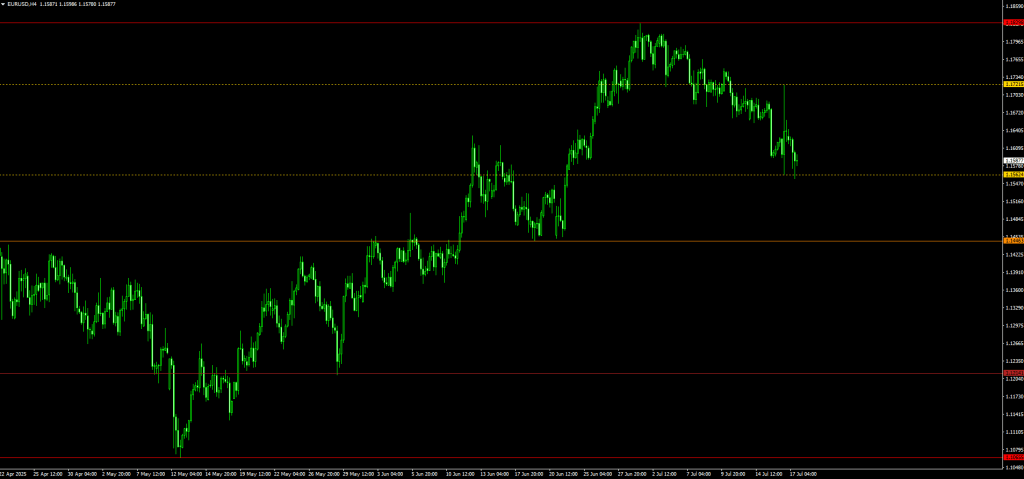
- Dotted fractal lines show weekly support and resistance levels.
- Bold, colored lines represent strong intraday zones.
- Works on all timeframes (yes, it’s MTF-friendly).
- It’s non-repaint, meaning once the levels are drawn, they don’t shift after the candle closes.
Imagine you’re watching the EUR/USD on a 4H chart. The price comes up and touch a bold fractal resistance line. You see a bearish pin bar right at that zone. Boom, that’s your signal to genter short trade. In a ranging market, this kind of setup is gold.


Trading Strategy with Fractal S&R
Reversal Strategy:
- Look for pin bars or engulfing candles at the fractal support and resistance.
- If a bullish pin bar forms at fractal support, I enter buy trade.
- If a bearish pin bar shows up at fractal resistance, I enter sell trade.
- Always put your stop loss just beyond the fractal level for tight risk control.
Breakout Strategy:
- Wait for price to break and close above a fractal resistance (bullish) or below a fractal support (bearish).
- Confirm with momentum or volume-based indicators, such as RSI or MACD.
- You can even set an MT4 alert to notify you when the price reaches a key fractal level, a massive time-saver.
Why I Like This Indicator
- No repainting: That’s a huge plus. What you see is what you get.
- Intraday and swing friendly: Works just as well on M5 as it does on H4 or D1.
- Pairs beautifully with price action, especially for traders who focus on candlestick signals.
- Helps avoid false breakouts by keeping you focused on true supply and demand zones.
Whether I’m planning a quick scalp or holding a swing trade for a couple of days, these levels act like magnets. Price always respects them, rejects them, or breaks them, and that’s where i like to trade.
Free Download Fractal Support and Resistance Indicator
Read More Range Detector Indicator MT4/MT5 FREE Download
Final Thoughts
The Fractal Support and Resistance Indicator for MT4 isn’t just another line indicator; it’s a reliable indicator that keeps your chart clean and your decision-making grounded in actual market structure.
If you’re someone who prefers price action, non-repainting signals, and clarity in your technical analysis, this forex indicator is worth adding to your trading toolkit.
Whether you’re a beginner learning the ropes of forex trading or an experienced trader looking for structure-based setups, this indicator can help you find clean reversal zones, plan breakouts and trade with confidence.
Nice one !
add smc / order block /FVG / and will be better