
Introduction: The “Account Killer” No One Talks About
You have seen it happen a hundred times. You spot a perfect buy signal on your Moving Average or MACD. You enter the trade. The price moves up five pips, then crashes down 10 pips, then shoots back up. You get stopped out, and your account bleeds slowly.
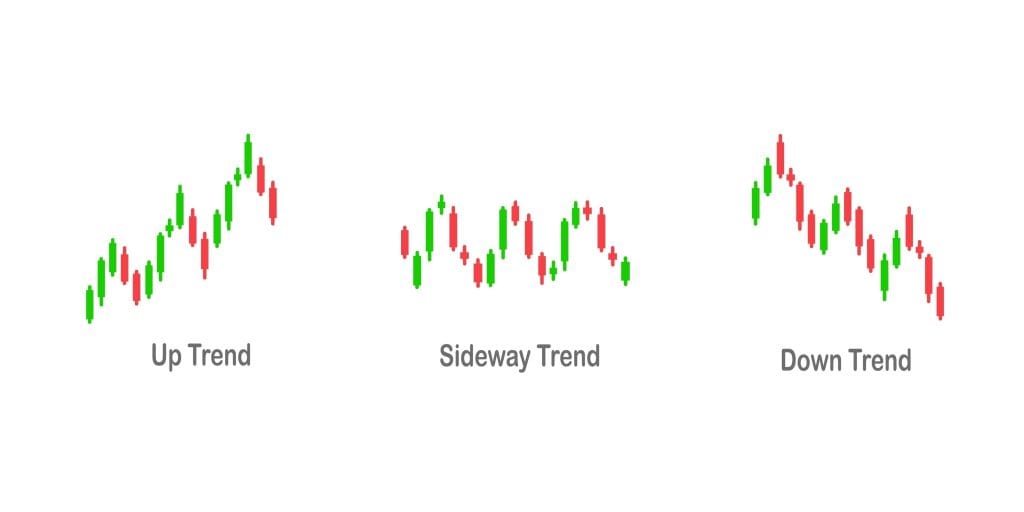
This is called the “Sideways Chop.”
The biggest reason traders fail isn’t that they don’t know how to trade a trend; it’s that they don’t know when to SIT ON THEIR HANDS.
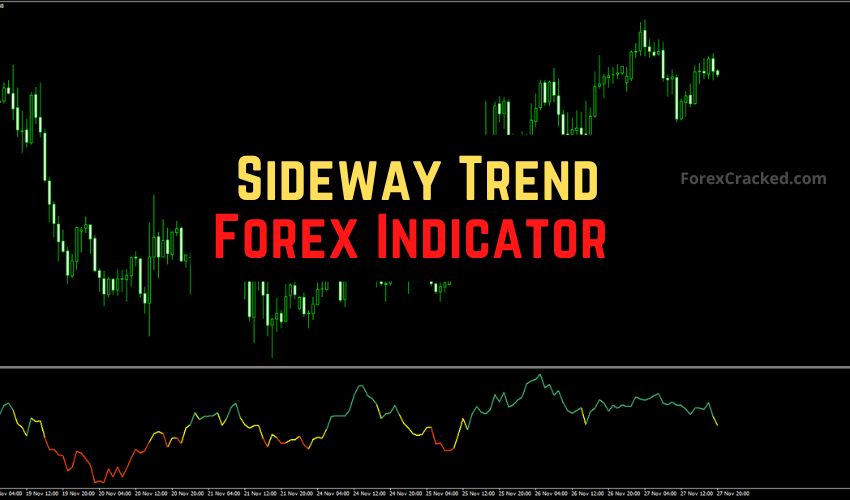
The Sideway Trend Indicator for MetaTrader 4 (MT4) is the solution. It is a specialized tool designed to do one thing: tell you when the market is “flat.” By identifying these zones, you can either switch to a Range Scalping strategy or, more importantly, stay out of the market until the real move begins.
This review covers exactly how it works, the best settings for 2025, and our “Box Breakout” strategy to catch the explosion after the calm.
What is the Sideway Trend Indicator?
The Sideway Trend Indicator is a technical analysis tool that scans price action for a lack of directional momentum. Unlike standard oscillators (like RSI), which go up and down, this indicator specifically looks for “Price Compression.”
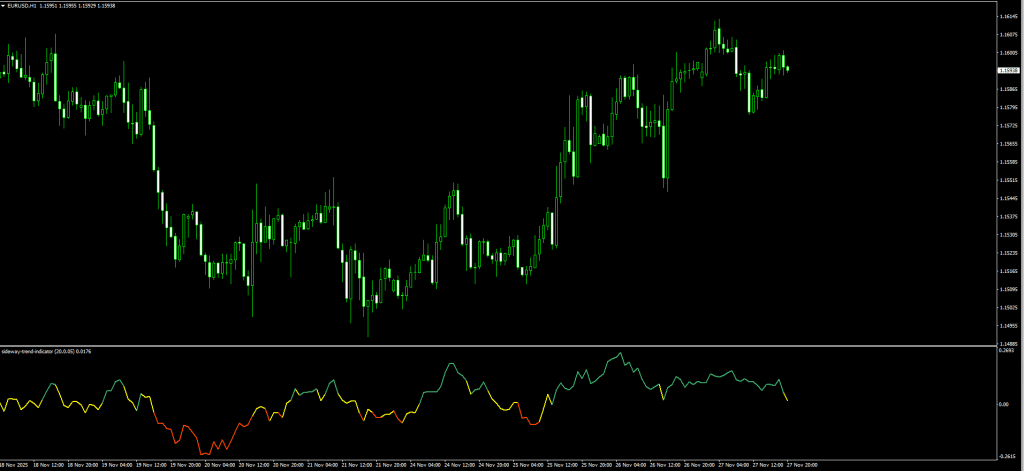
It usually appears as a histogram or a line oscillating around a “Neutral Level” (Zero Line) in a separate window below your chart.
How to Read the Signals:
- The “Flat” Zone: When the indicator line hovers closely around 0.00 (or within the neutral bands), the market is in a Sideways Trend. This means buyers and sellers are at war, but neither side is winning.
- The “Active” Zone: When the indicator spikes away from the zero line, it signals that volatility is returning and a trend (up or down) is emerging.
Note: This is NOT a Buy/Sell signal generator. It is a “Traffic Light.”
- Red Light (Sideways): Stop trend trading.
- Green Light (Active): Resume trend trading.
- Shutterstock
- Explore
Review: Pros and Cons of the Sideway Trend Indicator
Is this tool worth adding to your chart? Here is our honest verdict after testing it on the EUR/USD and Gold (XAU/USD) pairs.
PROS (The Good)
- Saves Money: It prevents you from entering bad trades during low-volume hours (like the Asian Session).
- Visual Clarity: Instantly tells you whether the market is “dead” without drawing manual trendlines.
- Versatile: Works on any timeframe, but excels on M15 and H1.
- Great Filter: The perfect companion for Trend Following EAs (Expert Advisors).
CONS (The Bad)
- Lag: It takes a few candles to realize the market has gone flat.
- Not a Trigger: You cannot trade off this indicator alone; you need a strategy (which we provide below).


Indicator Settings: Tuning It for 2025
Depending on the specific version of the Sideway_Trend.ex4 file you download, you will see a few inputs. Here is how to optimize them:
- Period (Default: 14 or 20):
- Recommendation: Increase this to 24 if you are trading volatile pairs like GBP/JPY. This filters out “fake” flat periods that are just short pauses.
- Threshold / Deviation:
- Recommendation: If your version has a “Threshold” setting, tighten it. A smaller threshold forces the market to be truly flat before the indicator alerts you, ensuring you only catch the tightest ranges (which lead to the biggest breakouts).
- Alerts:
- Recommendation: Turn “Breakout Alerts” to True. You want to be notified when the market wakes up.
The Strategy: The “Box Breakout” System
Since the Sideway Trend indicator tells us when the market is sleeping, our strategy is to wait for it to wake up.
The Concept: Markets move in cycles: Expansion (Trend) → Contraction (Sideways) → Expansion (Trend). The longer the market is Sideways, the more explosive the breakout will be.
Tools Required:
- Sideway Trend Indicator (Download below).
- Bollinger Bands (Default settings: 20, 2).
- Rectangle Tool (Standard in MT4).
Step 1: The “False Check” (Identifying the Trap)
Before looking for a trade, we must confirm the market is actually stuck.
- Check the Indicator: Is the Sideway Trend line hugging the Zero level?
- Check the Bollinger Bands: Are the bands “squeezing” (narrowing) around the price?
- Action: If YES, draw a Rectangle Box around the Highs and Lows of this price range. DO NOT TRADE YET.
Step 2: The Buy Setup (Breakout)
- Wait for the Sideway Trend indicator to spike up (showing volume/volatility is returning).
- Wait for a strong Green Candle to close ABOVE the top of your drawn Rectangle Box.
- Entry: Buy at the close of that breakout candle.
- Stop Loss: Place it back inside the box (about halfway down) or below the recent low.
- Take Profit: Measure the height of the box (e.g., 20 pips) and aim for that same distance upwards (1:1 or 1:2 Risk Reward).
Read More Bollinger Bands Breakout Strategy: Step-by-Step Forex Guide
Step 3: The Sell Setup (Breakdown)
- Wait for the Sideway Trend indicator to spike (showing volatility).
- Wait for a strong Red Candle to close BELOW the bottom of your drawn Rectangle Box.
- Entry: Sell at the close of that breakout candle.
- Stop Loss: Place it back inside the box (about halfway up).
- Take Profit: Set the same distance as the box’s height.
Pro Tip: If the breakout candle has a long wick (tail) and closes back inside the box, ABORT. This is a “Fakeout.”
When to Use This for “Scalping” (Range Trading)
If you are a scalper, you can do the opposite. When the Sideway Trend indicator shows a flat market:
- Buy when the price touches the Bottom of the box.
- Sell when the price touches the Top of the box.
- Exit immediately if the indicator signals a breakout.
Warning: This requires fast execution and low spreads.
How to Install the Sideway Trend Indicator
- Download the file below (Sideway_Trend.ex4 or .mq4).
- Open your MetaTrader 4 platform.
- Go to File > Open Data Folder.
- Navigate to MQL4 > Indicators.
- Paste the file into this folder.
- Restart MT4 or refresh your Navigator window.
- Drag the indicator onto your chart.
FAQ: Frequently Asked Questions
Can I use this on Gold (XAUUSD)?
Yes! Gold consolidates often before big moves. This indicator is excellent for identifying the “calm before the storm” on Gold H1 charts.
Does it repaint?
The concept of “repainting” doesn’t strictly apply here because it’s measuring real-time volatility. However, the line may fluctuate slightly as the candle forms. Always wait for the candle Close.
What is the best timeframe?
M15 and H1 are best. On M1, the “sideways” trends are often just noise. Daily, the ranges can last for months, which is too slow for most retail traders.
Final Verdict: Should You Use It?
Sideway Trend Indicator
Summary
The Sideway Trend Indicator is not flashy. It won’t give you 100 buy signals a day. But it is one of the most useful Utility indicators you can own.
By forcing you to recognize when the market is indecisive, it saves you from over-trading and protects your capital for the high-probability breakouts. If you hate getting stopped out in choppy markets, download this tool.
[Mirror Download Sideway Trend Indicator Here]
(Suggested Video: “How to Trade the Bollinger Band Squeeze”) This concept perfectly visualizes the “Box Breakout” strategy we just discussed.