
Introduction: The “Smoother” Way to Trade Reversals
We all know the struggle with the standard Stochastic Oscillator. It’s too jerky. It hits “Overbought” and stays there for days while the trend keeps going, or it crosses ten times in an hour, chopping your account to pieces.
Enter the SMI (Stochastic Momentum Index) Ergodic Oscillator.
Available for both MetaTrader 4 and MetaTrader 5, this tool is the sophisticated cousin of the standard Stochastic. It uses the True Strength Index (TSI) formula to double-smooth the price data.
The result? A cleaner, less noisy signal that helps you catch the “meat” of the trend while filtering out the fakeouts that kill most reversal traders.
If you are looking for a reliable “Trend Wave” indicator that works on everything from Stocks to Forex, this review is for you.
What is the SMI Ergodic Oscillator?
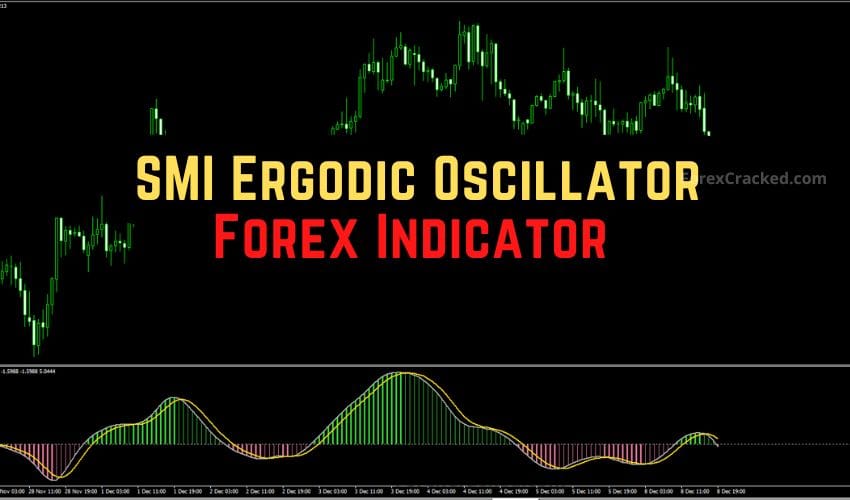
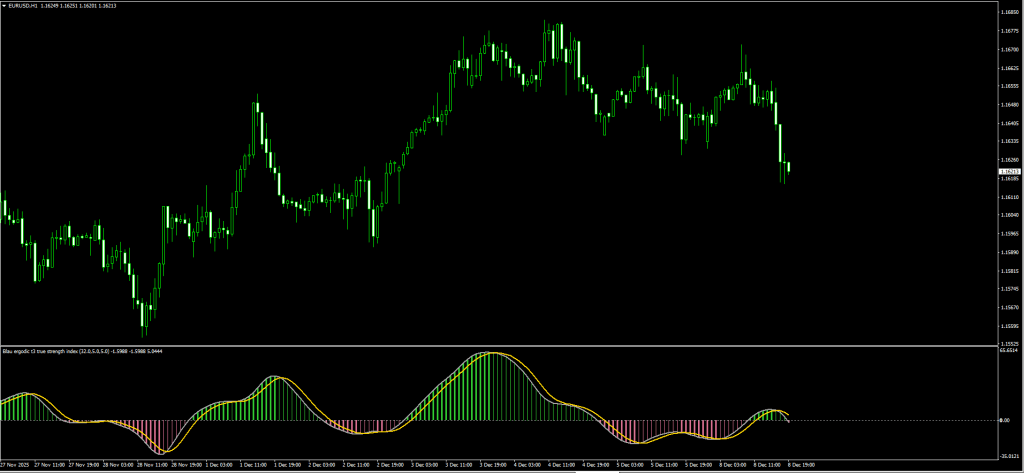
The SMI Ergodic Oscillator is a momentum tool that sits in a separate window below your chart. Unlike standard oscillators that are bounded between 0 and 100, the SMI Ergodic oscillates around a Zero Line.
It is composed of three visual parts that tell a complete story:
- The Gray Line (TSI): This is the core price momentum line.
- The Yellow Line (Signal): This is a smoothed moving average of the TSI.
- The Histogram: This provides an instant visual heat map of the trend.
- Thick Green: Bullish Momentum (Rising above Zero).
- Thin Green: Bullish but Weakening (Falling towards Zero).
- Thick Red: Bearish Momentum (Falling below Zero).
- Thin Red: Bearish but Weakening (Rising towards Zero).
The Logic: When the TSI (Gray) crosses the Signal (Yellow), it signals a shift in momentum. When combined with the Histogram color, it gives you a roadmap of who is in control: Buyers or Sellers.
SMI Ergodic vs. Standard Stochastic
Why bother downloading a custom indicator? Here is why the SMI beats the default tools:
| Feature | Standard Stochastic | SMI Ergodic Oscillator |
| Smoothing | Low (Very sensitive to noise) | High (Double-smoothed TSI) |
| Range | 0 to 100 (Bounded) | Unbounded (Around Zero) |
| False Signals | High frequency | Lower frequency |
| Best For | Scalping Ranges | Trend Following & Deep Pullbacks |
Verdict: If you are a scalper who loves chaos, stick to Stochastic. If you are a swing trader who wants fewer, higher-quality signals, switch to SMI Ergodic.
Review: Pros and Cons
Here are our honest test results after running this on MT4 and MT5 charts.
✅ PROS (The Good)
- Dual Platform: Available for both MT4 and MT5.
- Non-Repainting: Once the candle closes, the histogram and lines are locked in.
- Divergence Hunter: Because it is smoother, spotting Divergence between price and the oscillator is much easier.
- Visual Alerts: The histogram color change makes it impossible to miss a trend shift.
❌ CONS (The Bad)
- The “Lag” Factor: Because it is “double-smoothed,” the entry signal comes slightly later than a raw Stochastic. (We fix this with the strategy below.)
- Not a Standalone: You cannot trade off the crossover without a trend filter.
The Strategy: The “Ergodic Wave” System
The sample strategy suggests buying when lines cross, but that is dangerous in a choppy market. To rank this strategy among the best, we apply a “False Check” Filter.
We will use the 200 Exponential Moving Average (EMA) to identify the dominant trend. We only take SMI signals that align with the 200 EMA.
Setup & Settings
- SMI Ergodic Oscillator: Default Settings.
- 200 EMA: Applied to Close (Main Chart).
- Timeframe: H1 or H4 (Best for capturing big waves).
1. The “Wave” Buy Setup
We are looking to buy the “dip” in an uptrend.
- The Filter: Price must be strictly ABOVE the 200 EMA. This confirms the trend is Bullish.
- The Setup: Wait for the SMI lines to drop BELOW Zero (into the negative zone). This represents the “pullback.”
- The Trigger: Wait for the Gray TSI Line to cross ABOVE the Yellow Signal Line.
- Confirmation: The Histogram should flip to Green.
- Entry: Buy at the candle’s close.
- Stop Loss: Below the recent swing low.
- Take Profit: Hold until the SMI lines cross back down OR price hits a resistance level.
2. The “Wave” Sell Setup
We are looking to sell the “rally” in a downtrend.
- The Filter: Price must be strictly BELOW the 200 EMA. This confirms the trend is Bearish.
- The Setup: Wait for the SMI lines to rise ABOVE Zero (into the positive zone). This represents the “correction.”
- The Trigger: Wait for the Gray TSI Line to cross BELOW the Yellow Signal Line.
- Confirmation: The Histogram should flip to Red.
- Entry: Sell at the close of the candle.
- Stop Loss: Above the recent swing high.
- Take Profit: Hold until the SMI lines cross back up.
Pro Tip: If the SMI lines cross but are hovering exactly on the Zero line (flat), DO NOT TRADE. This indicates a lifeless, ranging market. Wait for the lines to separate clearly.


Indicator Settings: Optimizing for 2025
Whether you use MT4 or MT5, the input parameters allow for deep customization.
- Long_Period (Default: 20):
- Controls the long-term trend smoothing. Increase to 32 for Swing Trading to filter out noise.
- Short_Period (Default: 5):
- Controls the sensitivity. Decrease to 3 for Scalping (faster signals).
- Signal_Period (Default: 5):
- This is the “Trigger” line. Keep this default.
How to Install (MT4 & MT5)
Since we provide both versions, ensure you install the correct file for your platform.
For MT4 Users:
- Download the .ex4 or .mq4 file.
- Go to File > Open Data Folder > MQL4 > Indicators.
- Paste the file.
For MT5 Users:
- Download the .ex5 or .mq5 file.
- Go to File > Open Data Folder > MQL5 > Indicators.
- Paste the file.
Remember to right-click “Navigator” and hit Refresh to see it!
FAQ: Frequently Asked Questions
Can I use the SMI Ergodic for Binary Options?
Yes. Because it clearly identifies momentum exhaustion, many Binary Options traders use the crossover as a signal for the next candle’s direction.
Does it repaint?
No. The SMI Ergodic is a non-repainting indicator. Once the candle closes, the histogram bar and line positions are permanent.
Which timeframe is best?
While it works on M5, we found the most accurate signals on H1 and H4. Daily charts are excellent for long-term investors using this tool.
Final Verdict: Is it Worth Using?
Score: 4.5/5 Stars ⭐⭐⭐⭐🌗
The SMI Ergodic Oscillator is a “must-have” upgrade for anyone currently using the standard Stochastic or MACD. By combining the responsiveness of an oscillator with the smoothness of a trend tool, you get the best of both worlds.
The fact that it is available for both MT4 and MT5 makes it a versatile tool for your 2025 trading toolkit. Just remember to use the 200 EMA filter to stay safe!
This indicator was featured in our Top 10 Best Free MT4 Indicators for 2026 — read the full comparison with expert reviews and trading strategies.
Hi Ghost, …. I can’t download the MT4 link of the SMI Ergodic Oscillator Indicator .. the link just takes me to an MT5 Indicator site? Please can you help as I would love to try this oscillator out, it would be grate to hear from you thank you for a great site