

Key Takeaways:
- The Problem: Standard indicators (RSI, MACD) lag; they tell you the past, not the future.
- The Solution: The Apex Triangle uses market geometry (Gann/Fibonacci principles) to project future time and price zones.
- The Strategy: A semi-automated “Click & Drag” method based on the 1-2-3 swing pattern.
In the Apex Triangle Strategy, precision is everything because in trading, “almost” doesn’t count. You can correctly predict that the EUR/USD is oversold, but if you enter three hours too early, your stop loss gets hunted moments before the market turns in your favor.
This is the classic trader’s dilemma: Right Direction, Wrong Timing.
Most technical indicators are derivative. They churn old data to tell you what has already happened. To catch a sniper-like entry, you need a tool that projects what is likely to happen based on the geometry of the market itself.
Apex Triangle Indicator.
Drawing on the legendary principles of W.D. Gann and refined for modern markets by Kirill Borovsky, this tool is designed to spot trend exhaustion. However, let’s be clear: This is not a “magic button.” It is a precision instrument that requires human skill to function.
In this guide, we are going deep. We will cover how to manipulate the vertices for maximum accuracy, how to interpret the projected zones, and crucially where this tool might fail if you aren’t careful.
Table of Contents
The Logic: Using Market Geometry for Trend Reversals
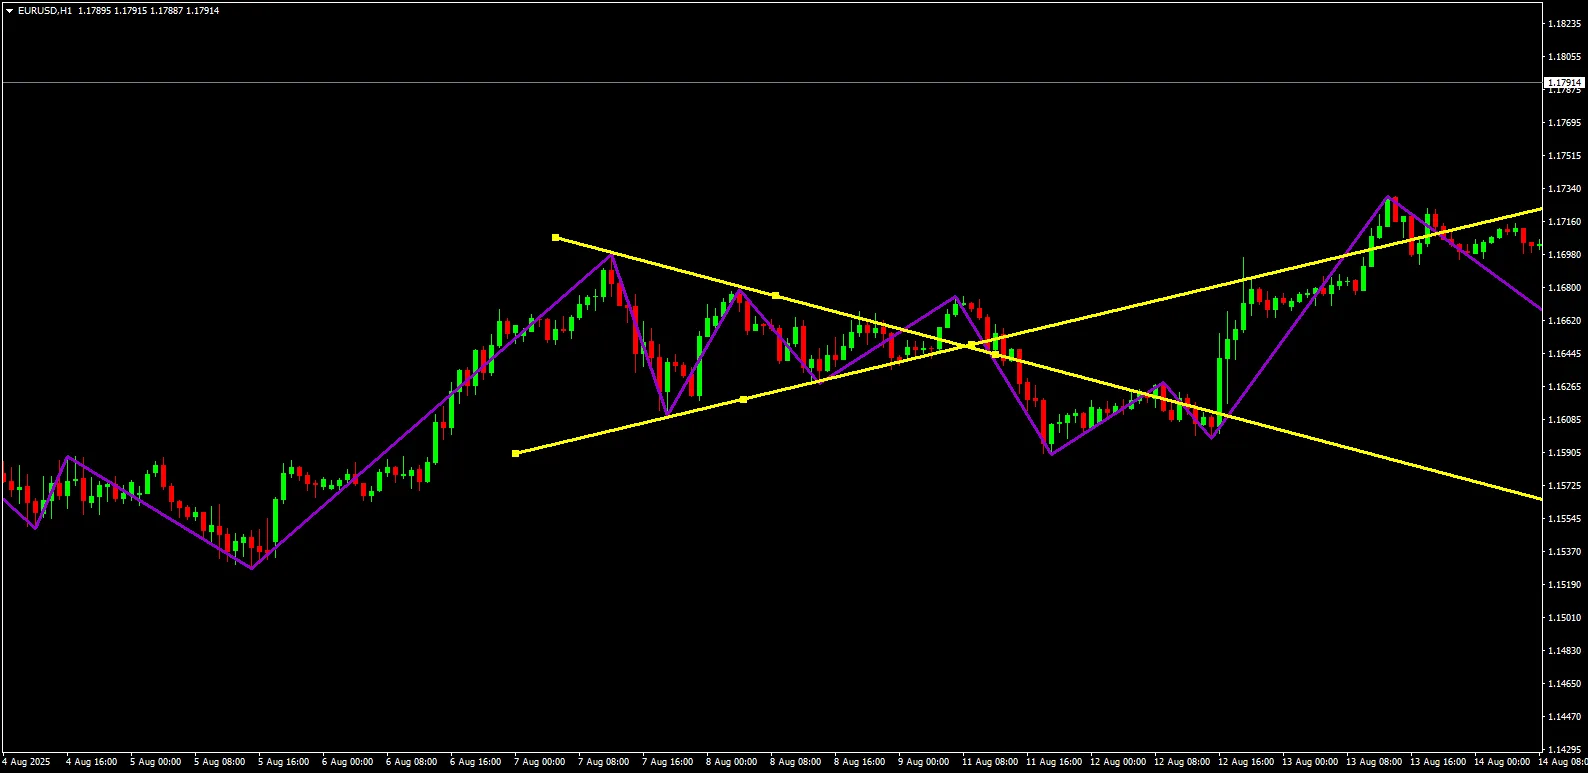
Before you open your terminal, you need to understand the “Why.” The Apex Triangle operates on the theory that price action is fractal, not random. When a market moves, it creates a structure specifically, a 1-2-3 Swing Pattern.
Think of this pattern as the DNA of a trend:
- Point 1: The Launchpad (Start of the move).
- Point 2: The Peak (Initial impulse).
- Point 3: The Higher Low (The retracement).
Why it works: Markets are driven by human psychology (fear and greed). These emotions tend to play out in repetitive cycles. The Apex Indicator measures the Time and Angle of your manual 1-2-3 setup to project the mathematical path of least resistance.
Apex Indicator Settings: Optimizing for MT4 & MT5
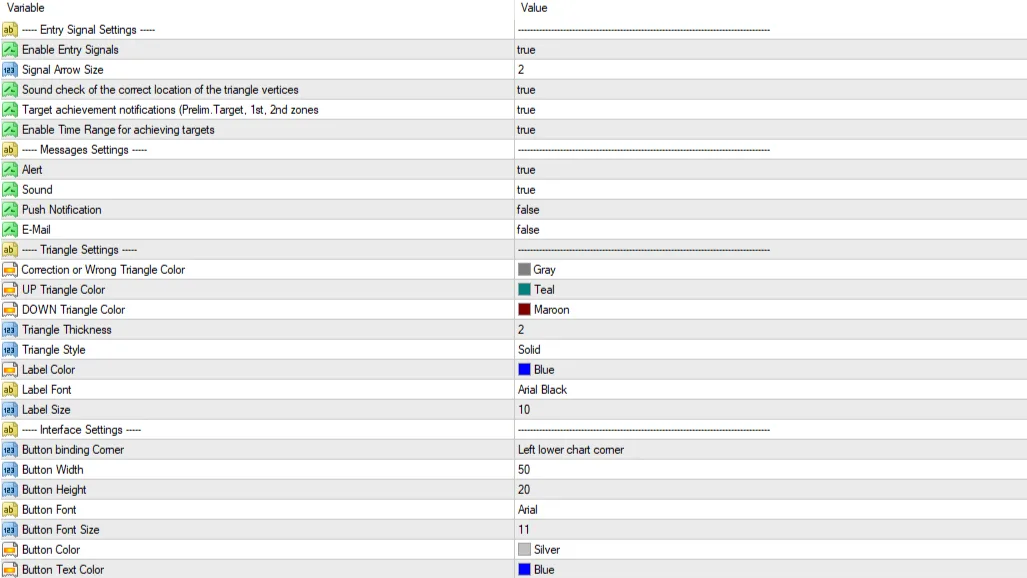
After installing the Apex Triangle Indicator on your MT4 or MT5 terminal, default settings won’t cut it for professional trading. Here is how to tune the engine:
A. The Alert System (Crucial for Psychology)
You cannot stare at the screen 24/7—that leads to overtrading.
- Push Notifications: Set to
True. This sends alerts to your mobile app. - Enable Entry Signals: Set to
True. This visual arrow confirms when price reacts to the triangle’s edge.
B. Visual Clarity
- Triangle Thickness: Change default
1to2. A thicker line ensures you don’t misread a breakout by a few ‘pippettes’. - Button Binding: If the controls overlap your other tools, move the
Button Binding Cornerin settings to the top-right or top-left.
How to Draw the Triangle: Mastering the 1-2-3 Pattern
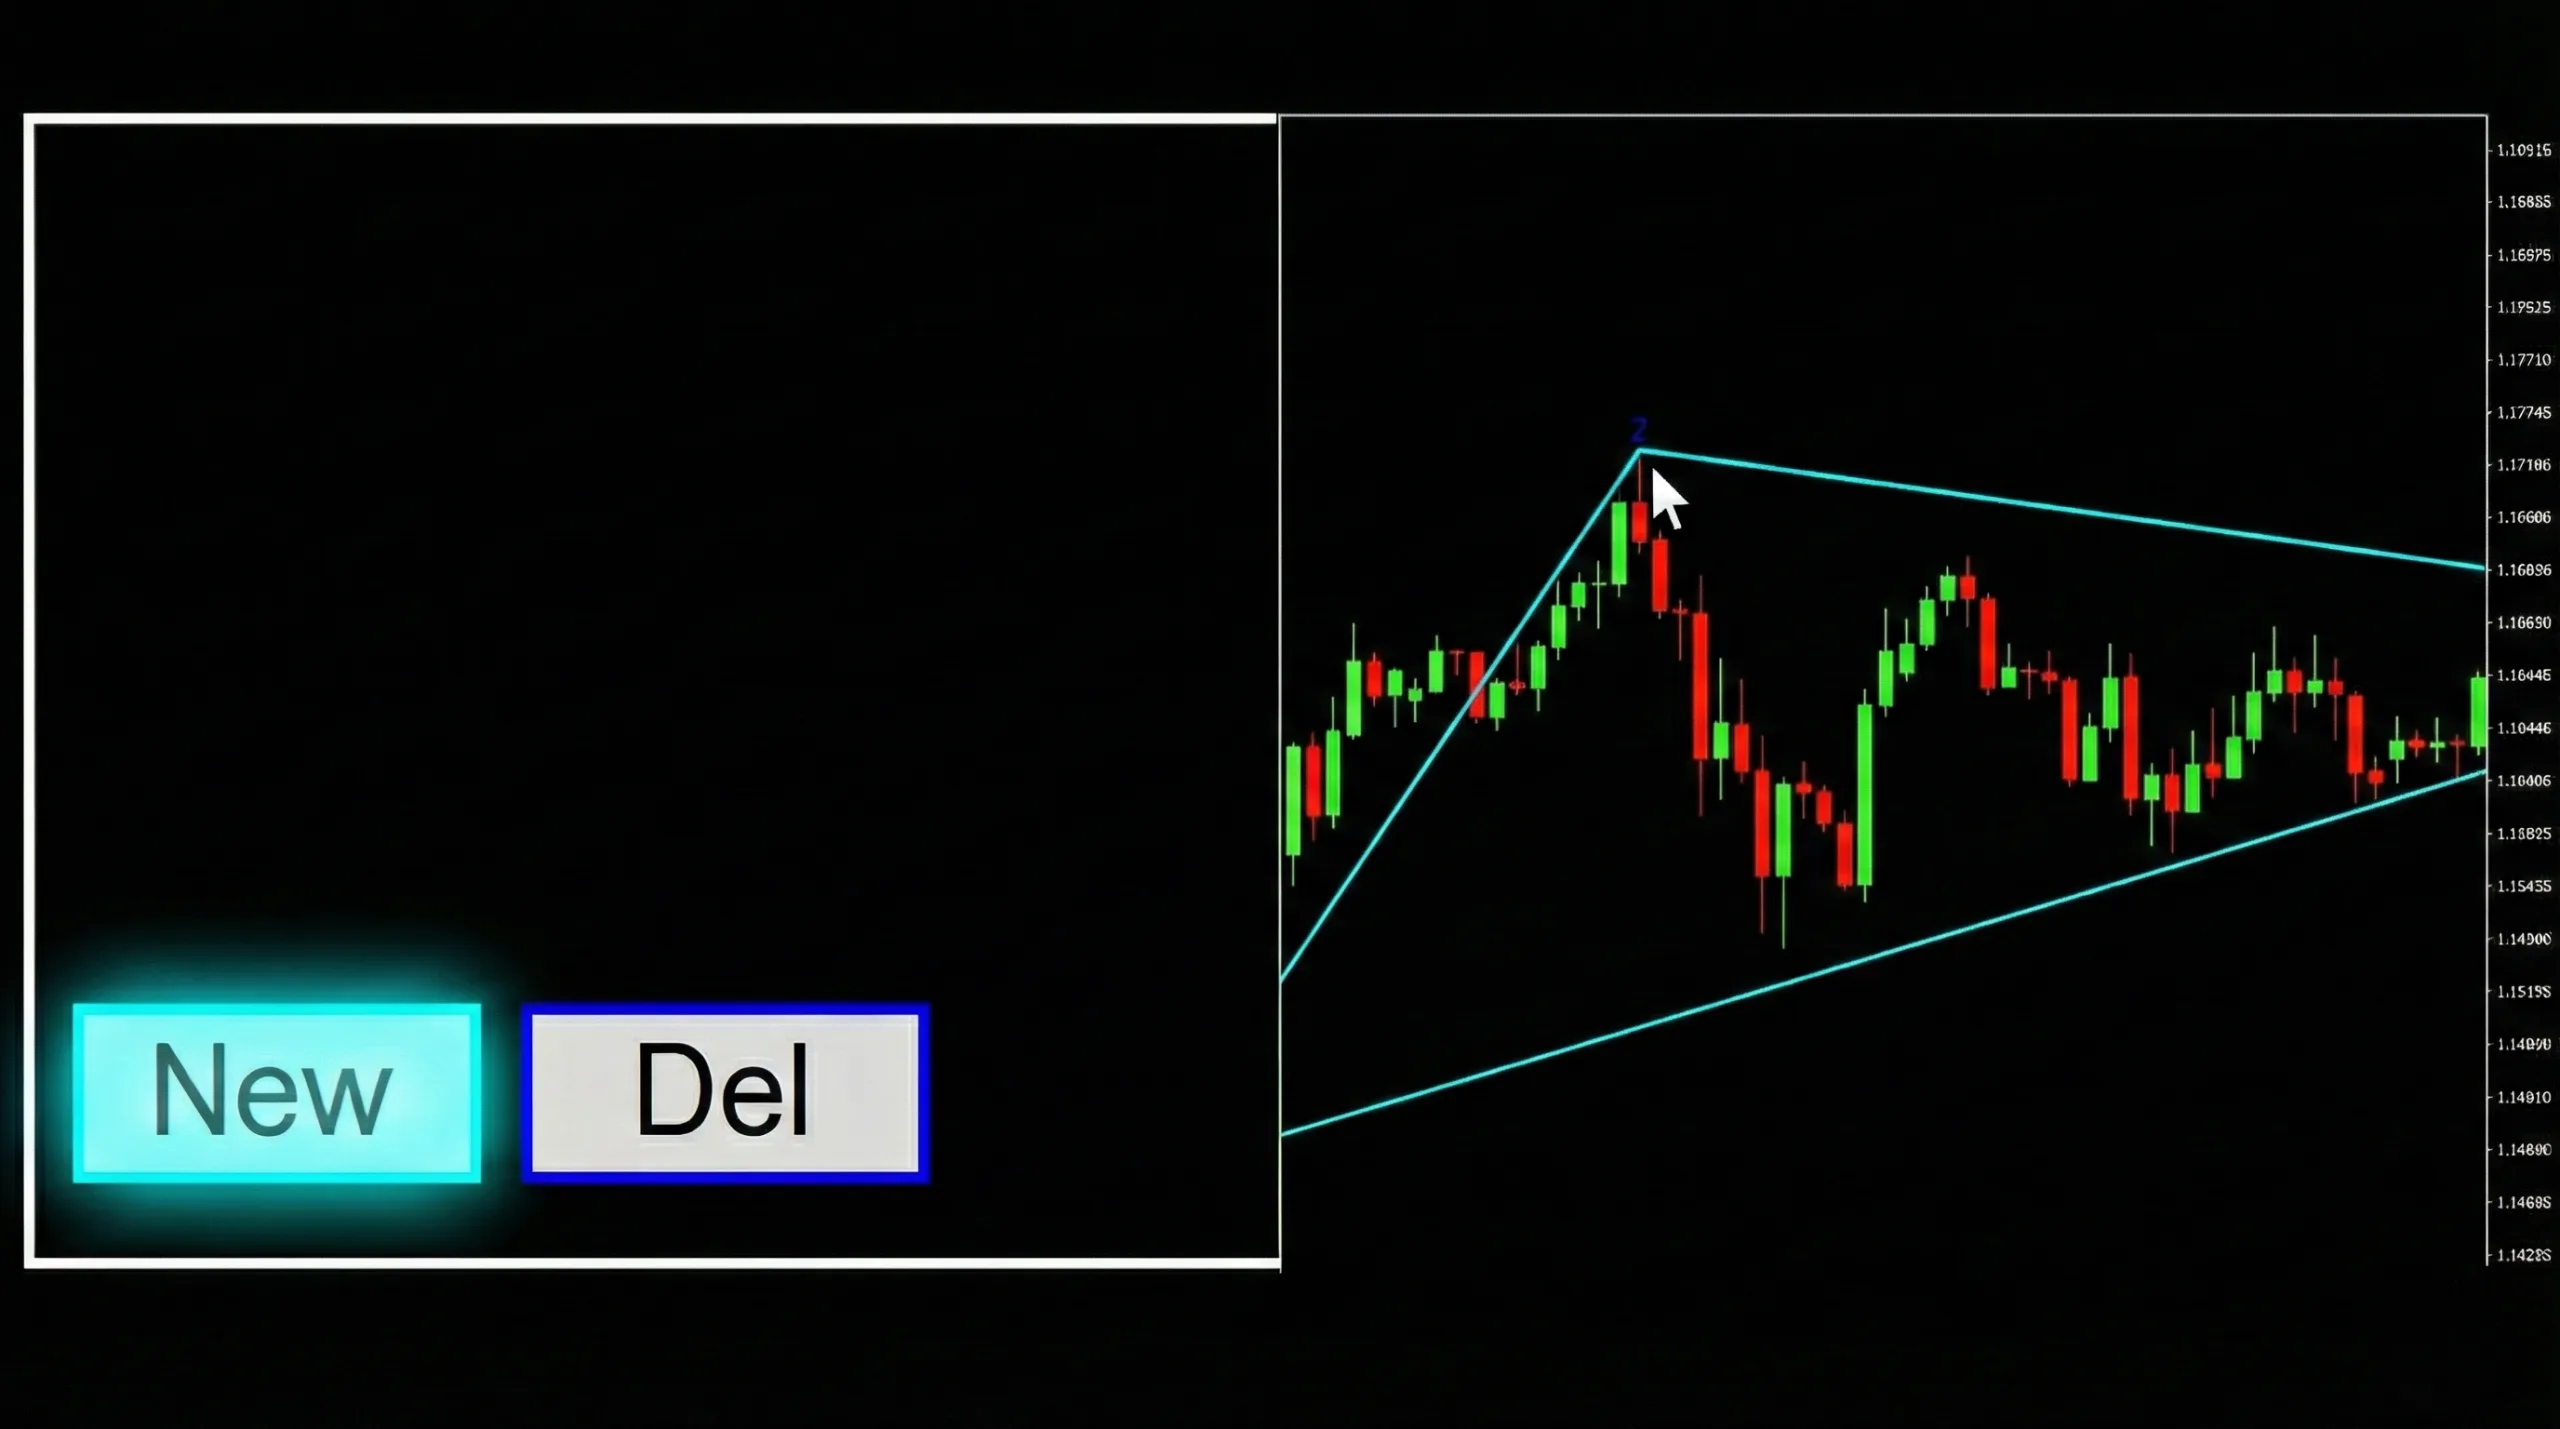
This is the “Experience” factor. 90% of failures with this tool happen because the trader draws triangles on random noise. You must follow a mechanical process.
Step 1: The “Squint Test”
Scan your chart. Do you see a sharp, clear 1-2-3 move? If you have to squint or zoom in 10x to find the swing points, do not trade it. The vertices must be obvious to the naked eye.
Step 2: Engage the Tool
Click the NEW button on your chart overlay. A gray, floating triangle will appear.
Step 3: Snap to Price
You act as the architect.
- Drag Vertex 1 to the absolute tip of the wick at the start of the trend.
- Drag Vertex 2 to the highest wick of the impulse.
- Drag Vertex 3 to the bottom wick of the retracement.
Pro Tip: Accuracy is non-negotiable. Do not place the vertex on the body of the candle. The algorithm needs the wick (extreme price) to calculate the projection lines correctly.
Reading the Signals: Understanding Time and Price Zones
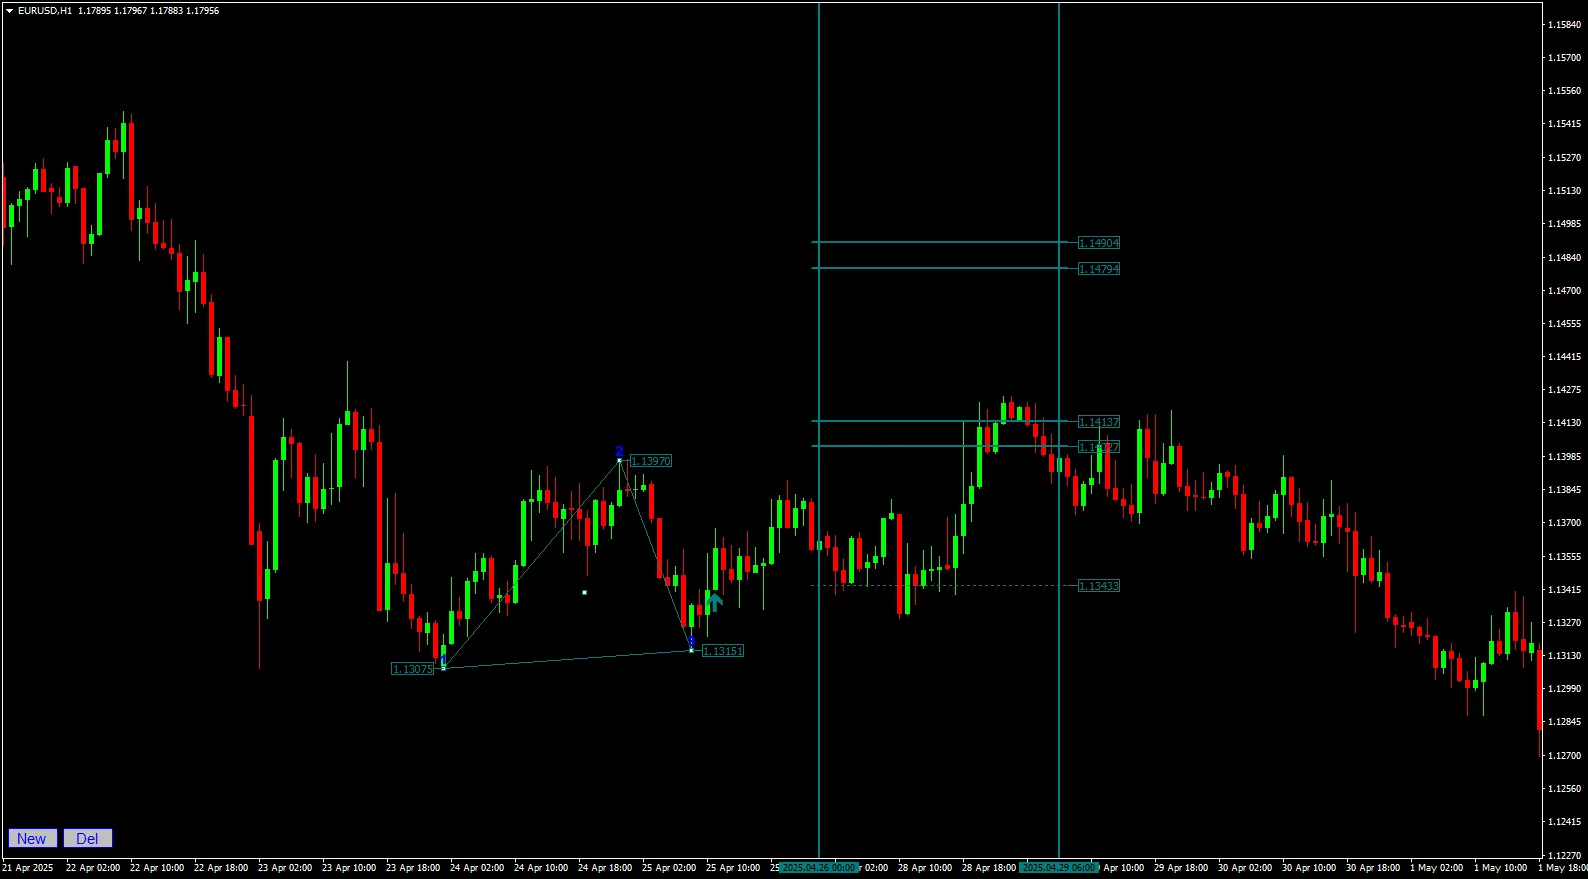
Once you set Point 3, the gray triangle transforms into a colored projection (Teal for Buy, Maroon for Sell). You now have a roadmap with two dimensions:
1. The “Time” Dimension (Vertical)
Most indicators only look at price. Apex looks at time. The vertical lines create a “Zone of Probability.”
- The Rule: If the price hasn’t hit your target by the time it exits this vertical window, kill the trade. The geometric energy has dissipated.
2. The “Price” Dimension (Horizontal)
- Preliminary Target: Your scalping exit.
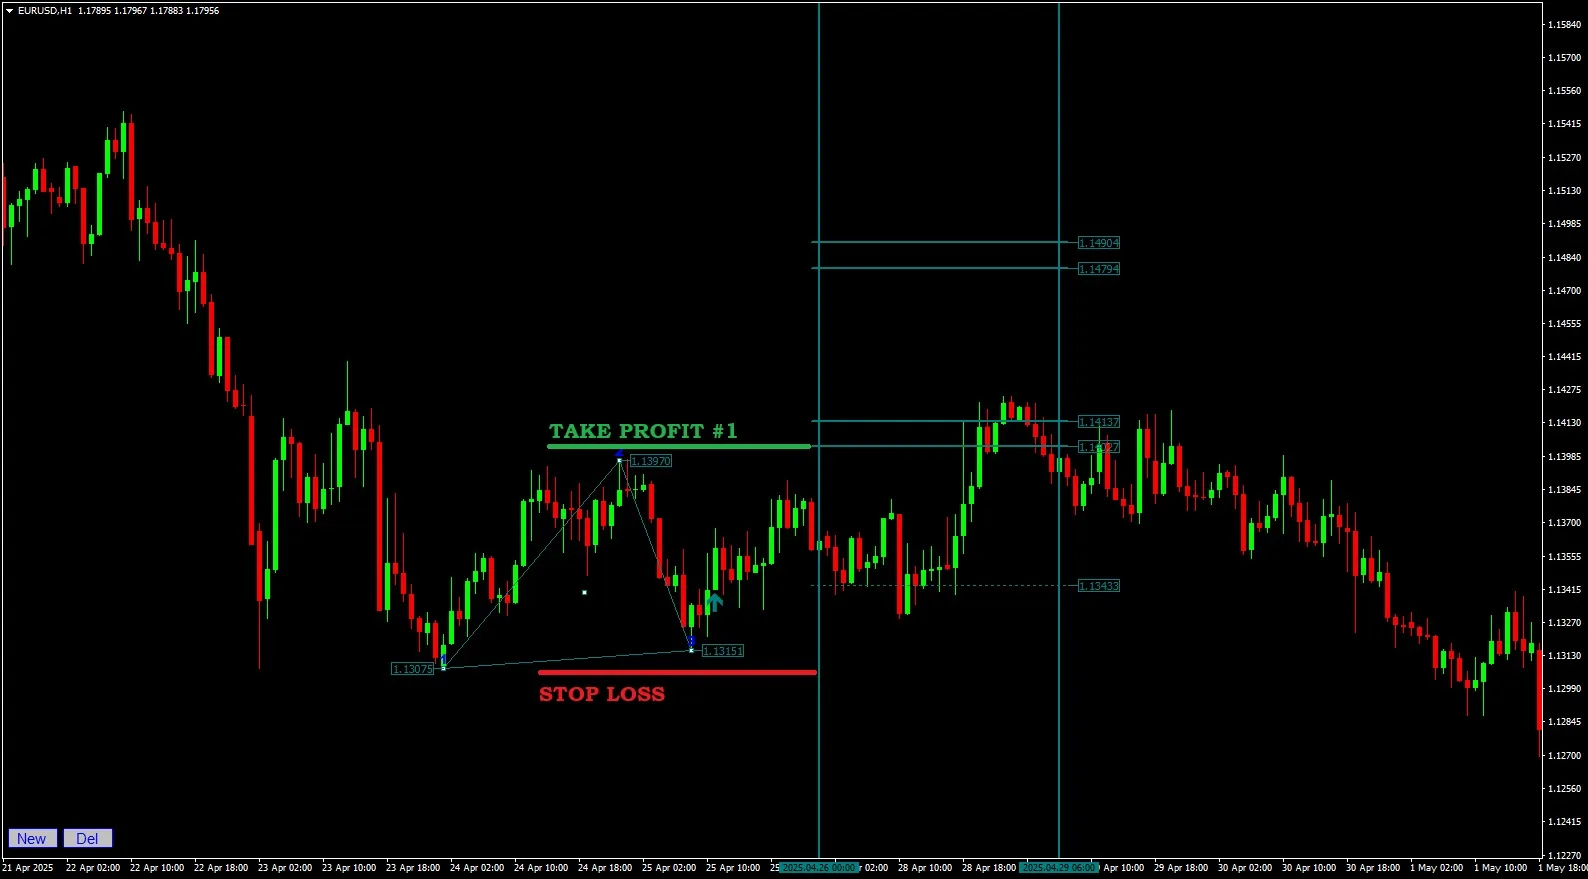
- 1st Zone: The high-probability Take Profit.
- 2nd Zone: The “Home Run” target (lower probability, higher reward).
Trading Strategy: Entries, Exits, and Stop Losses


Download a Collection of Indicators, Courses, and EA for FREE
Having the lines on your chart is not enough. You need an execution plan.
The Entry
Do not enter blindly just because the triangle appeared.
- Wait for price to break out of the triangle structure.
- Confirmation: Look for the signal arrow OR a strong candle close outside the line.
The Exit (Money Management)
- Conservative: At the Preliminary Target, close 50% of the position and move Stop Loss to Break Even.
- Standard: Aim for the 1st Zone. This is the statistical sweet spot.
- Aggressive: Hold for the 2nd Zone only if high-impact news supports the direction.
Limitations & Risk: Avoiding False Signals and Whipsaws
To be a profitable trader, you must know a tool’s weaknesses. Here is where the Apex Triangle struggles:
- The “Blurry” Pattern: If you try to force a triangle onto a choppy, sideways market, the projections will fail. If the pattern looks messy, drop down a timeframe (e.g., H1 to M15) to see if the structure clears up.
- News Spikes: Market geometry often breaks during NFP (Non-Farm Payroll) or Interest Rate decisions. Avoid initiating new setups 30 minutes before high-impact news.
The Power of Confluence:
For the highest trust score, use Multi-Timeframe Analysis.
- Draw a major triangle on H4.
- Find a smaller triangle on H1.
- If they point to the same target, size up. This is a “Confluence Setup.”
Conclusion
The Apex Triangle Indicator respects your intellect. It doesn’t clutter your chart with noise; it waits for you to identify the structure, then handles the complex mathematics of projection.
By combining your ability to spot “Visible Vertices” with the indicator’s algorithms, you stop hoping the market will turn, and start knowing when it is mathematically probable.
Ready to draw your first triangle?
Disclaimer: Trading leveraged products carries a high degree of risk. The strategies discussed here are for educational purposes. Past performance is not indicative of future results. Always use a Stop Loss.
[…] Read More Precision Reversals – Mastering the Apex Triangle Strategy for MT4 […]