
The bull trap pattern forex strategy is based on the forex pattern called the bull trap.
If you don’t know what a forex bull trap pattern or setup looks like, we will show you here.
A forex bull trap is the exact opposite of a forex bear trap and this bear trap forex trading strategy here explains what a forex bear trap chart pattern looks like as well.
What Is A Bull Trap Pattern In Forex?
A bull trap is a kind of chart pattern or you may also call a forex trading setup that traps buyers (bulls) into thinking that the price is going to go up.
But this uptrend is short-lived and at the end of a certain mt4 timeframe or period, the chart price comes back down and closes close to where it opened at or below where it opened it (generally speaking as there are variations of forex bull traps which we intend to write up sometime in the future).
So from this, you can already find out that a bull trap pattern is a bearish pattern or trade setup.
In our opinion, the best place to watch for forex bull trap setups is to form in on chart resistance levels.
What you will see is chart price will break the chart resistance level and head up to go up but soon after, it will start coming back down.
Here are a few mt4 chart examples of bull traps:
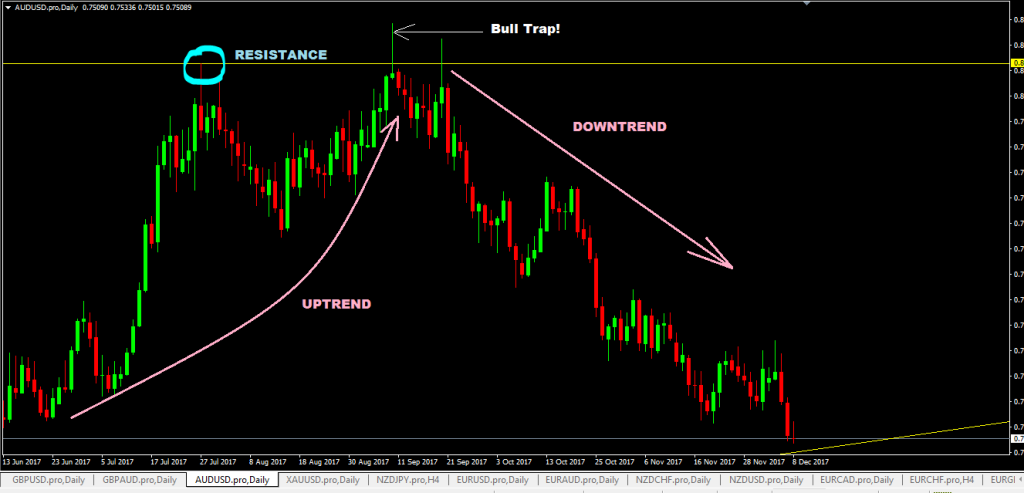
- On this mt4 chart below, you can see the price made resistance and moved down and then came back up and broke past it as if to continue going uptrend but it was short-lived.
- the chart price moved back downs and closed below the chart resistance level
- A pin bar candle was formed as a result and you can see what happened after that: the chart price moved down.
Here’s another one:
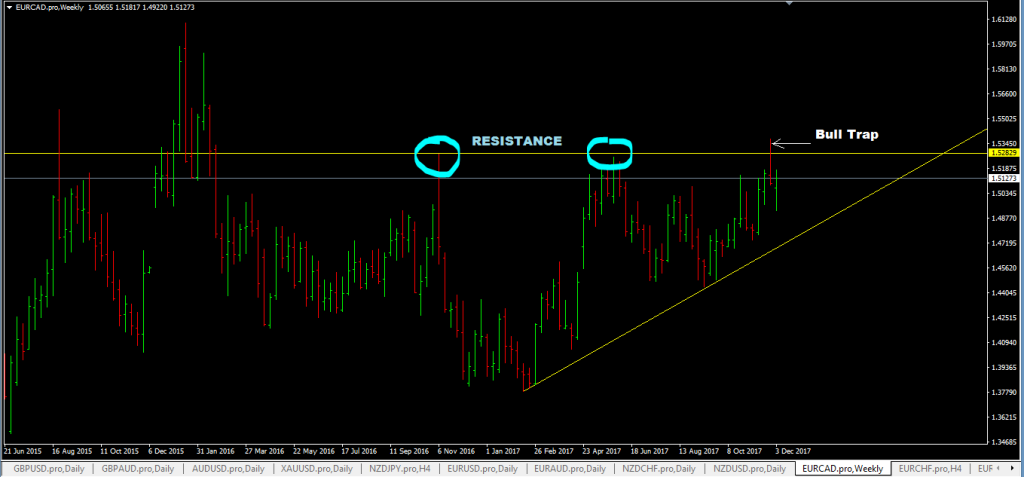
- notice the chart resistance level/zone price hit on two previous occasions and went down.
- on the third time, it hit the resistance level and went back up past it but then the price went back down and closed way below the chart resistance level.
- and after that chart price did travel down a fair bit as you can see on the mt4 chart below.
Now that you’ve seen what a forex bull trap setup can look like, it is fairly easy to come up with simple trading rules on how to trade bull trap pattern trade setups.
Strategy Trading Rules
Bull trap pattern setups are bearish setups so this is a sell entry rule only:
- identify major chart resistance levels and watch the chart price action when the price goes to test these chart resistance levels again.
- if the price breaks the chart resistance levels but that candlestick closes close to or below the chart resistance level, then place a sell stop order 1-2 pips below the low of that chart candlestick.
- Place our stop loss(SL) 2 pips above the high of that forex bull trap candlestick.
- For take profit(TP), aim for a 1:3 risk to reward ratio(R: R) or look for previous chart swing lows and use them as your take profit target levels.
What Happens if You Are Caught In A Forex Bull Trap Situation?
Suppose you strongly believe that the chart price is going to break the resistance level and you opened a buy entry breakout trade but later it turned out to be a forex bull trap, what should you do?
Well. The price action is showing you clearly that it is a forex bull trap.
So if we were you, We’ll take our loss and follow the trading rules given above so that we can be in a sell trade.