

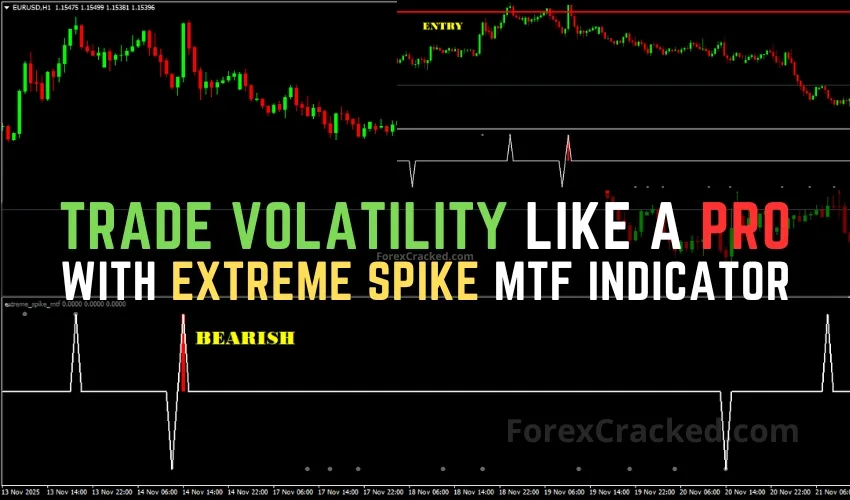
If there is one thing that destroys retail trading accounts faster than anything else, it is volatility spikes. You see a massive green candle shooting to the moon, FOMO kicks in, and you buy right at the top. Or, you see the market crashing, you panic sell, and watch in horror as the price immediately reverses and rockets upward.
The market is a machine designed to transfer money from the impatient to the patient. But what if you could see the “extremes” before they turn? What if you had a tool that ignored the noise and only highlighted the moments when price was statistically stretched to its breaking point?
That’s where Extreme Spike MTF Indicator comes to the picture.
In this comprehensive guide, we are going to break down exactly how this tool works, why “spikes” are the most profitable patterns in Forex, and provide you with a battle-tested strategy to trade them with confidence.
Table of Contents
The Anatomy of a Spike: Why Markets “Explode”
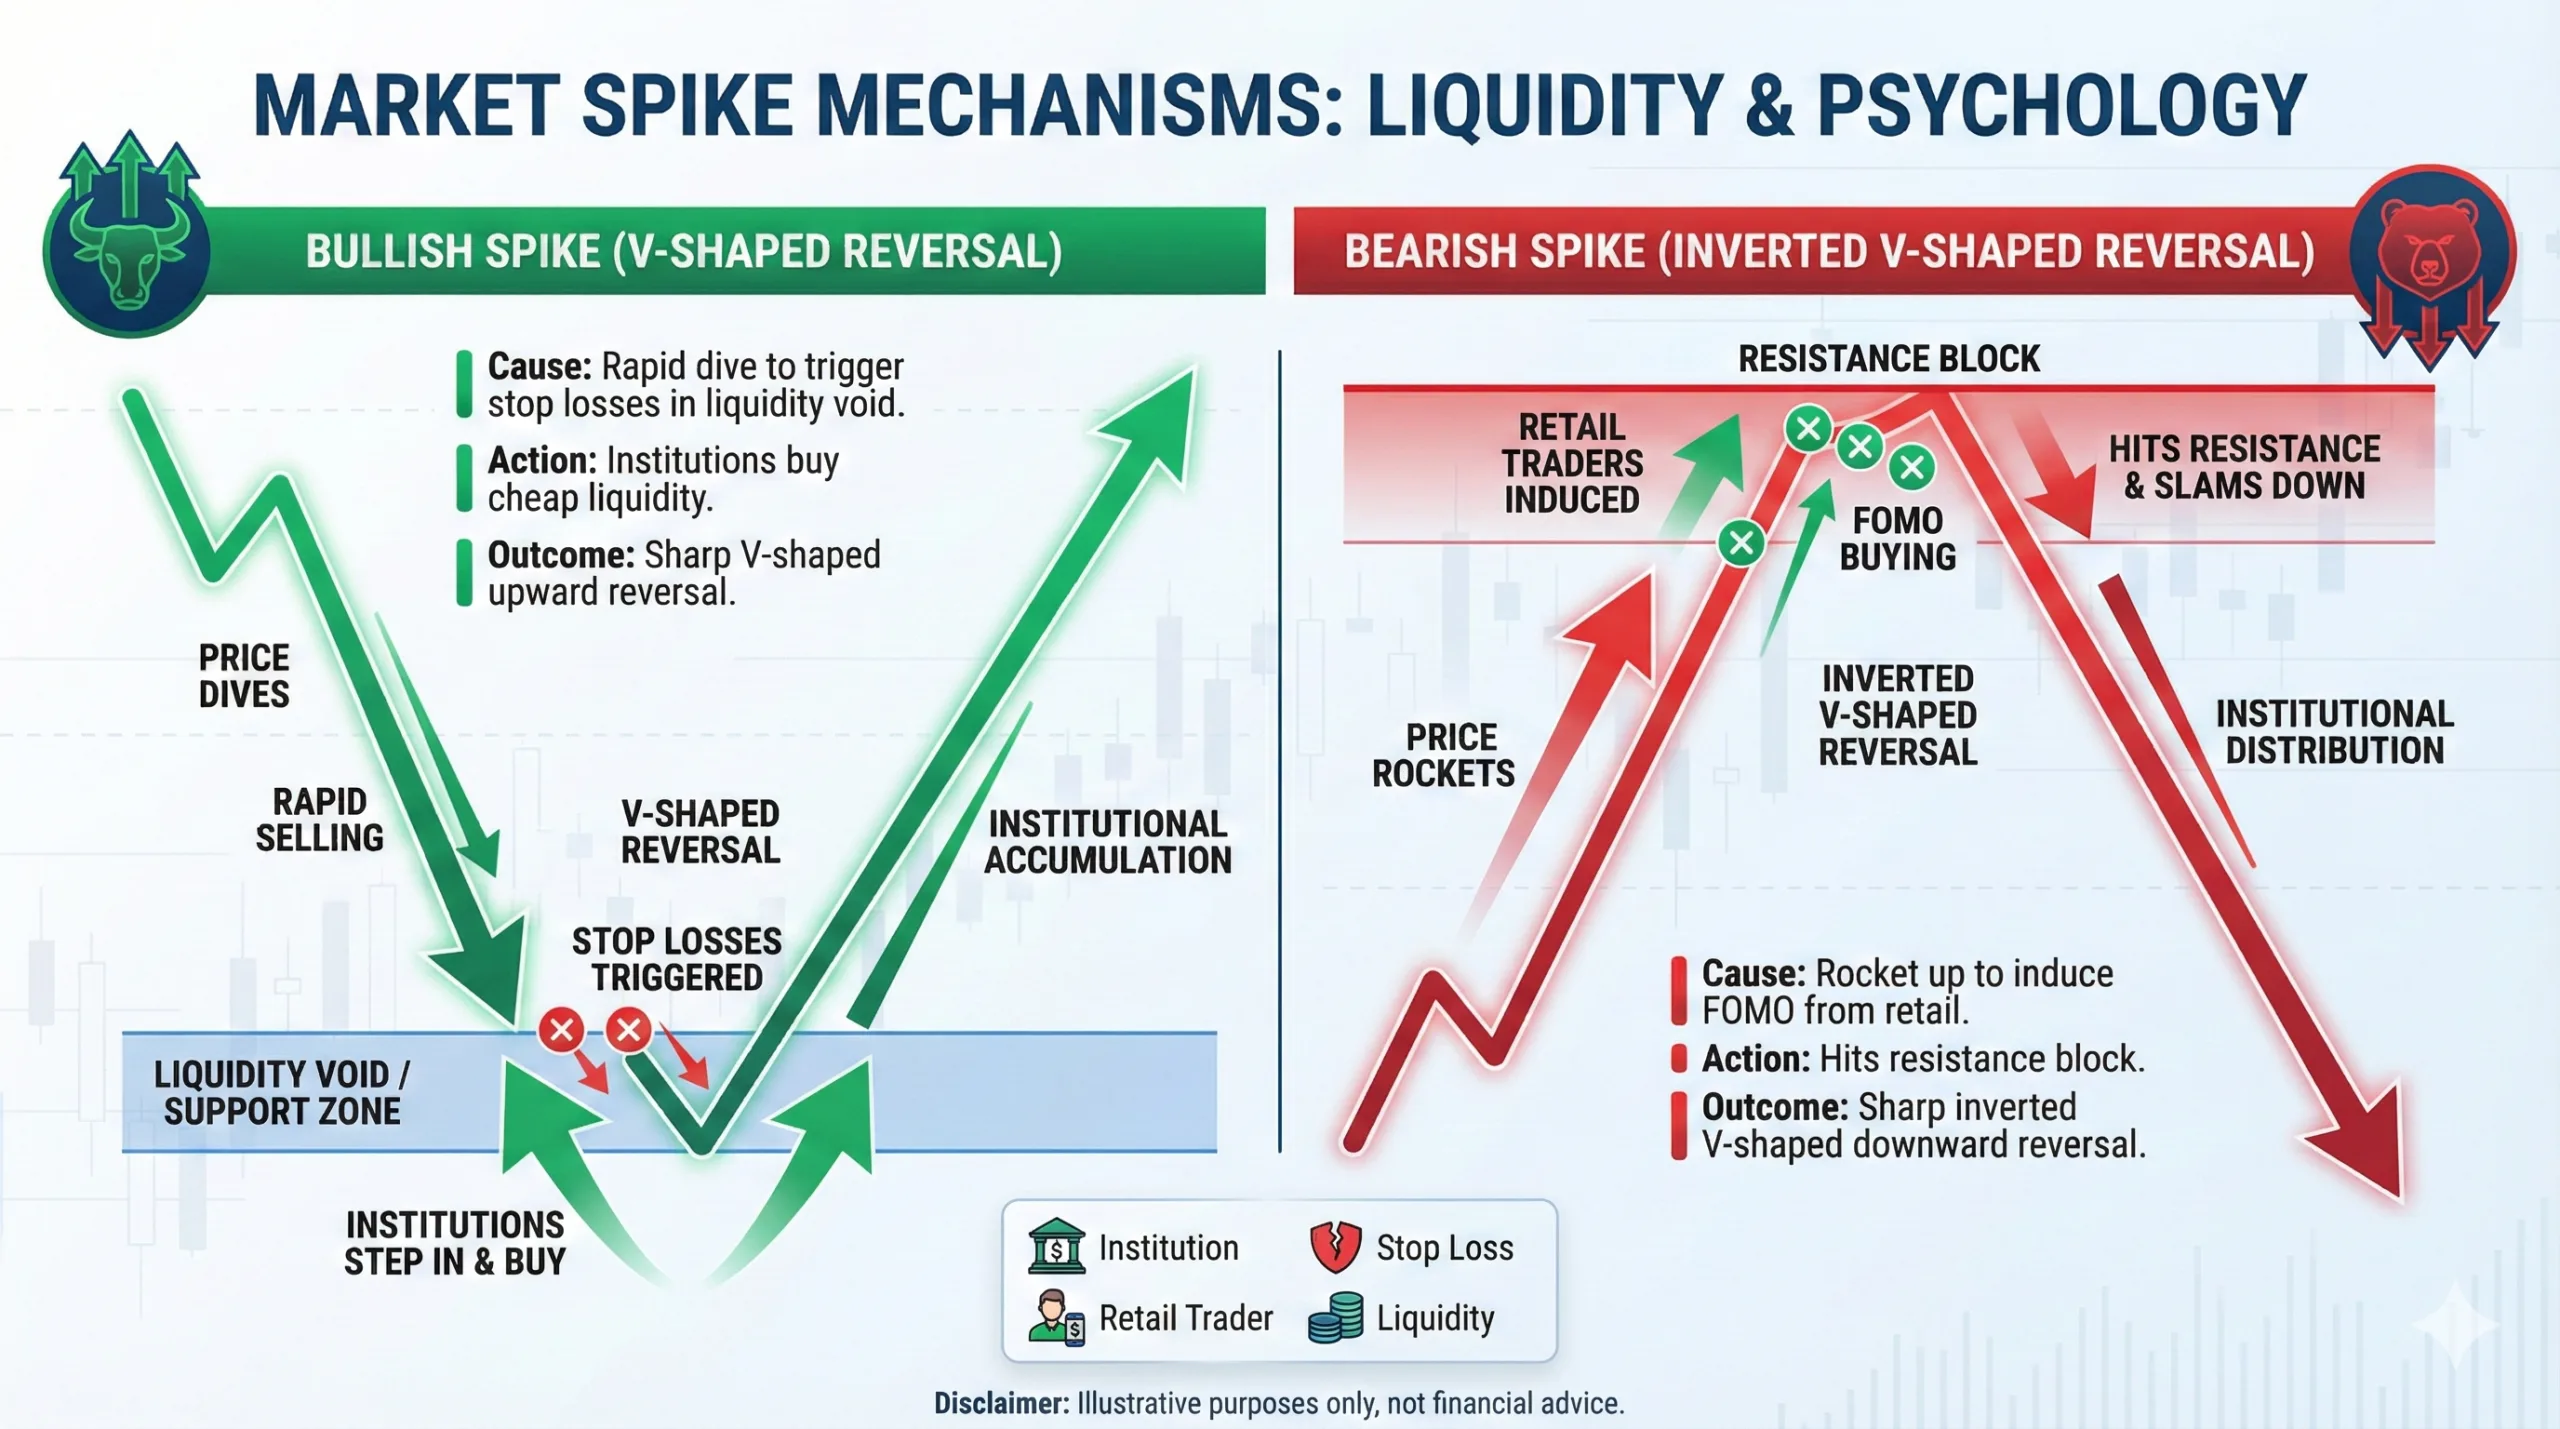
Before we dive into the indicator, you need to understand what you are trading. A “spike” isn’t just a fast candle; it is a liquidity event.
In the Forex market, price moves in search of liquidity. When big institutions (banks, hedge funds) want to enter massive positions, they cannot just click “buy” without slipping the price. They need someone to sell to them.
- Bullish Spikes often happen when price dives rapidly into a “liquidity void” or a previous support zone to trigger stop losses. Once those sell stops are triggered, institutions step in and buy up the cheap liquidity, causing a V-shaped reversal.
- Bearish Spikes are the opposite. Price rockets up to induce FOMO (Fear Of Missing Out) from retail traders, hits a resistance block, and slams back down.
The Extreme Spike MTF Indicator is designed to detect these specific moments of exhaustion. It tells you when the rubber band is stretched too far and is about to snap back.
Stop Guessing, Start Sniping: What is the Extreme Spike MTF?
The Extreme Spike MTF (Multi-Timeframe) Indicator is a specialized technical tool for MetaTrader 4 (MT4) designed to visualize volatility extremes. Unlike standard oscillators like the RSI or Stochastic which can stay “overbought” for days, this indicator focuses on velocity and price action displacement.
Key Features at a Glance:
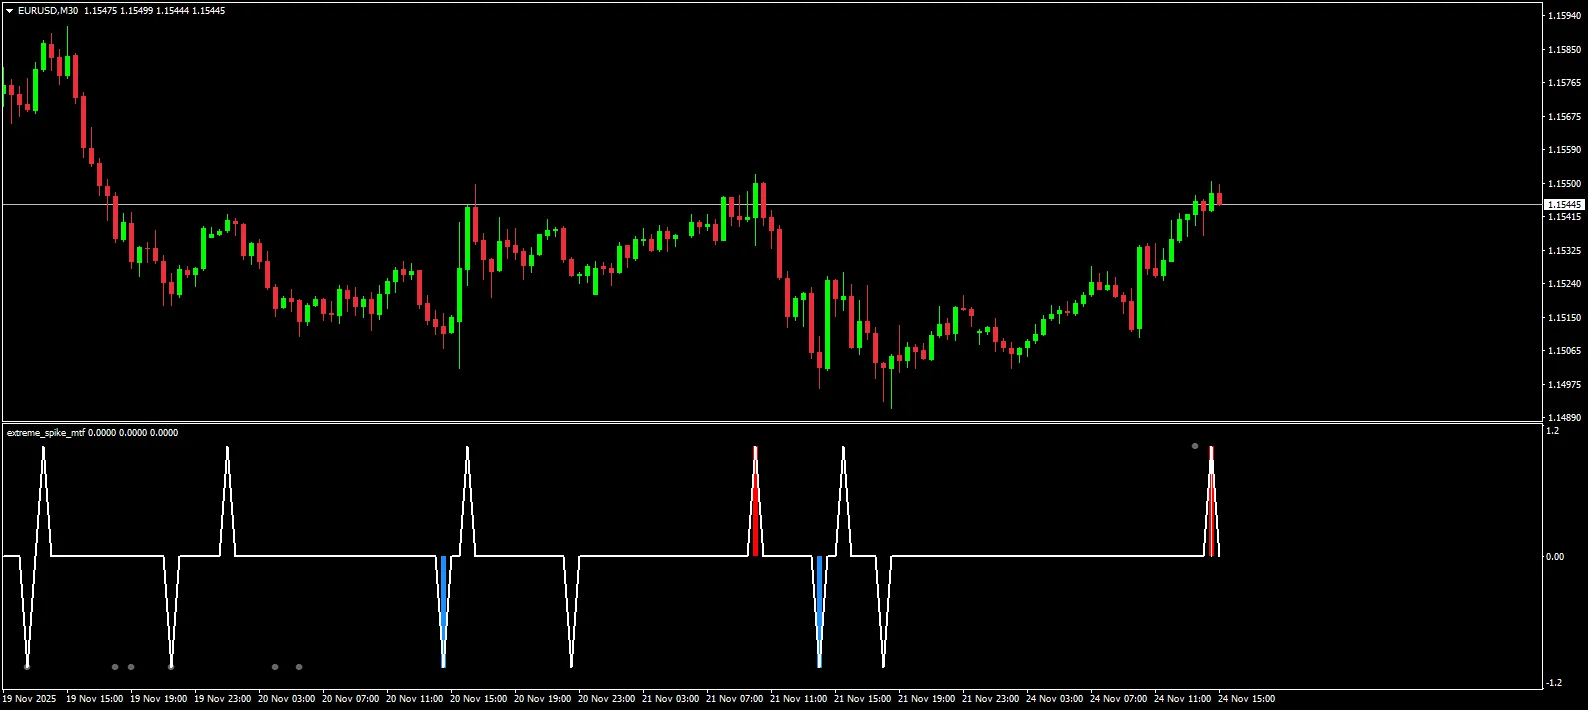
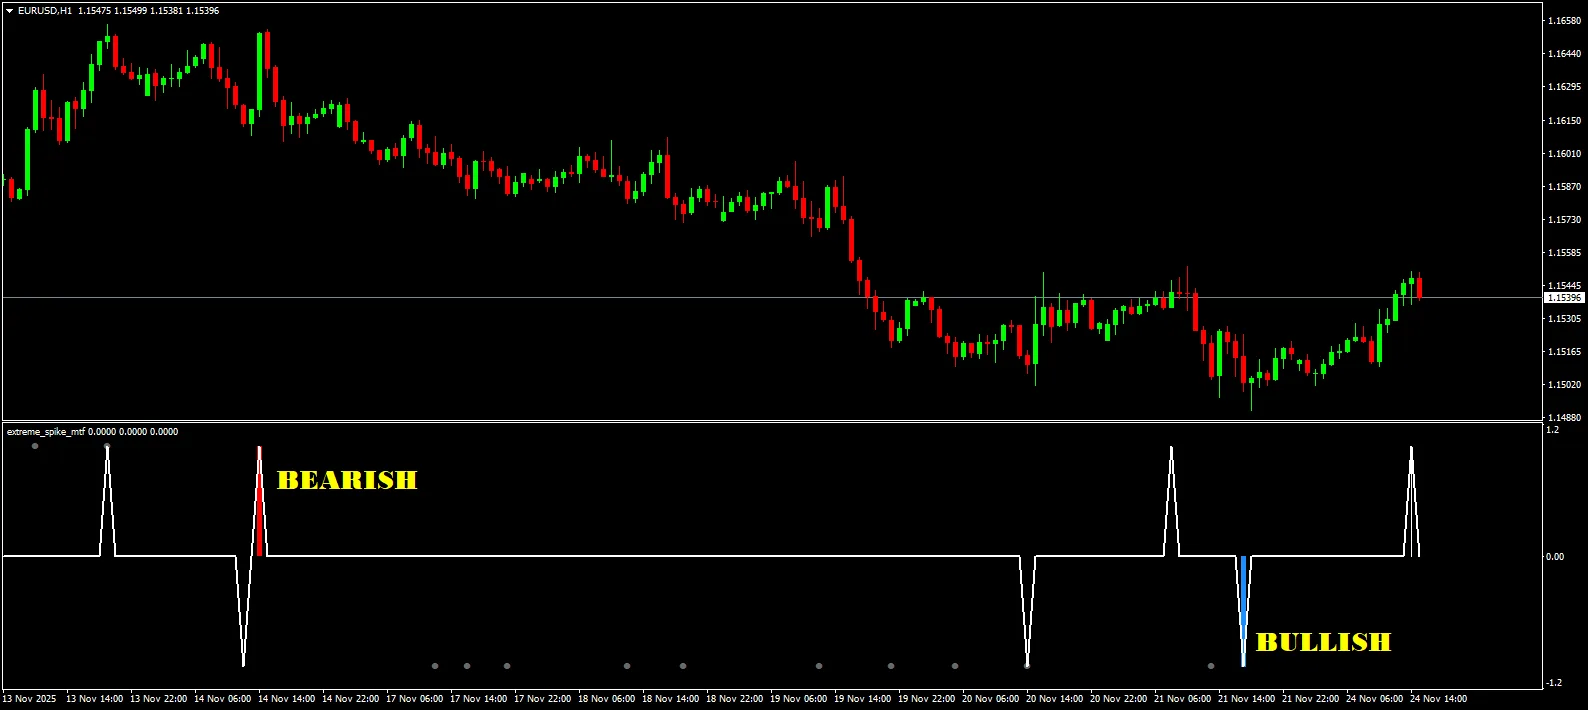
- Visual Simplicity: It plots Blue Dots/Bars for bullish spikes (buy signals) and Red Dots/Bars for bearish spikes (sell signals).
- Multi-Timeframe (MTF) Vision: This is the “killer feature.” You can monitor the H4 (4-hour) chart’s volatility while trading on the M15 (15-minute) chart. This keeps you aligned with the “Smart Money” flow.
- Versatility: It works on everything Forex pairs, Gold (XAUUSD), Indices (US30, NASDAQ), and Crypto.
The Logic Behind the Dots
The indicator analyzes the recent range of price relative to historical volatility. When the current price moves X deviations away from the mean (average) faster than usual, the algorithm triggers a “Spike” signal. It’s essentially flagging an unsustainable move.
The “Extreme Reversal” Strategy (Step-by-Step)
Do not just download the indicator and blindly trade every dot. That is how you lose money. You need a Confluence Strategy. We are going to build a system that filters out weak signals and leaves you with the high-probability setups.
Phase 1: The Setup (The Alert)
You are looking for the indicator to print a signal against the immediate momentum.
- Bullish Setup – Price crashes down hard. The Extreme Spike indicator prints a Blue Bar/Dot at the bottom of the sub-window.
- Bearish Setup – Price rallies aggressively. The indicator prints a Red Bar/Dot at the top.
Crucial Rule: The bigger the candle preceding the dot, the better the signal. We want to see panic or euphoria.
Phase 2: The Confirmation (The Filter)
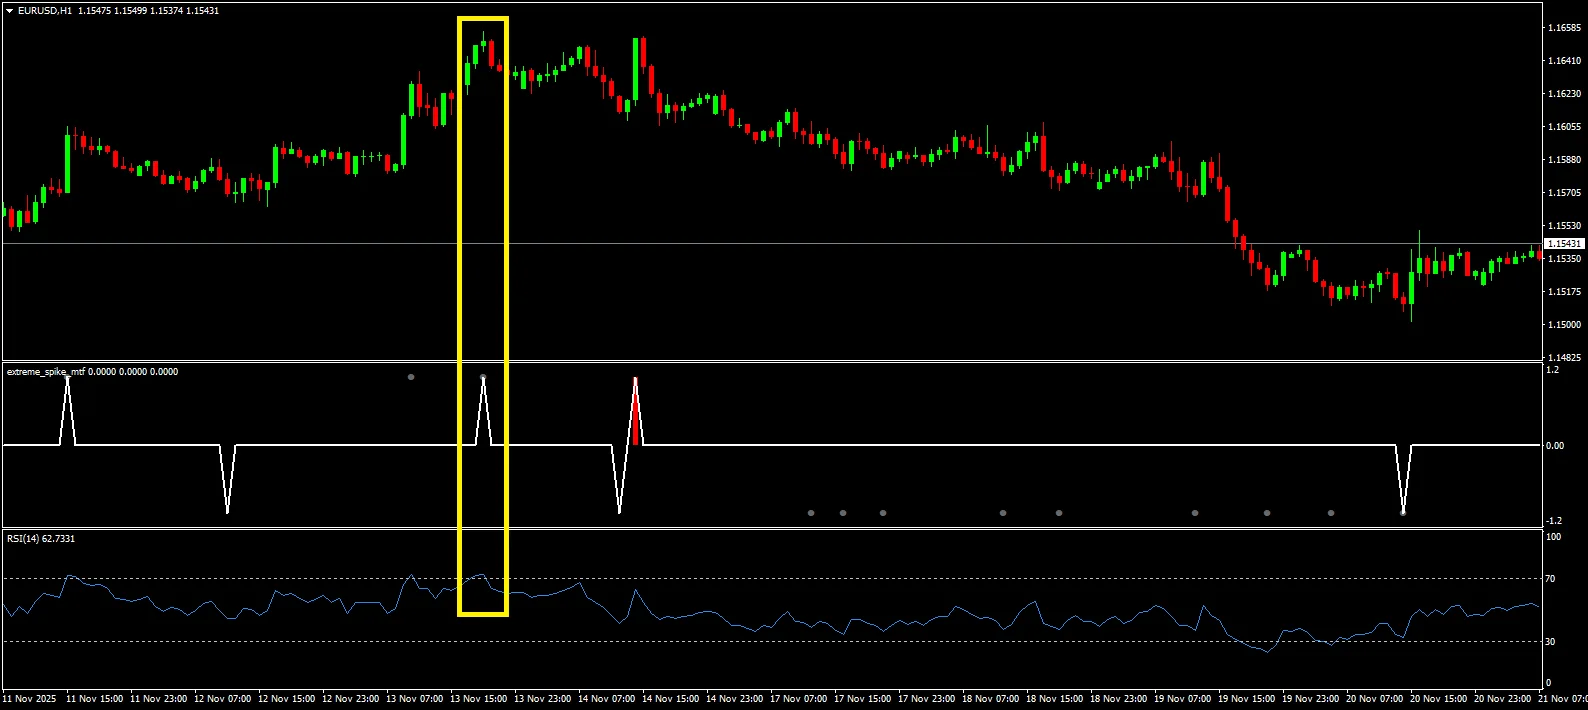
A spike signal alone is just a warning. Now we need proof the market is turning. We will use a secondary filter: RSI (Relative Strength Index) with a period of 14.
- For a BUY:
- Extreme Spike indicator shows Blue.
- RSI (14) must be below 30 (Oversold) and ideally “hooking” upwards.
- Price Action: Look for a rejection candle. A Pin Bar (long wick at the bottom), a Doji, or a Bullish Engulfing candle.
- For a SELL:
- Extreme Spike indicator shows Red.
- RSI (14) must be above 70 (Overbought) and hooking downwards.
- Price Action: Look for a Shooting Star, Bearish Engulfing, or a “Railroad Track” pattern.
Phase 3: The Execution (The Trigger)
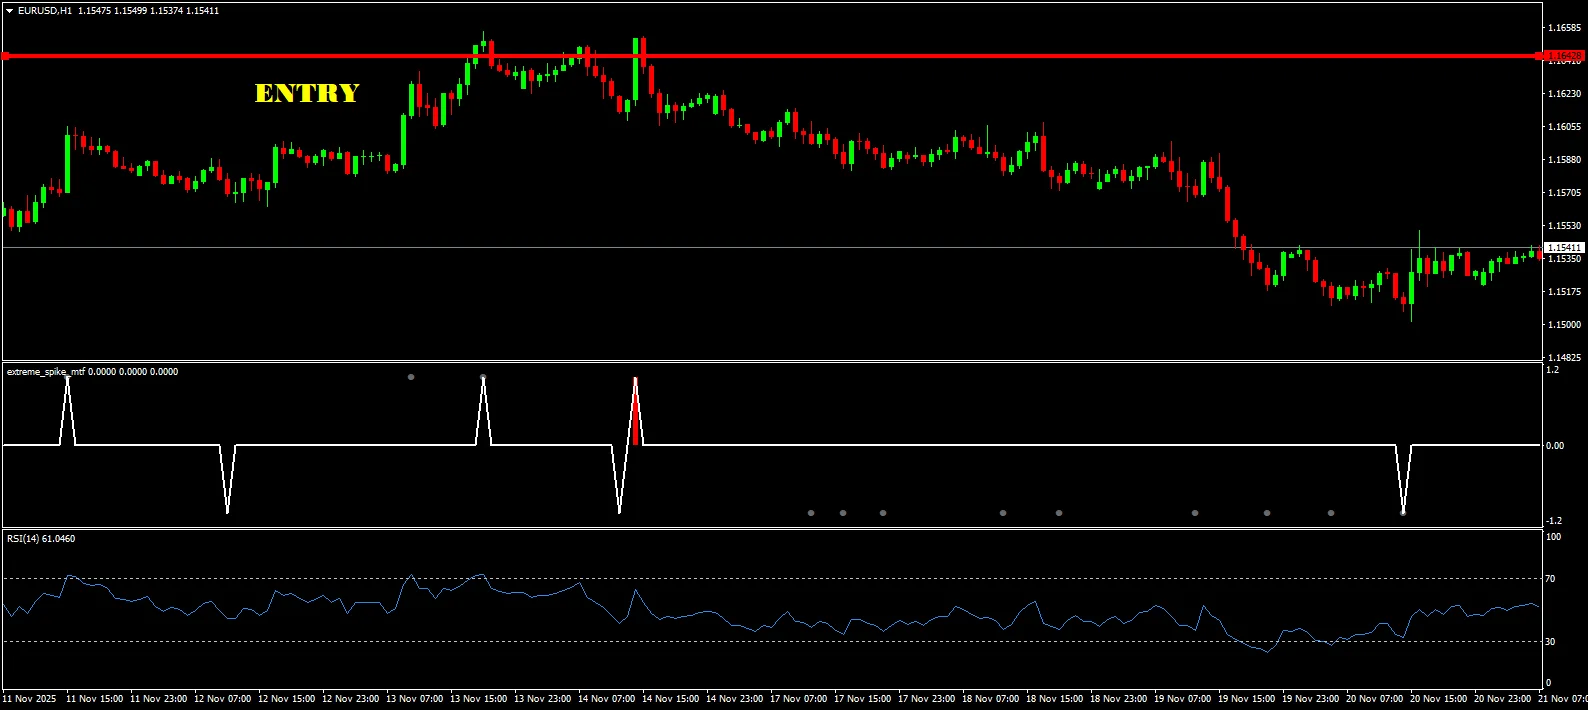
Don’t enter on the current candle. Wait for the candle with the dot to close.
- Aggressive Entry – Enter immediately on the open of the next candle if the price action looks strong (e.g., a massive wick rejection).
- Conservative Entry (Recommended) – Place a pending order.
- Buy Stop just above the high of the spike candle.
- Sell Stop just below the low of the spike candle.
- Why? If price keeps crashing without breaking the high, you don’t get triggered into a losing trade.


Download a Collection of Indicators, Courses, and EA for FREE
The Multi-Timeframe Edge: Seeing the Matrix
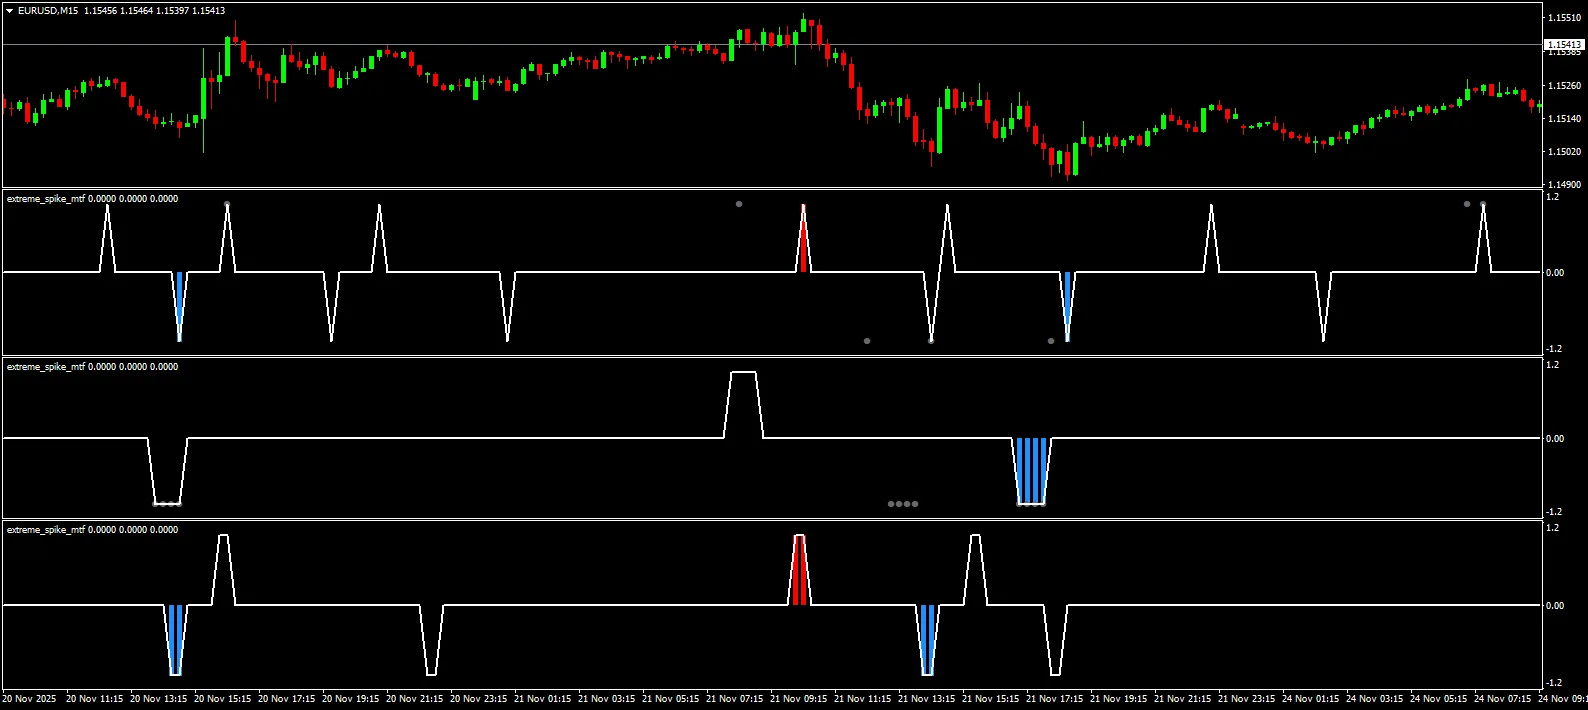
Here is where 90% of traders fail they get “tunnel vision” on the 5-minute chart. The MTF function of this indicator solves this.
The “Triple Screen” Method:
- The Trend (H4): Use the Extreme Spike indicator on the H4 timeframe. Is it generally calm? Or did it just print a massive Spike signal? If H4 shows a Blue Spike, the higher timeframe bias is UP.
- The Setup (M15): Drop down to the M15. Only take BUY signals (Blue Dots). Ignore the Red Dots because they are counter to the major trend.
- The Trigger (M5): Fine-tune your entry on the M5 for the tightest stop loss.
By aligning your lower timeframe trades with the higher timeframe spikes, you are surfing the “tidal wave” rather than swimming against it.
Risk Management: Don’t Get Impaled

Spike trading is essentially mean reversion trading. You are stepping in front of a speeding train betting it will stop. When it works, you look like a genius. When it fails, you can get crushed. You must respect these rules:
- The “2-Candle” Stop Loss: Place your Stop Loss (SL) a few pips below the lowest point of the spike candle. If the market crashes 2 candles further against you, the spike was a fake-out. Get out. Do not hold and hope.
- News Blackout: Do NOT use this strategy during NFP (Non-Farm Payroll), CPI, or Rate Decisions. During these events, spikes can “repaint” or extend for hundreds of pips. The indicator works best on “technical” volatility, not “fundamental” shocks.
- Take Profit Strategy:
- TP1 (Safe): Take 50% off at the nearest 50 EMA (Exponential Moving Average). Spikes usually revert to the mean.
- TP2 (Runner): Move stops to breakeven and hold the rest for a retest of the previous structure high/low.
Optimizing Your Settings for 2025
Markets change, and default settings aren’t always optimal. Here is how to tweak the Extreme Spike MTF for different assets:
- For Gold (XAUUSD): Gold is hyper-volatile. Increase the “Sensitivity” or “Period” setting slightly to filter out small $2-$3 moves. You only want to see the $10+ moves.
- For EURUSD/GBPUSD: The default settings are usually fine, but ensure your “TimeFrame” setting in the inputs matches your higher timeframe analysis (e.g., set to 240 for 4-Hour confirmation).
- For Crypto (BTC/ETH): Crypto spikes are deeper than Forex. Wait for a “Double Spike” (two dots in a row or a Divergence pattern) before entering.
Ready to upgrade your trading arsenal?
Frequently Asked Questions (FAQ)

Does the Extreme Spike MTF indicator repaint?
This depends on the specific version mode you select. In “Signal” mode, the dot typically appears once the candle closes. If you are using it in “MTF” mode, remember that a closed H4 candle is “painting” over 4 hours. Always wait for the candle close to confirm the signal is locked in.
Can I use this for Binary Options?
Yes. This is extremely popular for Binary Options. Traders often look for a spike on the M1 or M5 timeframe and take a reversal trade with an expiry of 3 to 5 candles.
What is the win rate?
No indicator has a fixed win rate. However, when combined with RSI divergence and Support/Resistance levels, traders often report win rates above 65-70% on clear setups.
Why do I see red dots in an uptrend?
These are “pullback” signals. In a strong uptrend, red dots indicate a temporary pause. Aggressive traders short these, but the safer play is to wait for the price to dip and then buy when a Blue Dot appears to join the trend.
Conclusion: The “Unfair” Advantage
Trading isn’t about being right 100% of the time. It’s about identifying asymmetry situations where the potential reward far outweighs the risk.
The Extreme Spike MTF Forex Indicator is your asymmetry detector. It highlights the moments when the crowd is panicking, allowing you to step in with the calm precision of a sniper. It removes the emotion from the chart and replaces it with cold, hard data points.
Stop chasing the market. Let the market come to you. Wait for the spike, confirm the exhaustion, and take the trade.
Disclaimer: Trading Forex and CFDs involves significant risk and is not suitable for all investors. The information provided here is for educational purposes only. Always backtest strategies on a demo account before trading with real money.