

The Fibonacci Based Trailing Stop indicator is a technical analysis tool designed to help traders interpret market trends and develop trailing stop levels based on Fibonacci retracement principles. Built upon the relationship between recent swing highs and lows, this indicator integrates dynamic Fibonacci levels to drive trend detection and manage trade exits using trailing stop.
Rather than forecasting price movements, the Fibonacci indicator provides a systematic framework for visualizing trailing stops aligned with ongoing trends. This function is relevant for those implementing trend following strategies, as well as for traders interested in identifying potential support and resistance levels during existing trends.
Visual Features of this Fibonacci Indicator
The Fibonacci Indicator features options such as:
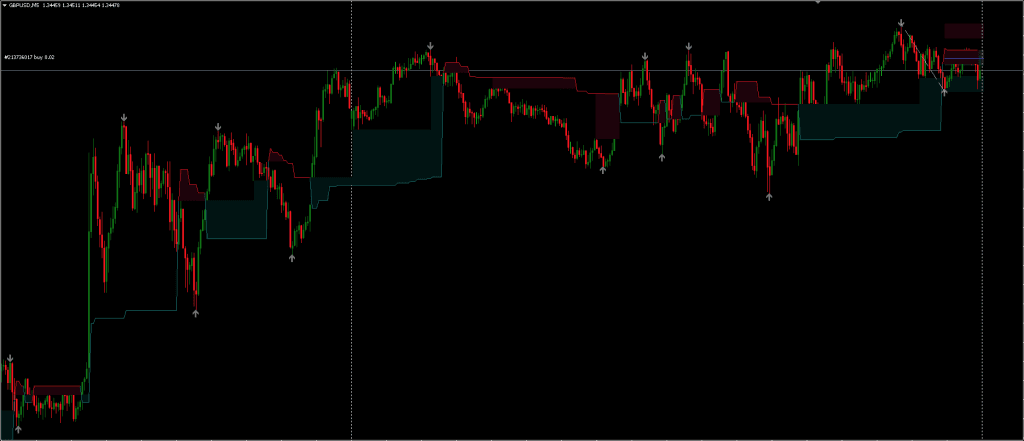
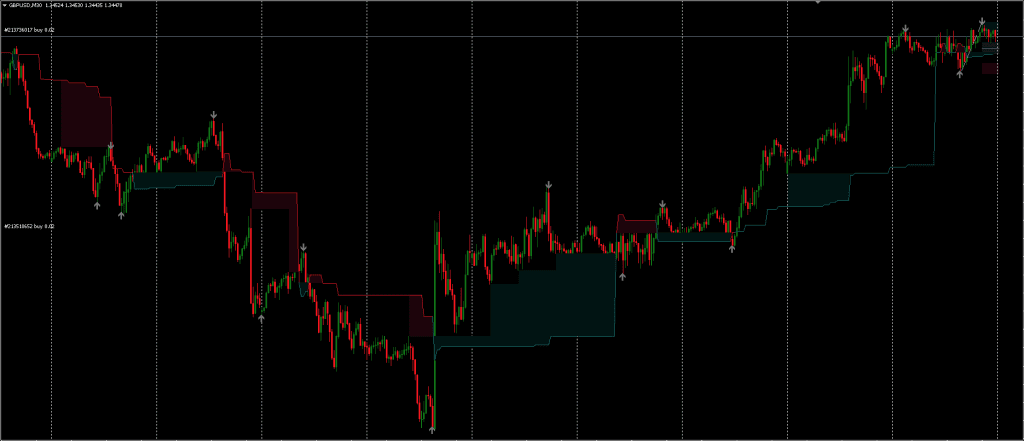
- Latest Fibonacci levels – A display of current retracement levels based on the most recent swing.
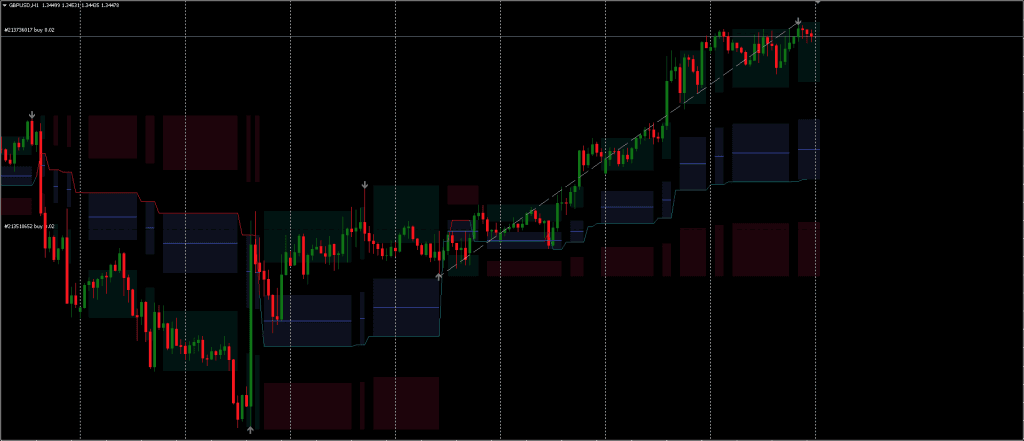
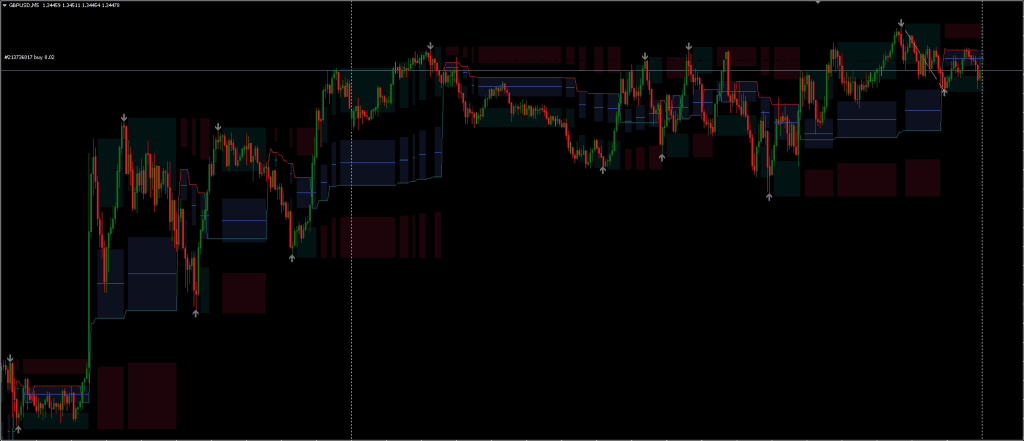
- Shadows – These represent prior Fibonacci levels with a one-bar delay and offer historical insight into where past support or resistance may have existed.
Traders have the ability to toggle between showing the latest Fibonacci levels or the shadows, depending on which visualization is more useful to their analysis. To reduce clutter, enabling shadows disables the color fill for Live Fibonacci and Trailing Stop Indicator lines.
The presence of large “shadow blocks” may suggest potential consolidation or critical price zones, though not all will result in actionable trade signals.
Fibonacci Indicator isn’t a standalone trading indicator. Still, it can be very useful for your trading as additional chart analysis, to find trade exit position(TP/SL), and more. While traders of all experience levels can use this system, practicing trading on an MT4 demo account can be beneficial until you become consistent and confident enough to go live. You can open a real or demo trading account with most Forex brokers.
Customization Features
Pivots and Swings
The swing algorithm depends on two user-defined values:
- L (Left) – Determines how many bars to the left are used to define a swing point.
- R (Right) – Determines the bars on the right needed to validate the pivot.
This configuration ultimately defines how sensitive or responsive the trailing stop indicator is when identifying trend changes or constructing new Fibonacci levels.
Trailing Stop Behavior
The trailing stop itself can be adjusted in two key ways:
- Level – Predefined levels ranging from -0.5 through 0.618 are available, although custom levels can also be input.
- Trigger – This setting defines the condition under which a trend reversal is recognized, either based on the close of a bar or a wick, incorporating the high or low depending on market direction.
These settings influence both how conservative or reactive the trailing stop appears and how frequently it registers a possible trend change.


Download a Collection of Indicators, Courses, and EA for FREE
Trading with the Trailing Stop Indicator
Trend Recognition and Interpretation
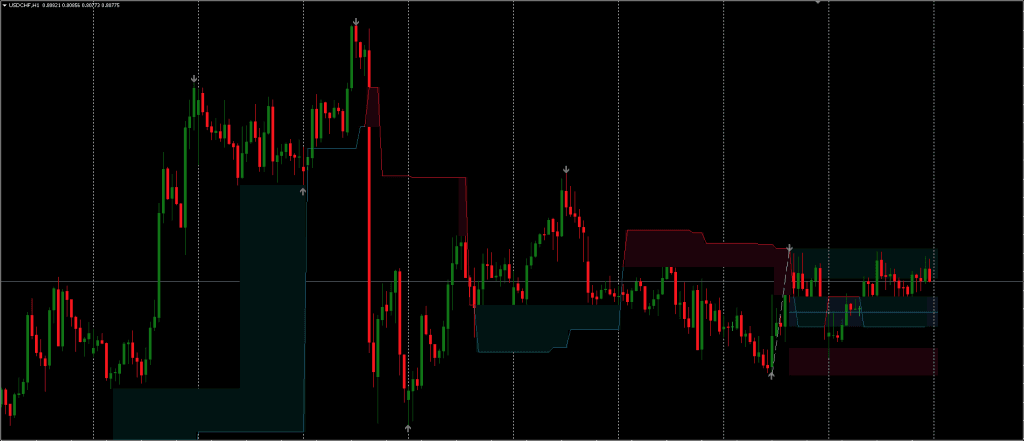
Trend direction is interpreted based on how the current price relates to the Trailing Stop Indicator line:
- In uptrends, Fibonacci levels are oriented toward the lower region of the swing pattern.
- In downtrends, they align toward the upper region.
When price crosses the fibonacci indicator line according to the trigger condition, the trend is considered potentially reversed. Whether or not to interpret this as a definitive signal for closing, opening, or adjusting positions will depend on the trader’s broader strategy.
Considerations for Use
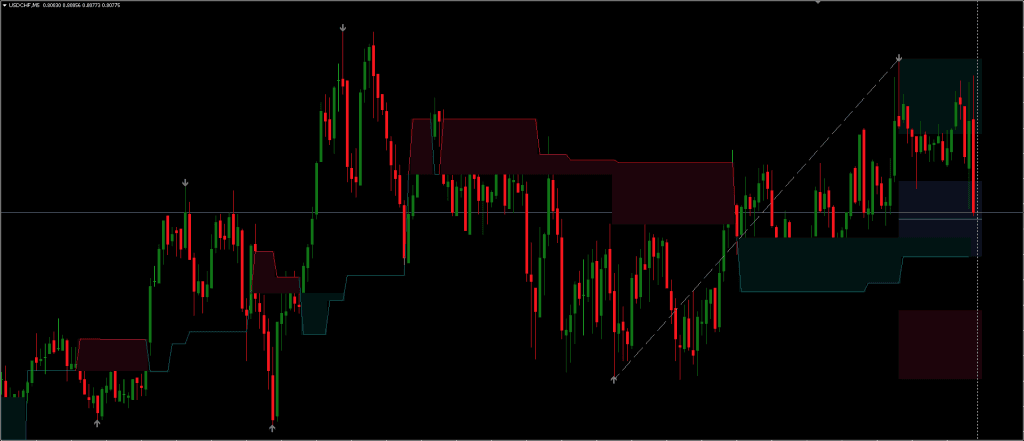
The Fibonacci Trailing Stop indicator does not predict trends but instead attempts to follow them based on structural price changes. Its reliance on Fibonacci retracements is common among technical tools, and while this offers visual coherence with other analysis elements, it is subject to the same interpretation limitations.
This indicator may not serve well in low volatility, sideways markets, where frequent shifting swings can lead to inconsistent updates and potential whipsaw. As with any trailing stop methodology, it provides more consistent results during strong, sustained trends.offering possible clues about former support or resistance levels.
Conclusion
The Trailing Stop Indicator is a structured, technical tool that uses Fibonacci based logic to define trailing stop levels. It functions primarily as a trend following guide and is supplemented with customizable options for users looking to tailor its responsiveness and visual output.
Whether or not Fibonacci Indicator leads to positive outcomes depends on factors including market conditions, strategy alignment, and user interpretation. As with any charting tool, its value lies in proper integration within a broader trading system, rather than as a standalone signal generator.