

If you’ve been trading for a while, you already know one thing: support and resistance levels can make or break your trades. They’re the invisible fences of the market areas where prices stall, bounce, or reverse completely. The problem? Manually plotting them is not only time-consuming but also subjective. That’s where the KG Support and Resistance Indicator for MT4 steps in.
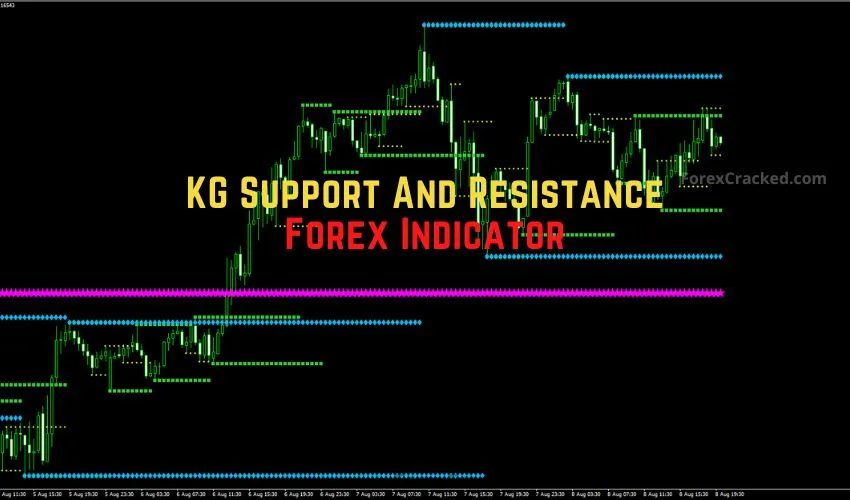
This isn’t your average support/resistance tool. It automatically identifies and draws zones based on historical price action, and it does it across multiple timeframes, all at once. No guesswork, just clean, color-coded levels that let you spot best support and resistance areas in seconds.
What Makes the KG Support and Resistance Indicator Different?
The beauty of this indicator is its multi-timeframe and color-coded design. Each color represents a different timeframe’s support or resistance zone:
- Yellow – 15-minute levels (great for scalping and intraday trades)
- Green – 1-hour levels (ideal for day trades)
- Blue – 4-hour levels (stronger swing trading zones)
- Magenta – Daily levels (major market structure)
This means you can instantly see if a level you’re watching is just a small intraday zone… or a heavyweight daily level where institutions might be active. And if multiple colors overlap? That’s confluence gold, a level you want to keep your eyes on.
How to Use the KG Support and Resistance Indicator in Trading
Unlike some flashy Forex indicators that fire off random buy/sell arrows, the KG Support and Resistance Indicator doesn’t tell you when to push the enter trade. Instead, it shows you where the battle between buyers and sellers is most likely to happen and leaves the trade opening to you.
Here’s how I use it in my trading:
Bounce Trades
- If price taps into a support zone (especially one tested multiple times) and shows bullish price action like a pin bar or engulfing candle, I’ll look for a long entry.
- Stop loss usually goes just below the zone.
Breakout Trades
- If price breaks above a resistance zone and retests it as support, that’s my cue to enter long.
- The same logic applies to shorts when the price breaks below a support zone and retests it.
Zone Strength
- The more overlapping zones from different timeframes, the more significant the level.
- For example, a 1-hour zone sitting right on top of a daily zone is a big deal. I’ll watch for strong reactions there.


Download a Collection of Indicators, Courses, and EA for FREE
Why Multi-Timeframe Zones Matter
Many traders get stuck because they only focus on their trading timeframe. A support level on a 15-minute chart might look strong… until you realize it’s sitting in the middle of nowhere on the daily chart.
The KG Support and Resistance Indicator fixes this by layering zones from multiple timeframes right in front of you. It’s like having the bigger picture and the micro details at the same time.
Pro Tips for Using the KG Support and Resistance Indicator
- Always confirm with price action; don’t take trades blindly at every zone.
- Look for confluence with moving averages, Fibonacci retracements, or trendlines.
- Pay attention to retests; break-and-retest setups at strong zones often lead to clean moves.
- Avoid trading directly into a strong opposing zone, for example, going long into a major resistance level.
Free Download KG Support and Resistance Indicator
Read More Smart Money Order Block Forex Strategy – Free MT4/MT5 Indicator
Final Thoughts
The KG Support and Resistance Indicator for MT4 is a simple yet powerful indicator that automates one of the most important parts of trading, identifying key support and resistance levels.
It gives you a multi-timeframe market structure at a glance, removes subjectivity, and lets you focus on execution instead of chart drawing. Whether you’re scalping, day trading, or swinging positions, this indicator can sharpen your timing and improve your accuracy.
If you’re serious about trading price action and want to trade with the market, not against it, this is one tool you’ll want on your chart.