

Introduction: The “No Noise” Approach to Trading
Most traders fail because they get distracted by “Market Noise,” small, meaningless price wiggles that trigger fear or greed. Traditional candlestick charts show you everything, including the noise.
The Point & Figure (P&F) v1.2 Indicator for MetaTrader 4 solves this by focusing on one thing only: Significant Price Movement.
Originally developed over 100 years ago to track price without time, the Point & Figure method is legendary among institutional traders. This v1.2 indicator brings that powerful logic to your MT4 terminal in a simplified, easy-to-read sub-window.
If you are tired of getting “whipsawed” by false breakouts, this tool helps you see the true battle between Supply (Resistance) and Demand (Support).
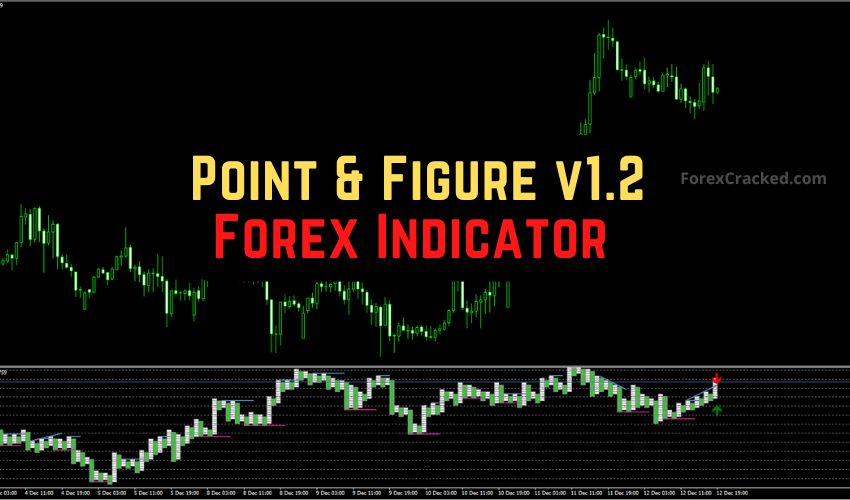
What is the Point & Figure v1.2 Indicator?
The Point & Figure v1.2 is a custom technical indicator that sits in a separate window below your main chart. Unlike the classic P&F chart that replaces your candles with Xs and Os, this version translates that data into a Histogram and Signal Bars.
It simplifies market analysis into two clear components:
- Trend Columns (Momentum): These tell you who is currently winning.
- Signal Bars (Levels): These tell you where the price is likely to reverse or breakout.
How to Read the Unique Signals:
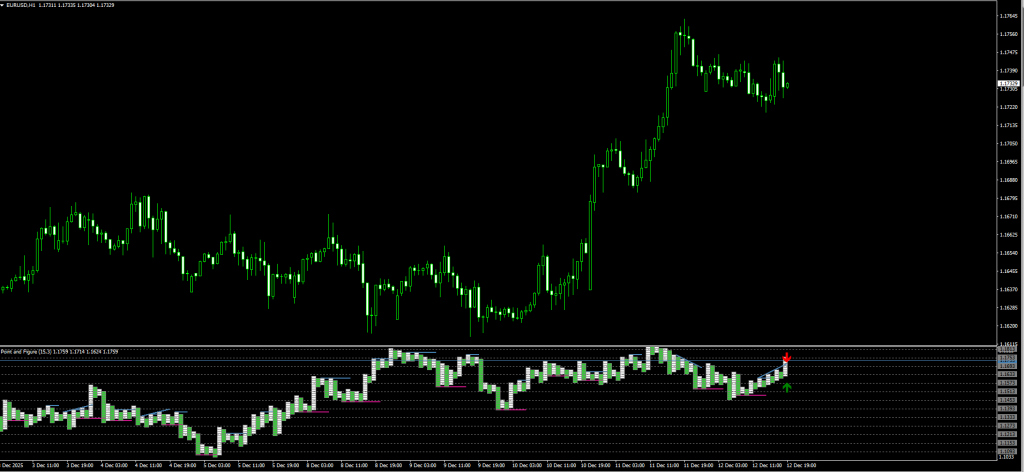
- White Columns: Represent Upward Momentum (Buyers are in control).
- Green Columns: Represent Downward Momentum (Sellers are in control). Note: This differs from standard charts, where green usually indicates up.
- Red Bars: Indicate a Support Level. This is a potential “Floor” for price.
- Blue Bars: Indicate a Resistance Level. This is a potential “Ceiling” for price.
Review: Pros and Cons
Is this centuries-old method still valid for 2025 markets? Here is our honest verdict.
✅ PROS (The Good)
- Filters Noise: It ignores small time-wasting moves, keeping you in the trade longer.
- Automatic Levels: Automatically draw the Red (Support) and Blue (Resistance) zones.
- Trend Clarity: The blocky White/Green histogram makes the trend direction obvious at a glance.
- Great for Swing Trading: Works exceptionally well on H4 and Daily charts where trends are stable.
❌ CONS (The Bad)
- Lag on Lower Timeframes: We do not recommend this for scalping on M1 or M5. It reacts too slowly to sudden spikes.
- Counterintuitive Colors: Remember that Green = Down, which can confuse new traders.
- Requires Confirmation: Buying blindly off a Red Support bar can be dangerous if the trend is crashing hard. (See the strategy below.)


Download a Collection of Indicators, Courses, and EA for FREE
The Strategy: The “P&F Breakout” System
The sample strategy suggests buying support and selling resistance. However, in a strong trend, support breaks easily. To make this professional-grade, we add a “False Check” Filter.
We will use the 50 Exponential Moving Average (EMA) to identify the dominant trend and the MACD to confirm momentum strength.
Setup & Settings
- Point & Figure v1.2 Indicator: Default Settings.
- 50 EMA: Trend Filter (Applied to Close).
- MACD: Default (12, 26, 9) for Momentum Confirmation.
- Timeframe: H1, H4, or Daily.
1. The “Support Bounce” Buy Setup
We are looking to buy when the price hits a floor during an uptrend.
- The Filter: Price must be ABOVE the 50 EMA. This confirms the primary trend is Bullish.
- The Signal: Look at the Point & Figure window. A Red Bar (Support) appears.
- The Trigger: Wait for a White Column to form right after the Red Bar. This means buyers have stepped in to support.
- The False Check: Check the MACD. The MACD Histogram should be rising or above zero.
- Entry: Enter at the close of the candle corresponding to the first White Column.
- Stop Loss: Below the recent swing low.
- Take Profit: Target the next Blue Bar (Resistance) or a 1:2 Risk/Reward ratio.
2. The “Resistance Reject” Sell Setup
We are looking to sell when the price hits a ceiling during a downtrend.
- The Filter: Price must be BELOW the 50 EMA. This confirms the primary trend is Bearish.
- The Signal: Look at the Point & Figure window. A Blue Bar (Resistance) appears.
- The Trigger: Wait for a Green Column to form right after the Blue Bar. This means sellers are rejecting the price.
- The False Check: Check the MACD. The MACD Histogram should be falling or below zero.
- Entry: Enter at the close of the candle corresponding to the first Green Column.
- Stop Loss: Above the recent swing high.
- Take Profit: Target the next Red Bar (Support) or a 1:2 Risk/Reward ratio.
Pro Tip: Never trade against the 50 EMA. If the price is crashing (Below EMA) and you see a Red Support bar, do not buy. Wait for the price to break through that support, then look for a sell setup.
Indicator Settings: Optimizing for 2025
When you open the input tab, you may see settings like BoxSize or Range.
- BoxSize (Sensitivity):
- Default: Usually optimized for H1.
- Tweak: If you trade Gold (XAUUSD) or Volatile pairs (GBP/JPY), double the BoxSize. This reduces false signals caused by high volatility.
- Timeframe: Stick to H4 and D1. Point & Figure logic requires significant data to form valid “Columns,” making it unreliable on M5/M15.
[Understanding Support & Resistance with Indicators]
“See the logic in action: This video explains how automated Support & Resistance levels (like the ones in P&F v1.2) help you spot reversals accurately.”
How to Install the Indicator
- Download the Point_Figure_v1.2.ex4 file from the link below.
- Open MetaTrader 4.
- Go to File > Open Data Folder.
- Navigate to MQL4 > Indicators.
- Paste the file into this folder.
- Restart MT4, or Right-Click “Navigator” and select “Refresh”.
- Drag the indicator onto your chart.
FAQ: Frequently Asked Questions
Why are the Green bars for selling? Usually, Green means buy.
This specific version (v1.2) uses Green for downward trends and White for upward trends. Always check the histogram direction relative to the Zero line or the previous column to be sure.
Does it work on Crypto?
Yes, Point & Figure is excellent for Bitcoin because it filters out the “weekend noise” and focuses purely on the massive trend moves common in Crypto.
Does the indicator repaint?
The Support/Resistance bars (Red/Blue) may shift if the price creates a new High/Low before the column reverses. Always wait for the Column Color Change (e.g., Green to White) to confirm the move is locked in.
Final Verdict: Is it Worth Using?
Score: 4/5 Stars ⭐⭐⭐⭐
The Point & Figure v1.2 Indicator is a fantastic tool for patience. It forces you to ignore the minute-by-minute anxiety of candlestick wicks and focus on the bigger picture.
While the color scheme takes some getting used to, the Support/Resistance signaling is top-tier. Use it with our 50 EMA Filter Strategy to create a powerful trend-following system.