

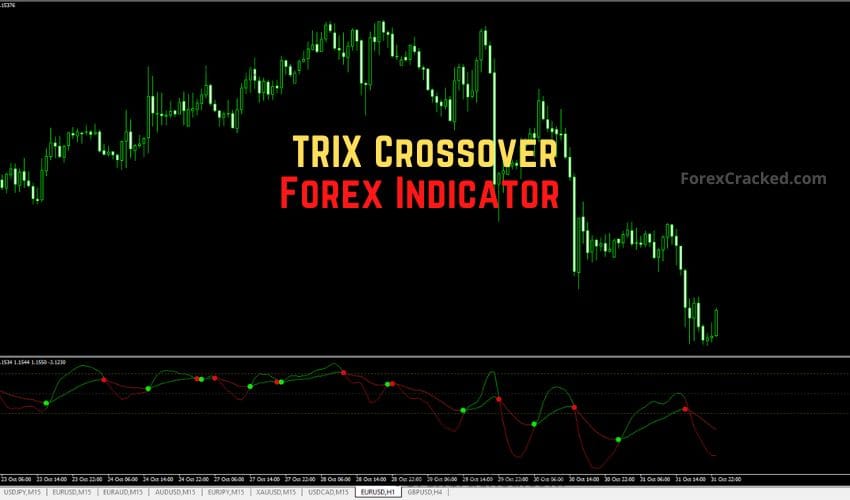
The TRIX Crossover Forex Indicator for MT4/MT5 is an upgraded version of the classic Moving Average trend indicator. It uses a Triple Exponential Moving Average (TEMA) to smooth price data, eliminate noise, and generate more reliable buy and sell signals.
Many standard indicators in MetaTrader struggle to filter out market whipsaws accurately, but the TRIX indicator does. Crossover solves that problem beautifully. It’s one of those rare tools that helps traders clearly distinguish between trending and flat (sideways) market conditions.
Whether you’re a swing trader, scalper, or intraday trader, the “TRIX” Crossover Indicator can dramatically improve your trend entries by providing clean crossover alerts and identifying overbought and oversold zones with precision.
What Is the TRIX Crossover Indicator?
The TRIX Crossover Indicator, also called Trix, automatically calculates a Triple Exponential Moving Average (TEMA) to smooth out short-term fluctuations in price.
Unlike a regular Moving Average, which can be sensitive to small price movements, the TRIX filters out market noise and focuses only on meaningful trend shifts.
It consists of two lines:
- Fast Line (signal line) – reacts quickly to market changes.
- Slow Line (main Line) – represents the overall market trend.
The indicator is displayed in a separate window below your chart, which keeps your price action area clean and easy to read.
When the fast Line crosses the slow Line, the indicator generates a buy or sell signal, simple, clear, and effective.
How the TRIX Crossover Works
The TRIX Crossover uses the difference between a fast and slow triple exponential moving average to determine momentum and market direction.
Here’s what you’ll see:
- Green dots – appear when the fast Line crosses above the slow Line → Buy Signal.
- Red dots – appear when the fast Line crosses below the slow Line → Sell Signal.
- A zero line acts as a midpoint; readings above it show bullish momentum, while readings below it suggest bearish momentum.
When the indicator values rise above the zero Line, it indicates strong buying pressure or an overbought condition. Conversely, when values fall below the zero Line, it signals selling pressure or an oversold market.
This color-coded crossover system enables traders to identify the beginning and end of strong market moves visually.
TRIX Crossover Buy Signal
- Wait for the fast Line to cross above the slow Line, and a green dot appears.
- Confirm the crossover happens below or near the zero Line, signaling the start of upward momentum.
- Enter a BUY trade at the next candle close.
- Set your stop loss just below a nearby support level.
- Exit when the indicator posts a red dot or the lines cross downward again.
Pro Tip: Combine the TRIX Crossover with a Support and Resistance indicator to confirm your entry point and manage risk effectively.
TRIX Crossover Sell Signal
- Wait for the fast Line to cross below the slow Line, and a red dot appears.
- Confirm the crossover occurs above the zero Line, signaling overbought conditions and bearish momentum.
- Enter a SELL trade at the next candle close.
- Place a stop loss just above the nearest resistance level.
- Exit the trade once the next green dot appears or when the lines cross back upward.
Pro Tip: The higher the TRIX values are above zero, the stronger the overbought condition. The deeper below zero, the stronger the oversold condition becomes, making it ideal for countertrend setups.


Download a Collection of Indicators, Courses, and EA for FREE
Trading Example
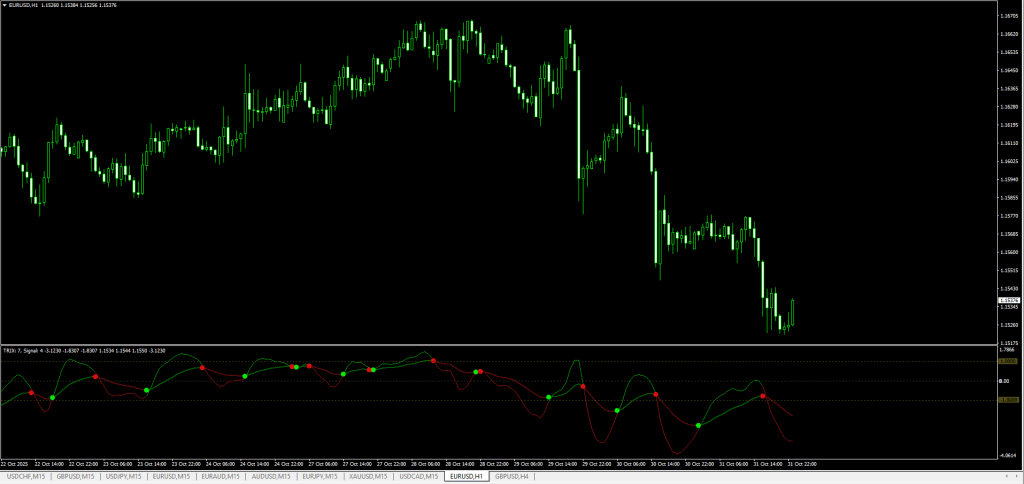
In the EUR/USD H1 example, the TRIX Crossover indicator displayed a green dot as the fast Line crossed above the slow Line, just below the zero level. Price quickly gained momentum, and the market rallied for over 80 pips.
Later, a red dot appeared as the fast Line dropped below the slow Line near resistance, signaling a clean sell entry. This setup captured another strong move to the downside.
The TRIX Crossover effectively filtered out noise and avoided false entries that a standard Moving Average crossover would’ve generated.
Why Traders Love the TRIX Crossover
The TRIX Crossover Indicator is not just another moving average; it’s smarter, smoother, and more responsive. It’s designed to help you trade in Line with real momentum, not just random price fluctuations.
Key Benefits:
- Filters out market noise and false signals.
- Combines trend strength and direction in one display.
- Generates clear buy/sell crossover alerts.
- Identifies overbought/oversold zones visually.
- Works across forex, stocks, metals, indices, and crypto.
- Ideal for all timeframes from M5 to D1.
- Free, lightweight, and non-repainting.
Tips for Using TRIX Crossover Effectively
- Avoid using it alone in ranging markets; combine it with trend confirmation tools, such as the ADX or Moving Average filters.
- Watch for divergences between TRIX and price for early reversal warnings.
- Use higher timeframes (H1, H4) for more reliable trend entries.
- Combine with Support and Resistance or Fibonacci levels for exits.
Free Download TRIX Crossover Forex Indicator
[Mirror Download TRIX Crossover MT4] [Mirror Download TRIX Crossover MT5]
Read More AO Divergence Forex Indicator – Awesome Oscillator Divergence Trading Tool
Conclusion
The TRIX Crossover Forex Indicator for MT4/MT5 is one of the most practical tools for identifying genuine trend opportunities and filtering out market noise. By using a triple exponential smoothing technique, it generates cleaner, more reliable signals than a traditional Moving Average crossover.
It’s perfect for traders who want to simplify their analysis without sacrificing accuracy. Combine it with your existing strategy, and you’ll start spotting stronger, more confident entries and exits.
Download the TRIX Crossover Forex Indicator for MT4/MT5 today and start trading smarter with precision crossover signals.
Frequently Asked Questions (FAQ)
1. Does the TRIX Crossover repaint?
No, once the crossover is formed, it stays fixed after the candle closes.
2. Can I use it for scalping?
Yes, it performs well on M5 and M15 charts during volatile sessions.
3. Is it suitable for crypto trading?
Works across all asset classes, including cryptocurrencies, metals, and indices.
4. What’s the best timeframe to use it on?
H1 and H4 charts provide the most reliable trend signals.
5. Should I combine it with other indicators?
Yes, pairing it with Support and Resistance, RSI, or ADX increases signal accuracy.
How do i know what to do when there is a double signal?