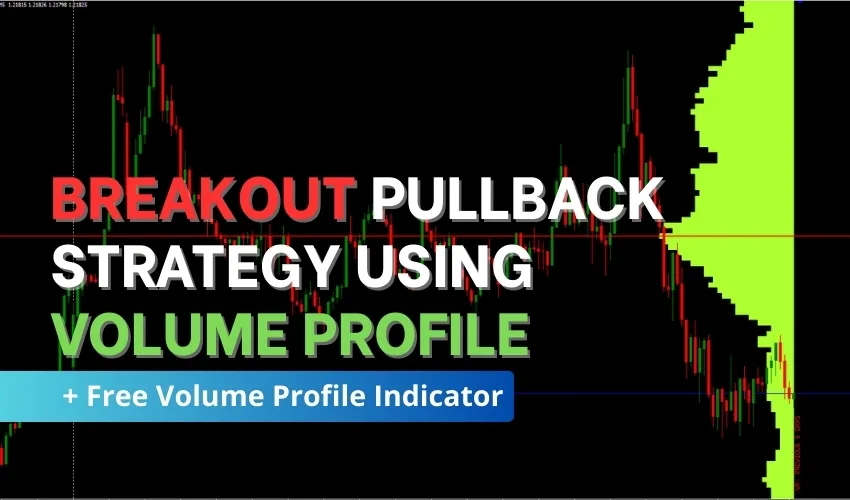
Most traders waste energy chasing every breakout or guessing entries but the market rewards patience and structure, not guesswork. The real edge comes from knowing where the key levels are, then waiting for the right moment to act.
That’s the foundation of the Volume Weighted Breakout Pullback Strategy for Forex. Instead of rushing in, you’ll learn to trade clean structures, filter weak signals with ATR, and only enter when price retests the breakout zone with conviction.
The steps are simple but powerful:
- Wait for a breakout candle to close beyond a defined range.
- Enter on the first clean pullback to that broken level.
- Manage risk with clear stop-loss rules and scale profits logically.
To refine this further, the Free Volume Profile Indicator MT4 highlights the Point of Control (POC), Value Area, and major high/low volume nodes. This extra layer shows you where liquidity clusters helping you place smarter stops, set realistic targets, and catch higher quality retests.
Table of Contents
Step-by-Step Breakout Pullback Strategy for Forex
This Pullback strategy is built on a simple idea: wait for a breakout of a well-defined range, then enter on the first clean pullback to that broken level. By following structure and adding a volatility filter, you avoid weak fake-outs and trade only when the odds are in your favor. Here’s the full playbook:
1. Market Setup: Where and When to Trade

To maximize clean signals, start with markets that are liquid and active.
- Best Pairs: EURUSD, GBPUSD, USDJPY (tight spreads, consistent volume).
- When to Trade: Focus on the London and New York sessions, or better yet, their overlap this is when volatility and follow through are strongest.
- Timeframes to Use:
- Bias: Higher timeframes (H4 → H1) to spot the bigger trend.
- Execution: Lower timeframes (M15, optionally M5 once experienced) to time entries.
- Pro Tip: Keep your chart layout clean H1 bias chart on one side, M15 execution chart on the other, with an ATR(14) indicator on M15 for volatility filtering.
2. Defining the Range: Spot the Pressure Zone
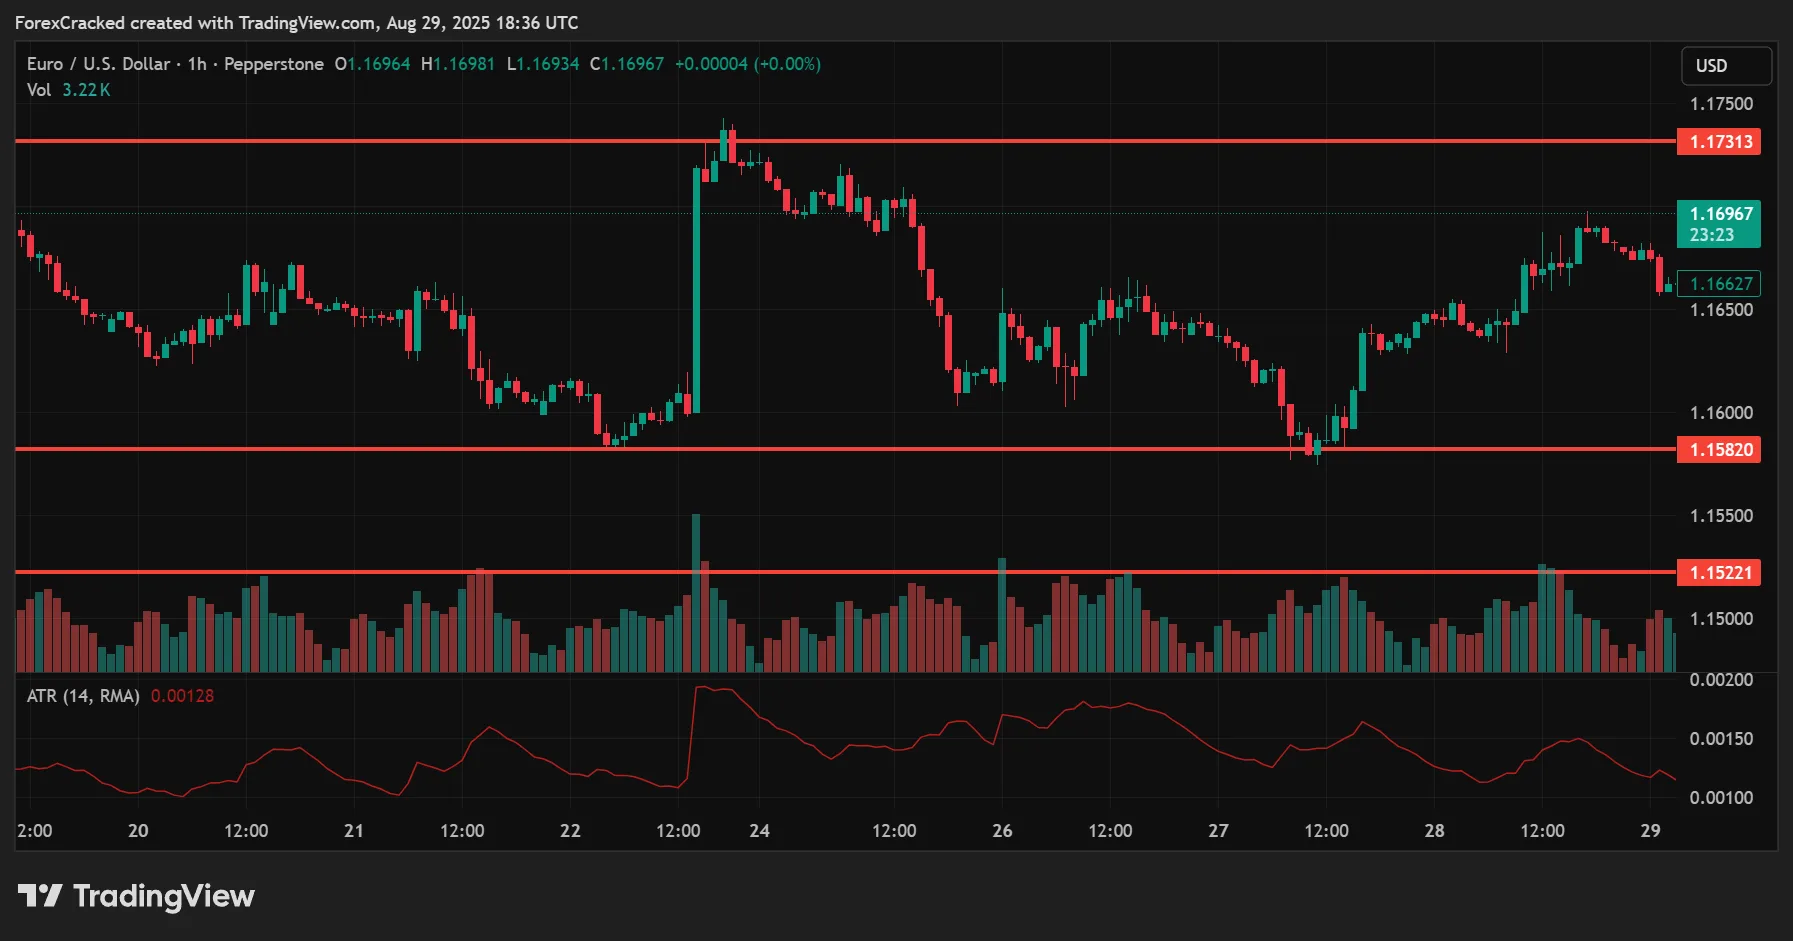
A strong trade begins with a clearly defined range.
- On the H1 chart, mark swing highs and lows that price has respected at least twice.
- Look for compression or buildup a cluster of small candles hugging the level. This signals energy building up before a breakout.
- Avoid messy zones where price whipsaws both directions clarity is key.
3. The Breakout Trigger: Filter Weak Moves
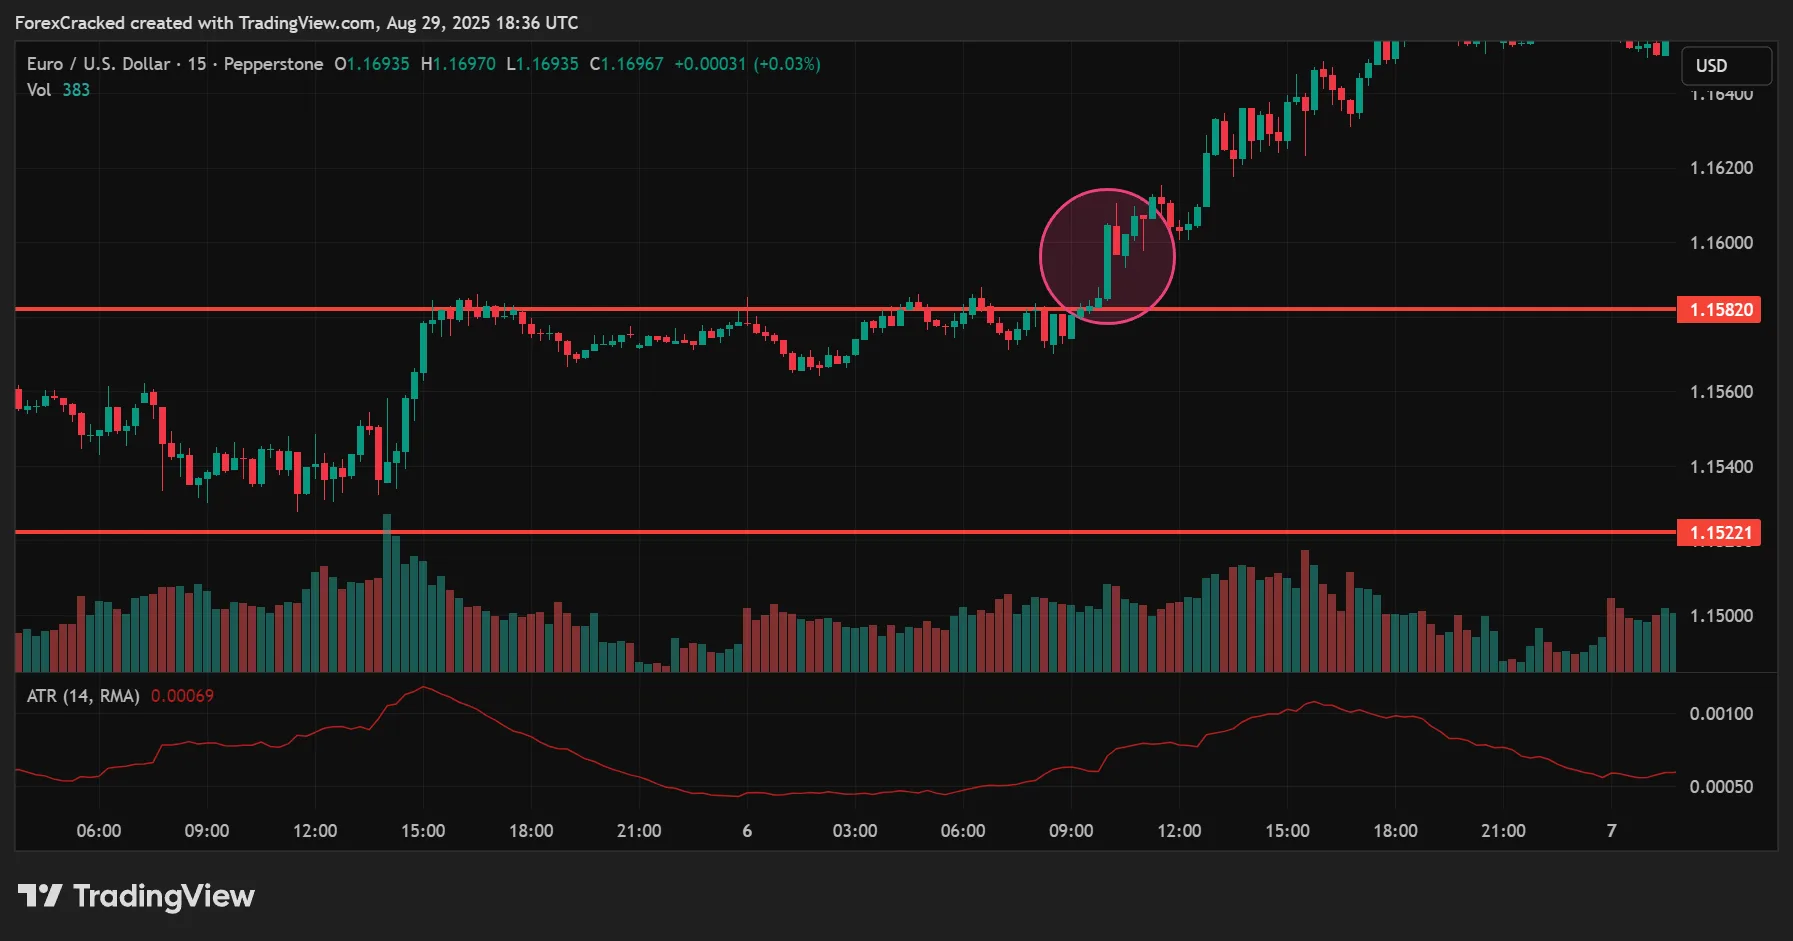
Not all breakouts are created equal. Use these rules to separate strong breaks from fake-outs:
- Wait for a full candle close outside the range on the M15 chart. Ignore wick pokes.
- Apply a volatility filter: the breakout candle should be at least 0.8 × ATR(14) in size.
- No trade rule: If the breakout immediately runs into a higher-timeframe supply/demand zone within 0.5R distance, skip the setup it lacks room to run.
4. The Pullback Entry: Where Precision Happens
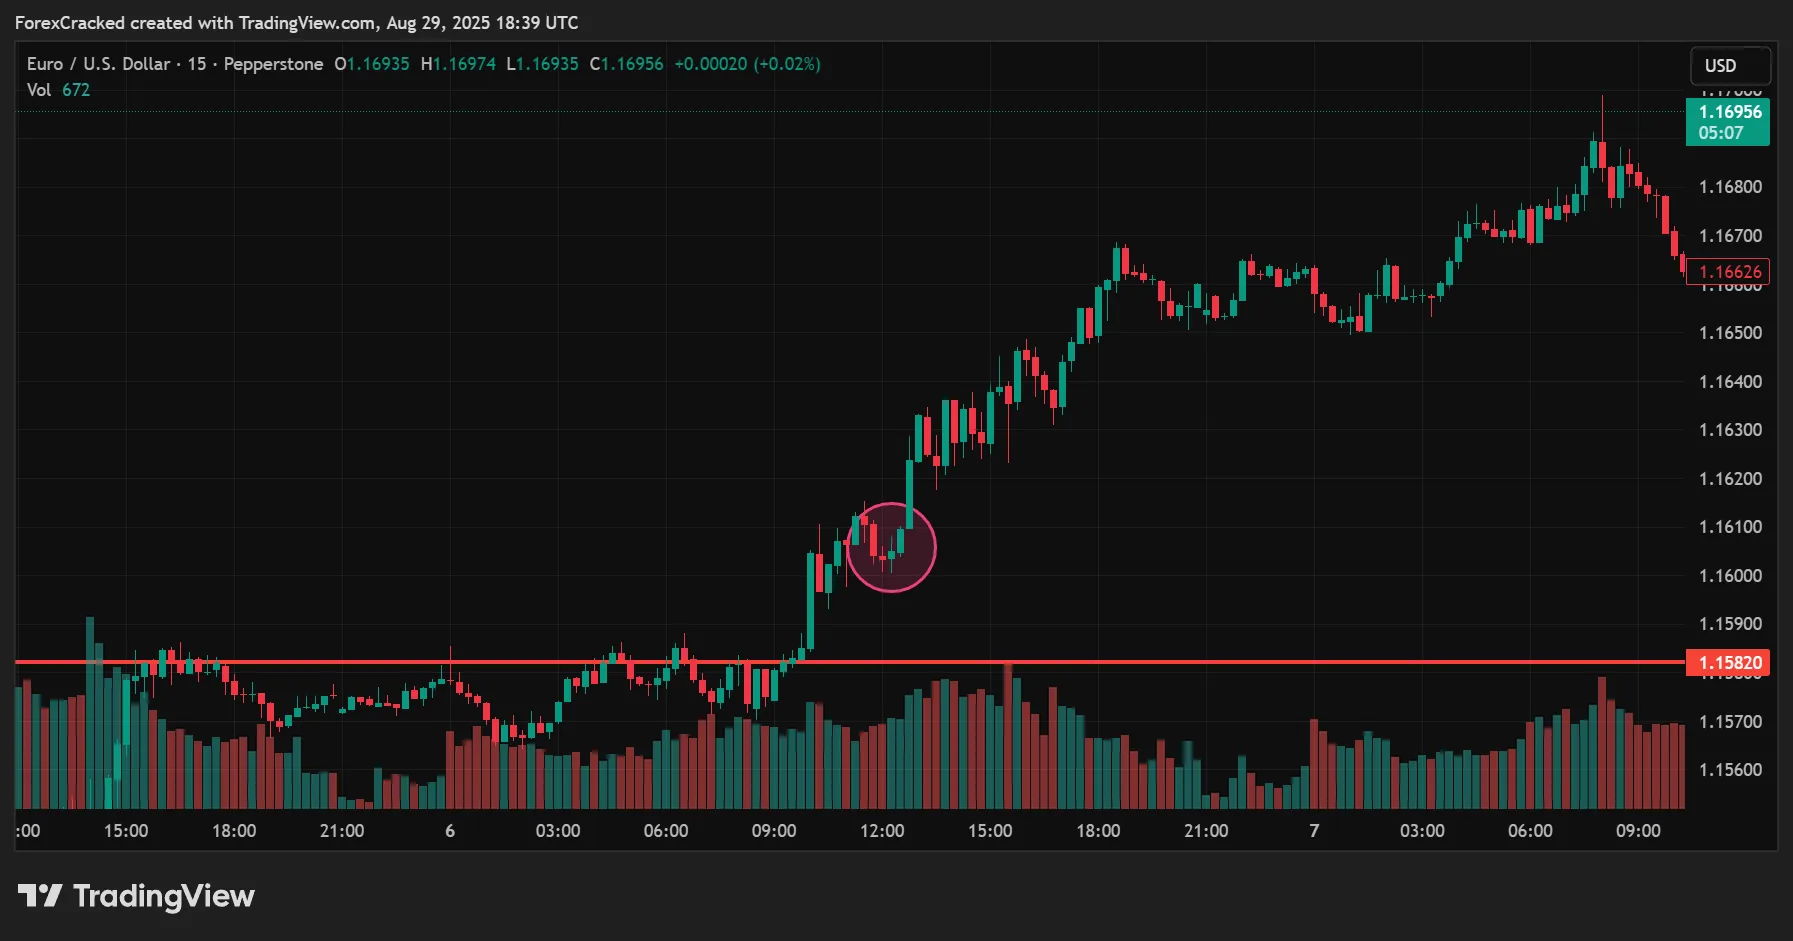
The pullback is your golden entry. Here’s how to nail it:
- Wait for price to retouch the broken range edge (old resistance for longs, old support for shorts).
- Confirmation signals:
- Longs: Bullish rejection wick or small bullish engulfing candle at/above the retest zone.
- Shorts: Bearish rejection wick or small bearish engulfing at/below the retest zone.
- Patience filter: If no retest happens within 3–5 M15 candles, skip it. Don’t chase late moves the market will give you another setup.
5. Stop-Loss Placement and Invalidation Rules
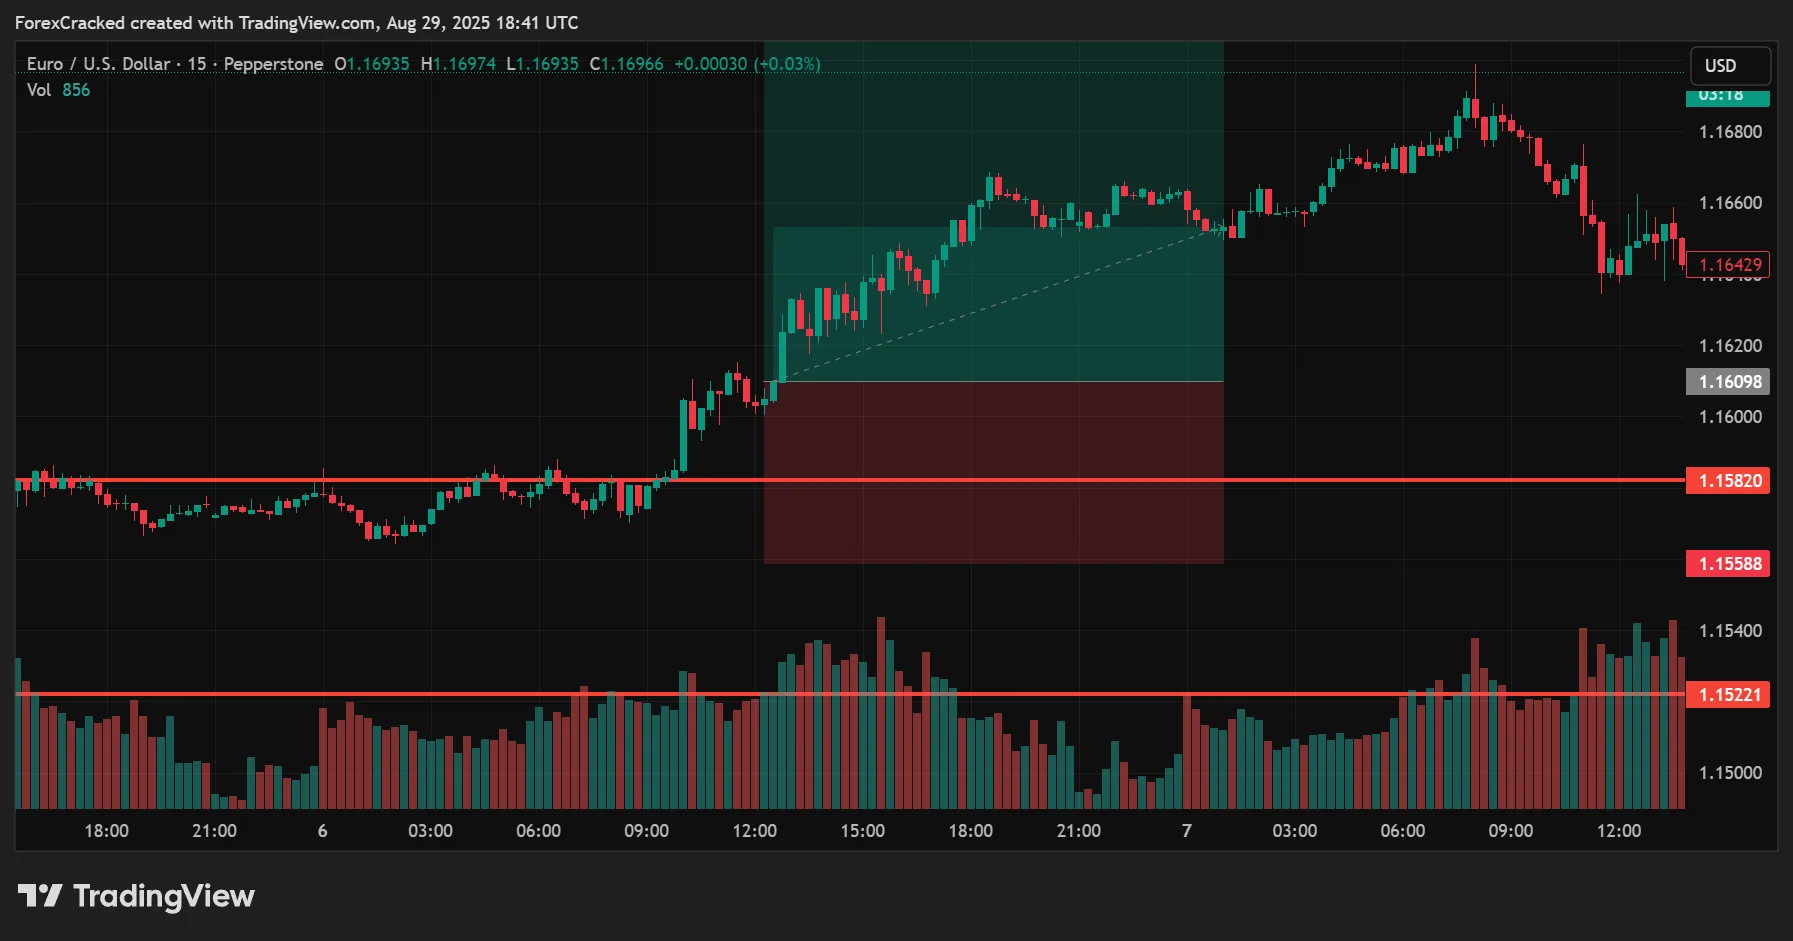
Protecting your account is priority #1.
- Structure Stop: Place SL a few pips beyond the opposite side of the retest zone.
- ATR Stop: Alternatively, use 1 × ATR(14) beyond the zone for consistency.
- Non-Negotiables:
- Risk ≤1% per trade (≤0.5% for new traders).
- Never widen stops after entry. The only adjustment allowed is tightening as the trade moves in your favor.
6. Take-Profit Levels and Trade Management
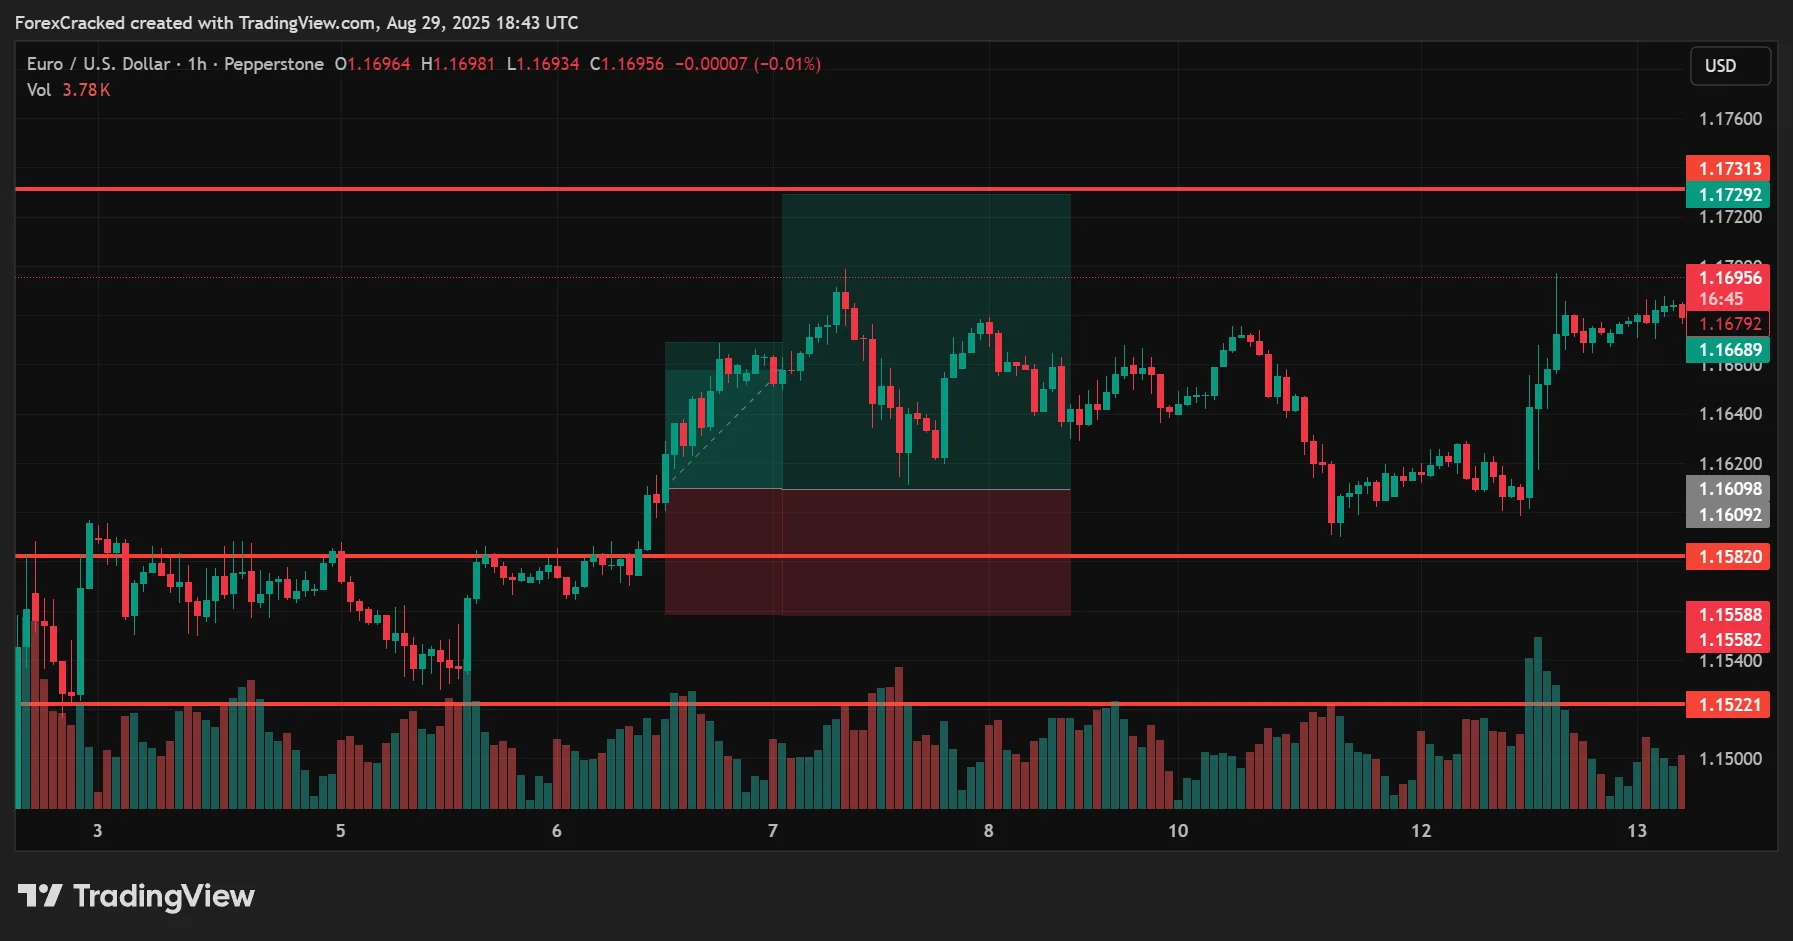
Manage your trade with logic, not emotion:
- TP1 (First Target): +1R → bank 50% and move SL to breakeven.
- TP2 (Final Target): +2R to +3R or the next clear H1 swing.
- Trailing Stop: After TP1, trail SL under/above minor structure swings.
- Time Stop: If price drifts back into the old range and closes there for 2 candles, exit the trade. The idea is invalidated.
7. News and Volatility Filters
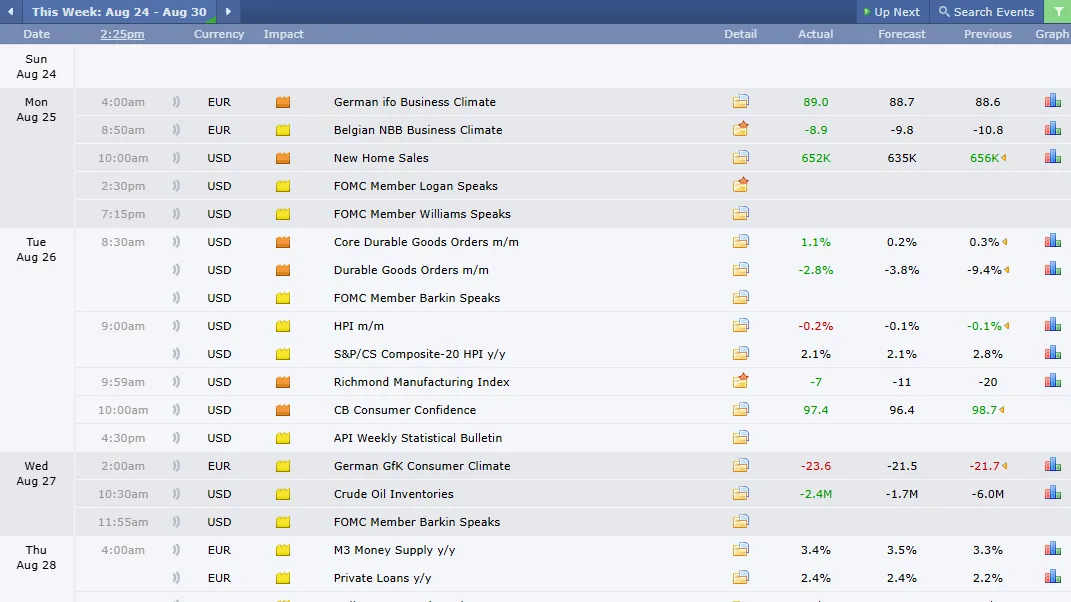
Even the best setup can get wrecked by news. Follow these filters:
- Avoid trading 15 minutes before or after high-impact news on the pair you’re trading.
- Skip trades if the Average Daily Range (ADR) has already been exceeded by more than 120% before your setup forms most of the day’s move is done.
8. Breakout Strategy in Action: Trade Examples
Bullish Breakout Example (EURUSD)
- H1 shows a clean 2-day range.
- M15 closes above the range high; candle size passes ATR filter.
- Price retests the broken high → bullish rejection wick forms.
- Entry: Long on candle close.
- SL: Few pips below retest (or ATR stop).
- TP1: +1R banked and SL moved to BE.
- TP2: +3R at next swing high; trail remainder.
Bearish Breakout Example (GBPUSD)
- H4 in a downtrend; H1 consolidates near support.
- M15 closes below the floor with strong body.
- Price retests broken low → bearish rejection candle.
- Entry: Short at retest.
- SL: Above the retest zone.
- TP1: +1R, partial taken.
- TP2: Next H1 demand shelf or +2R; trail remainder.
9. Execution Checklist
Use this checklist to avoid impulsive trades:
- Higher timeframe bias aligns with the breakout direction.
- Breakout candle closes outside range and passes ATR filter.
- Pullback retest forms with a clear rejection signal.
- Risk sizing applied (≤1% per trade).
- TP1 and TP2 mapped before entry.
- No red-folder news within 15 minutes.
- Journal entry filled out before and after trade.
Download a Collection of Indicators, Courses, and EA for FREE
How the Volume Profile Indicator (MT4) Supercharges This Strategy

The breakout pullback strategy already gives you a solid trading edge. But to take it one step further, you can add the Volume Profile Indicator for MT4. This tool doesn’t generate buy or sell signals on its own it simply shows you where the market has traded the most volume at different price levels. That extra layer of context helps you refine entries, place smarter stop-losses, and set more realistic profit targets.
What the Volume Profile Indicator Shows
When you load the indicator, you’ll see horizontal volume bars plotted across price levels. These reveal which prices attracted the most trading activity. Here are the key elements:
- Point of Control (POC):
The single price level with the highest traded volume. Think of it as a magnet or barrier. Price often reacts around this level because that’s where the most business has been done. - Value Area (VA):
Roughly 70% of all traded volume. It represents the “fair value zone” where the majority of trading happened. Price inside this area tends to behave more mean-reversion-like, while moves outside suggest directional strength. - High Volume Nodes (HVN):
Thick shelves of volume that act like strong support or resistance. Price often slows or bounces at these levels. - Low Volume Nodes (LVN):
Thin areas of volume that act like gaps. Price can move quickly through these levels because little trading took place there.
How to Use Volume Profile with the Breakout Pullback Strategy
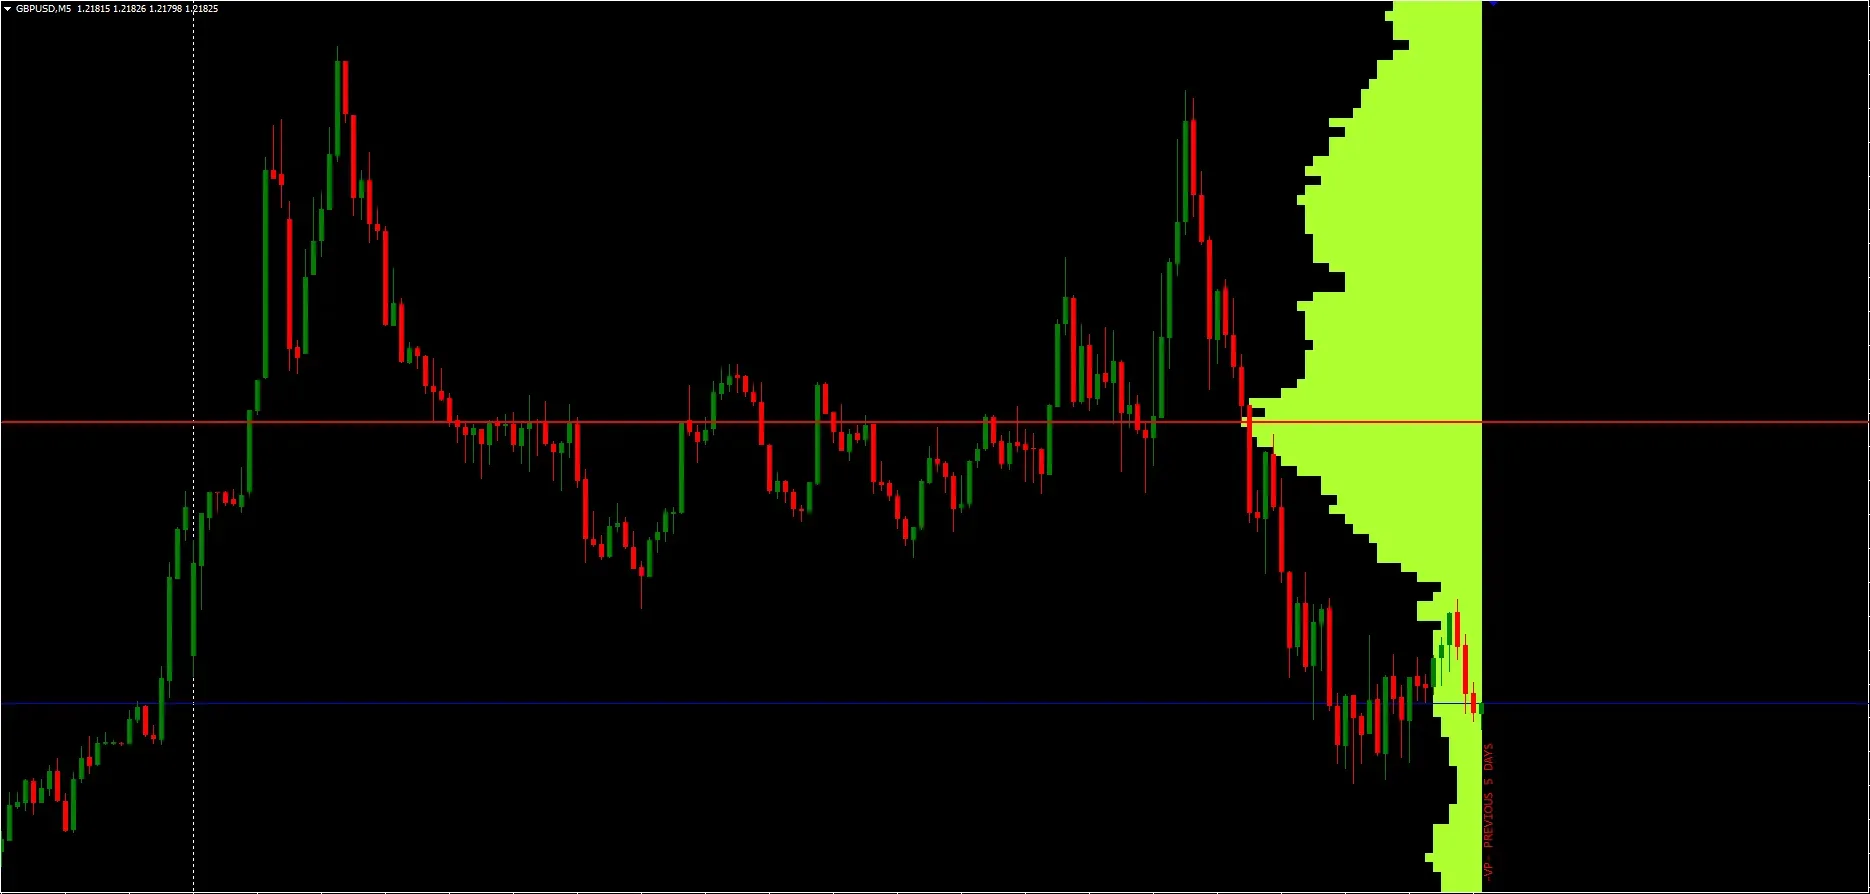
The indicator is not meant to replace your plan it’s a bonus filter that gives you more precision. Here’s how to integrate it:
- Refining Entry Points
- If your pullback retest aligns with the POC or a High Volume Node, the rejection signal becomes stronger. This confluence often means other traders are watching the same level.
- Smarter Stop-Loss Placement
- Instead of placing stops randomly, position your SL just outside a high-volume zone. This prevents you from getting wicked out by minor noise inside the level.
- Target Framing
- Set profit targets before the next major High Volume Node or at the Value Area boundaries. This ensures you’re taking profits at logical areas where the market may stall.
- Breakout Confirmation
- A breakout that pushes and holds outside the Value Area has a higher chance of continuation.
- If price breaks out but quickly falls back into the Value Area, it’s a warning sign that the move may fade into a range.
Quick Installation Guide (MT4 in 60 Seconds)
Adding the Volume Profile Indicator to MT4 is simple:
- Download the indicator file (from the free resource).
- Open MT4 → go to File → Open Data Folder → MQL4 → Indicators.
- Paste the file into the Indicators folder.
- Restart MT4.
- Attach the indicator to your chart. Default settings work fine for beginners; advanced traders can adjust the look-back period for different sessions or ranges.
With this tool, you’re no longer just trading a breakout and pullback you’re trading it with market structure and liquidity in mind. That means fewer false entries, better-protected stops, and more confident exits.
FAQs
Q: does this Pullback Strategy work on gold or indices?
A: the logic is transferable. start with majors; once consistent, test XAUUSD/indices with wider ATR-based stops and adjusted session expectations.
Q: what if price never retests after the breakout?
A: skip it. we’re trading A+ retests only. the edge is consistency, not chasing.
Q: how do i pick between structure SL vs ATR SL?
A: choose one for 50+ trades. review expectancy and max drawdown. switch only if data proves it.
Q: i got wicked out then price ran. what now?
A: log it. consider the ATR method or “SL just outside HVN” rule. don’t widen live; adapt rules after a sample.
Q: does Volume Profile replace support/resistance?
A: no. it visualizes where business was done. we still trade levels and structure first.
Q: which timeframes are best?
A: H4/H1 for bias, M15 for entries. M5 is optional once you’re fluent and disciplined.
Risk Management, Trading Psychology, and Discipline
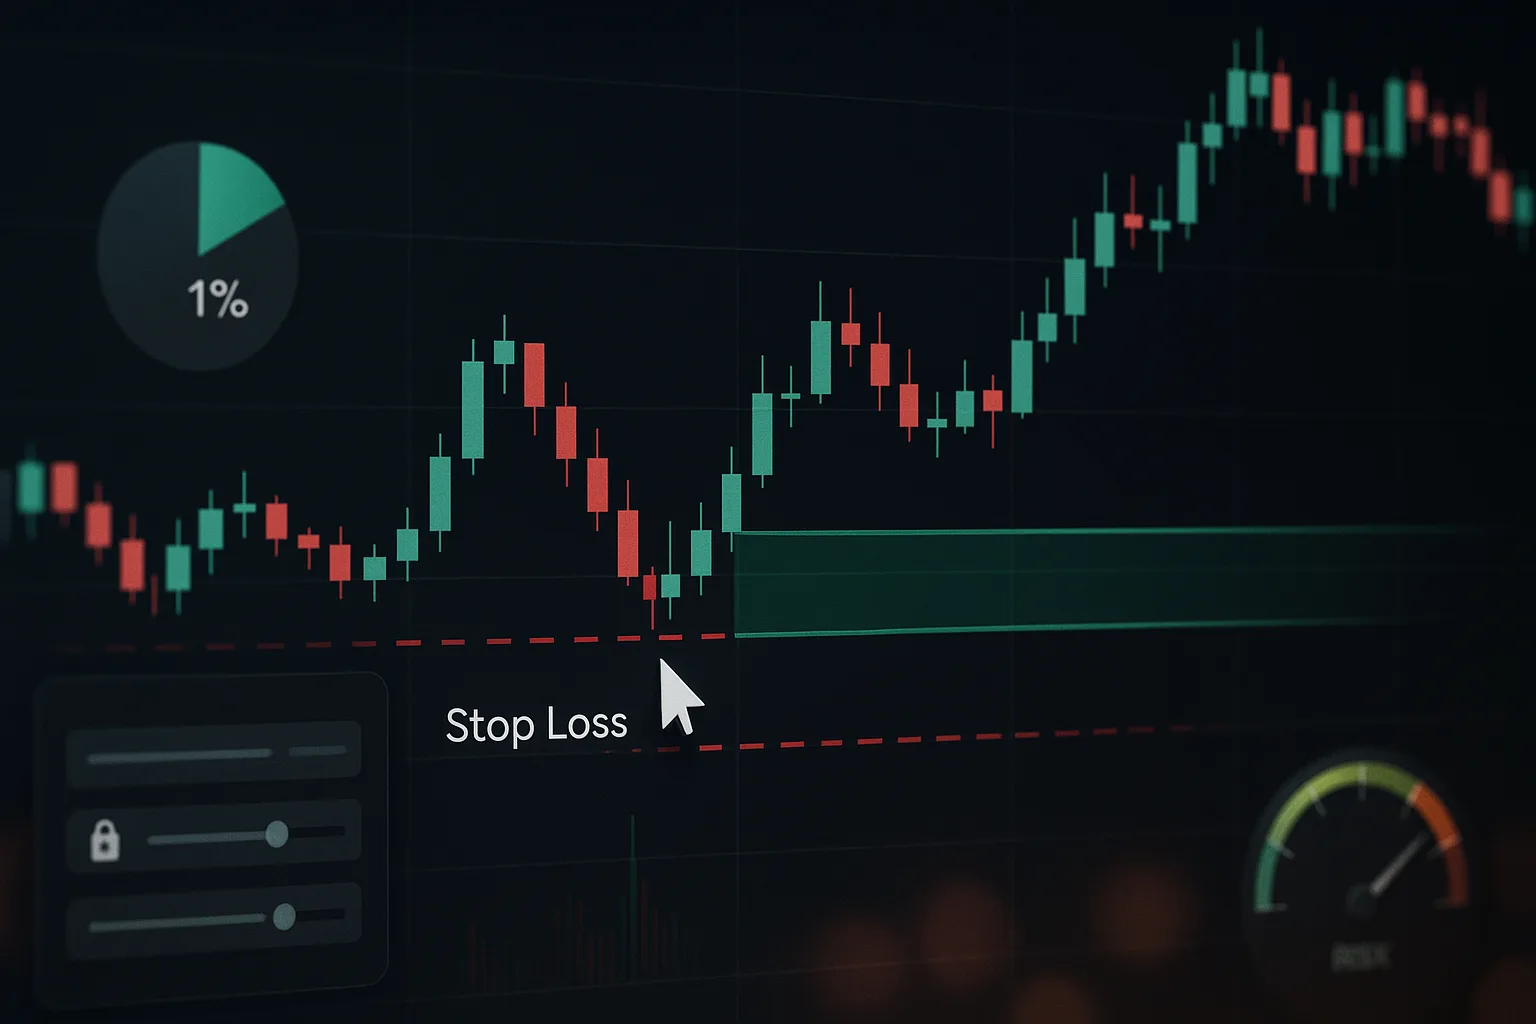
A good breakout strategy is nothing without solid risk control and the right mindset. Here are the key principles to follow:
1. Position Sizing: Protecting Your Account
Always use fixed-fractional risk risking only a small percentage of your account on each trade (typically 0.5%–1%). This way, even a string of losing trades won’t wipe out your capital and you’ll live to trade another day.
2. Daily Circuit Breaker: Know When to Stop
Set a personal cutoff rule. For example: stop trading if you lose 3% of your account in a day or hit 3 consecutive losses. This prevents emotional overtrading and protects you from “spiral days” where small mistakes turn into big ones.
3. Emotional State Check: Trade Only With a Clear Mind
Never place trades when you’re tired, angry, or chasing losses out of FOMO. Emotional trading leads to poor decisions. Before every session, ask yourself: Am I calm, focused, and disciplined enough to follow the plan? If not, step away.
4. Process Over Outcome: Focus on Execution, Not Just P/L
Successful traders judge themselves by whether they followed their rules, not by whether one trade was a win or loss. Losses are part of the game. The real goal is consistent, disciplined execution that produces profits over a large sample of trades.
Backtesting and Forward Testing Plan for Forex Strategies

No breakout strategy is complete without proper backtesting and forward testing. This step ensures your strategy has a real edge and isn’t just a lucky setup. Here’s how to test it effectively:
1. Test Across Market Conditions
Don’t rely on one type of chart. Backtest across different data slices, including:
- Trending phases (clear uptrends and downtrends)
- Range-bound markets (sideways chop)
- High-volatility weeks (news-heavy or crisis periods)
This shows whether your strategy works in multiple environments or only in one.
2. Aim for a Meaningful Sample Size
One or two trades prove nothing. A solid backtest should include at least 100 trades across different months and conditions. The larger the sample, the more reliable your results.
3. Use Out-of-Sample (OOS) Testing
After fine tuning your rules, always test the strategy again on a different quarter or dataset. This prevents curve-fitting and shows whether the system is truly robust.
4. Key Metrics to Track
When backtesting this Pullback Strategy, log more than just win/loss. Track:
- Win rate (how often you win)
- Average R-multiple (risk-to-reward achieved per trade)
- Profit factor (gross profit ÷ gross loss)
- Maximum drawdown (DD) (largest equity dip)
- Expectancy (average R per trade)
- Time in trade (helps spot if trades drag too long)
5. Robustness Checks
Make small tweaks to confirm your system holds up:
- Change ATR(14) to 12 or 16.
- Compare TP2 at 2R vs. 3R.
- Adjust pullback retest window (3 candles vs. 5).
If results remain consistent, your edge is real.
6. Trade Journal Template (Log Everything)
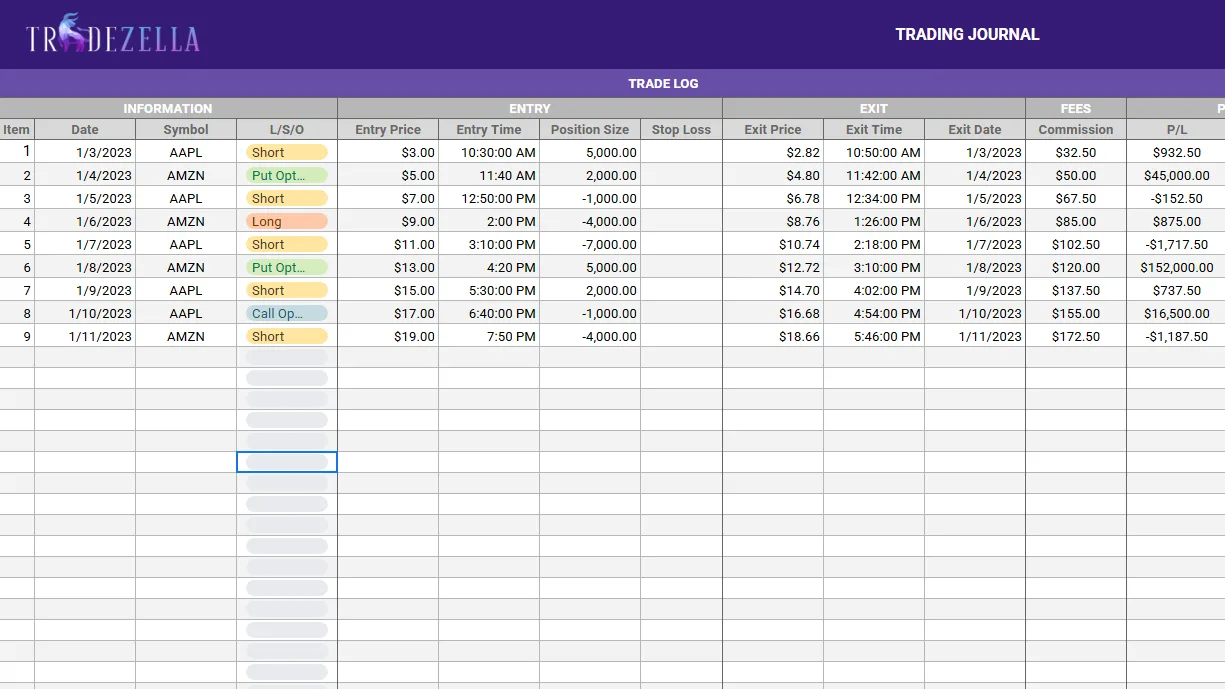
Use a structured journal to capture both data and psychology. A simple spreadsheet with these columns works:
Date | Pair | Session | HTF Bias | Range Size | Breakout ATR Pass? | Entry Type | SL Method | R Planned | R Achieved | TP1 Hit? | Notes | Emotion (Pre/Post)
This mix of technical data and emotional notes will help you refine both your system and your discipline.
Conclusion
This breakout strategy is all about structure and discipline: trade the breakout–pullback in the direction of the higher timeframe, filter weak moves with ATR(14), and only enter on clean rejection at the retest. Manage risk with stops just beyond the zone, take partial profits at +1R, and trail the rest while avoiding red-folder news traps.
The Volume Profile Indicator for MT4 is a bonus tool to refine entries, stops, and targets not a system on its own. Keep journaling every trade, review after 50–100 samples, and focus on process over outcome. That’s how consistency and confidence are built.

