
Pullback Trading Strategy
We trade the Pullback Trading strategy 4H and 1H charts only; you can try any other timeframe, but for us, at least it is not worth it.
The best trading advice everybody knows is: NEVER TRADE AGAINST THE TREND. But how to define and find which trend you want to follow and catch?
Well, there it goes:
WE ARE USING THESE INDICATORS:
– EMA 50 APPLIED TO CLOSE, HIGH, AND LOW
– STOCHASTIC OSCILLATOR 10 3 3, simple and close/close
overbought at 80 and oversold at 20

Strategy Rules:
BUY ENTRY :
* If trading the 1H forex chart, both the 1H and 4H timeframes MUST BE OVER the 50 EMA. Is daily also the same? GREAT!
* If trading the 4H forex chart, both the 4H and the daily MUST BE OVER the 50 EMA. If weekly also is? GREAT!
SELL ENTRY :
* If trading the 1H forex chart, both the 1H and 4H timeframes MUST BE UNDER the 50 EMA. If daily also is? GREAT!
* If trading the 4H forex chart, both the 4H and the daily MUST BE UNDER the 50 EMA. If weekly also is? GREAT!

ENTRIES
Needless to say that all chart trends make HH and HL (bullish) and LL and LH (bearish).
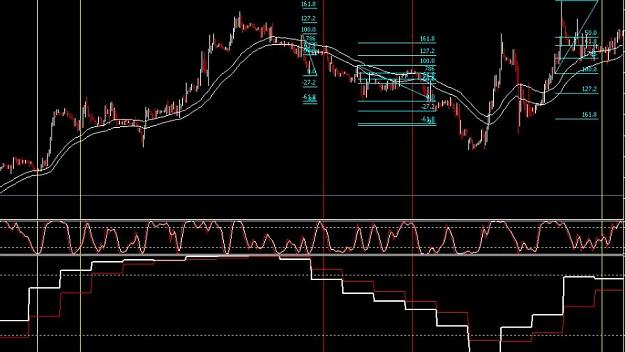
– When spotting the stochastic entering the overbought or oversold area, look for the current swing leg and draw the Fibonacci retracement.
– Our sweet spots are the 61.8 and 78.6 fib retracements. IF IT PASSES THESE FIB ZONES, OUR ENTRY IS OVER!
– Once a chart candle is closed and it makes the stochastic lines touch or become “SUPER CLOSE” in the overbought or oversold area, we open a trade at the open of the next chart candle. The best safe way is waiting for stoch to cross after the chart candle closes;
– If all the above things are met, but the pullback hasn’t reached at least the 61.8fib retracement, you can wait for a tap at it before entering, unless you have an excellent motive to get in before the “sweet spots.”
SL and TP
– Put the SL on the next fib area touched by the candles +10pips; since our sweet spots are the 78.6 and 61.8 fib retracement, usually our SL is above/below the last fib zone.
– TP is at -27 of the leg, so you have to adjust your fib configurations
TRADE MANAGEMENT
– Move to breakeven once it has reached the same amount of pips as your sl.
MARKET CONTEXT FOR ENTRIES
We’ve noticed that stochastic in the overbought/oversold zones at Daily and Weekly charts most often finalize accumulations on a lower time frames, in forex market trends can happen but usually for a small period of time in compared of course with stocks, so my backtesting considered taking 1H pullbacks when daily stochastic was moving from zone to zone, or 4H pullbacks when weekly stochastic were moving from zone to zone
We stop trading when both lines for the daily/weekly stochs reach the overbought/sold zone!
PLEASE DOWNLOAD THE MULTI-TIMEFRAME STOCHASTIC INDICATOR AVAILABLE Downbelow, or try the MT4 X SPEED.
*Please note that the only thing that may confuse is from which swing low or high to draw the fib retracement, the rule for this is simple, the fib must be placed from (bearish leg) Green candle till the next green candle down, and the opposite for long positions.
Read More: How to Trade Forex Breakout & Pullback