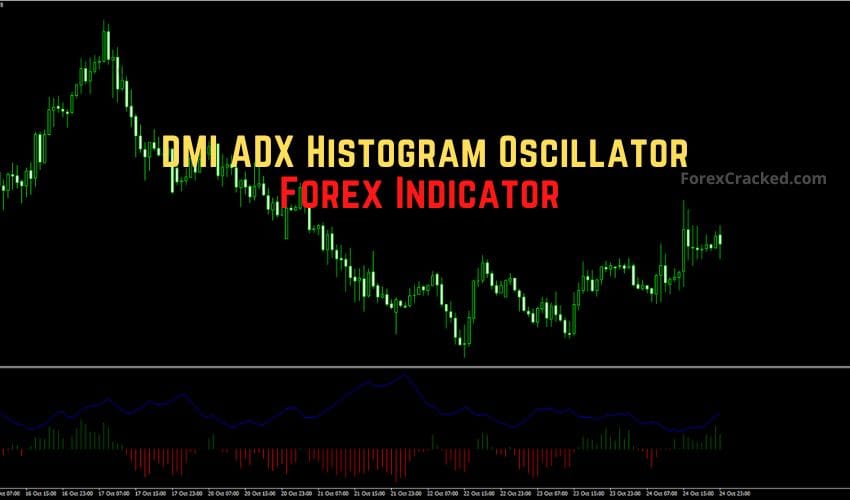

The DMI ADX Histogram Oscillator Indicator for MT4/MT5 is a powerful combination of two classic technical tools, the Average Directional Index (ADX) and the Directional Movement Index (DMI). Together, they provide a complete view of the market’s trend direction and strength, allowing traders to spot high-probability trade opportunities with confidence.
Whether you’re a scalper, swing trader, or position trader, this indicator helps you identify when a trend is forming, how strong it is, and when it may start weakening through a simple histogram display.
What Is the DMI ADX Histogram Oscillator Indicator?
The DMI ADX Histogram Oscillator takes trend analysis to the next level. The ADX measures trend strength, while the DMI reveals trend direction. When combined, they give traders both context and clarity.
This upgraded oscillator eliminates the traditional D+ and D– lines, providing a clean histogram view. The histogram bars reflect the difference between D+ and D–, while the ADX line acts as a confirmation of trend momentum.
- Green bars = Bullish momentum (uptrend)
- Red bars = Bearish momentum (downtrend)
- Zero line = Neutral zone (no clear trend)
This structure makes it visually clear when the market shifts from bullish to bearish or enters a consolidation.
Read More RSI Trend Catcher Signal Forex Indicator MT4 FREE Download
How the DMI ADX Histogram Oscillator Works
The DMI ADX Histogram indicator automatically calculates the difference between DMI+ (positive directional movement) and DMI– (negative directional movement), plotting it as a histogram. Meanwhile, the ADX line runs alongside the histogram, indicating the strength of the current trend.
This means you can identify:
- Trend direction → via histogram color (green/red)
- Trend strength → via ADX line value
- Trend momentum → via the height of histogram bars
Buy Signal – Catching Bullish Momentum
- Wait for the histogram to turn green and move above the zero line.
- Confirm that the ADX line is rising, indicating growing trend strength.
- Enter a BUY trade at the next candle close.
- Place a stop loss below the most recent swing low.
- Exit the trade when the histogram turns red or when ADX flattens.
Pro Tip: Strong bullish trends are usually confirmed when ADX is above 25–30, so always check ADX slope before entering.
Sell Signal – Catching Bearish Momentum
- Wait for the histogram to turn red and drop below the zero line.
- Confirm that the ADX line is rising, indicating strong bearish strength.
- Enter a SELL trade at the next candle close.
- Place a stop loss above the recent swing high.
- Exit when the histogram turns green or the ADX starts to fall.
Pro Tip: Bearish signals are more reliable when the ADX is rising, as it indicates strong seller participation.


Divergence Trading with the DMI ADX Histogram
One of the most powerful uses of this indicator is divergence trading. When the price forms a new high or low that isn’t matched by the histogram, it signals potential trend weakness or reversal.
For example:
- If price makes a higher high, but the histogram makes a lower high, it signals a bearish divergence → expect a trend reversal.
- If price makes a lower low, but the histogram makes a higher low, it signals a bullish divergence → expect a price rally soon.
Many professional traders rely on this divergence to spot reversals before they appear on the chart, giving them an early edge.
Example: DMI ADX Histogram on GBP/JPY (H4 Chart)
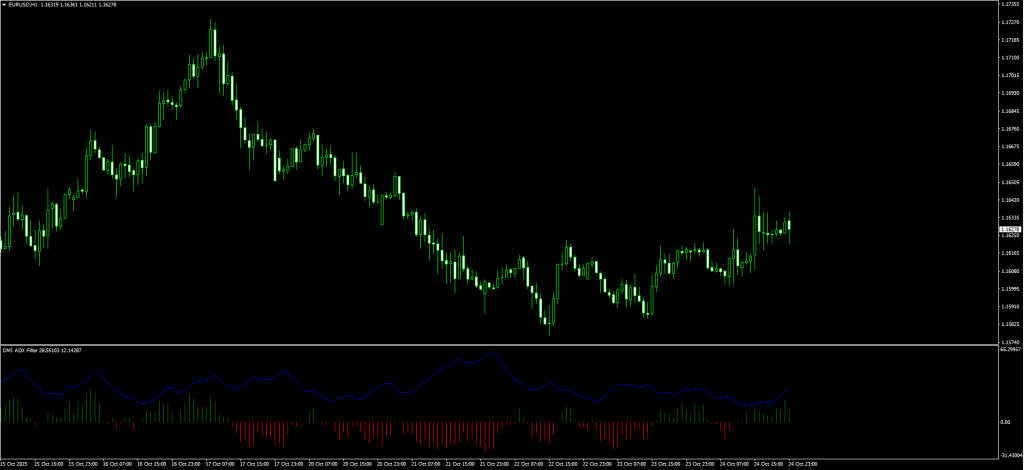
In the example below, the EUR/USD H1 chart shows how the histogram switched from red to green, confirming the start of a new uptrend. The ADX line was climbing above 25, signaling a strong bullish phase.
Later, as the histogram faded back to red while the ADX dropped, it clearly showed the weakening trend and the beginning of a retracement.
This clear visual feedback makes the DMI ADX Histogram Oscillator one of the easiest and most effective tools for identifying trend continuation and reversal zones.
Advantages of the DMI ADX Histogram Oscillator
- Combines trend direction and trend strength in one indicator
- Works on all markets: Forex, Crypto, Indices, Metals, and Stocks
- Perfect for intraday, swing, and long-term trading
- Simple color-coded display for quick chart analysis
- Detects divergence-based reversal setups early
- Simple and non-repainting
Limitations
- May generate false signals in flat or sideways markets
- Works best when mixed with price action or moving averages
- ADX lag may cause a delay in confirmation (normal behavior)
Free Download DMI ADX Histogram Oscillator Indicator
Read More AO Divergence Forex Indicator – Awesome Oscillator Divergence Trading Tool
Conclusion
The DMI ADX Histogram Oscillator Indicator for MT4/MT5 is an exceptional upgrade to the traditional ADX system. It not only identifies trend direction and strength simultaneously but also provides clear visual cues and early divergence signals for reversals.
For new traders, it’s an easy way to visualize trend dynamics. For experienced traders, it’s a precision tool for building multi-timeframe and advanced technical strategies.
Download the DMI ADX Histogram Oscillator Forex Indicator for MT4/MT5 today and start analyzing the market like a professional trend trader.
Frequently Asked Questions (FAQ)
1. Does the DMI ADX Histogram repaint?
No, the histogram and ADX line remain stable once the candle closes.
2. Can I use this indicator for scalping?
Yes, it performs well on M5–M30 charts, especially in volatile markets.
3. What ADX value indicates a strong trend?
An ADX above 25–30 indicates a solid trending market.
4. Does it work for crypto trading?
Yes, it’s fully compatible with crypto pairs like BTC/USD or ETH/USD.
5. Should I combine it with other tools?
For best results, use it alongside Moving Averages, RSI, or MACD.