

Introduction: Volume Tells the Story Price Alone Cannot
Every experienced trader knows the golden rule — volume precedes price. A breakout without volume backing it is a fake move waiting to trap you. A reversal supported by surging volume is the real deal.
The problem? Most MT4 indicators focus exclusively on price action. They ignore the single most important confirmation factor in technical analysis: volume.
The Percentage Volume Oscillator indicator for MT4 and MT5 fixes that gap. It applies MACD-style calculations directly to volume data, producing a histogram and moving average crossover system that tells you whether money is flowing into or out of a trend — before price confirms the move.
If you trade breakouts, reversals, or trend continuations and want volume confirmation baked into your signals, this indicator belongs on your chart. Available for both MetaTrader 4 and MetaTrader 5, we tested it across multiple pairs and timeframes. Here is our full review, a proven trading strategy, and a free download link.
Table of Contents
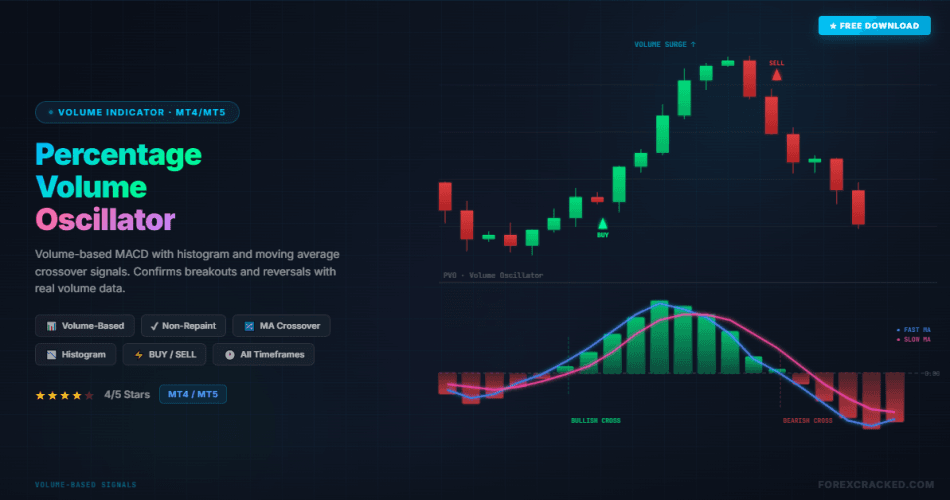
What Is the Percentage Volume Oscillator Indicator?
The Percentage Volume Oscillator (PVO) indicator for MT4 and MT5 is a momentum oscillator that measures the relationship between a short-period and long-period Exponential Moving Average (EMA) of volume. It displays the result as a percentage difference, plotted as a histogram with two moving average lines in a separate sub-window below the price chart.
How to read it:
- Histogram above zero line (GREEN bars): Volume momentum is bullish. More money is flowing into the market — confirming upward price moves.
- Histogram below zero line (RED bars): Volume momentum is bearish. Volume is declining or shifting to selling pressure — confirming downward price moves.
- BLUE moving average: The faster signal line that reacts quickly to volume changes.
- MAGENTA moving average: The slower baseline that smooths out volume noise.
- Moving average crossover: When the BLUE line crosses above the MAGENTA line, it signals bullish volume momentum. The reverse signals bearish volume momentum.
- GRAY zero line: The neutral reference point. Histogram bars above this line confirm bullish volume; bars below confirm bearish volume.
The real strength of this indicator is that it combines two confirmation layers — the moving average crossover AND the histogram polarity — giving you a higher-probability signal than either component alone.
Percentage Volume Oscillator vs. Standard MACD
The PVO looks identical to the MACD — but the underlying data is completely different. Here is why that matters:
| Feature | Percentage Volume Oscillator | Standard MACD |
|---|---|---|
| Data source | ✅ Volume (money flow) | ❌ Price only |
| Breakout confirmation | ✅ Confirms with volume surge | ⚠️ No volume validation |
| False breakout filtering | ✅ Low volume = skip the trade | ❌ Cannot filter by volume |
| Reversal detection | ✅ Volume divergence from price | ⚠️ Price-only divergence |
| Signal type | ✅ MA crossover + histogram | ✅ MA crossover + histogram |
| Repainting | ✅ Non-repainting | ✅ Non-repainting |
Verdict: If you already use the MACD but want volume-backed confirmation for breakouts and reversals, the Percentage Volume Oscillator is the missing piece in your trading system.
Review: Pros and Cons
Here are our honest test results after running this indicator on AUD/USD, EUR/USD, and GBP/JPY across M30 to Daily charts.
PROS (The Good)
- Volume-Based Signals: Unlike most oscillators that rely solely on price, this indicator gives you the raw truth about money flow — whether traders are actually committing capital to a move.
- Dual Confirmation System: The moving average crossover combined with histogram polarity creates a two-layer filter that reduces false signals compared to single-signal indicators.
- Non-Repainting: Once a candle closes, both the histogram bar and moving average positions are locked. No redrawing of past signals.
- Breakout Validation: The single best use case — confirming whether a breakout through support and resistance has genuine volume behind it.
- Clean Visual Layout: The color-coded histogram (GREEN/RED) with clearly separated moving averages (BLUE/MAGENTA) makes reading signals intuitive even for beginners.
CONS (The Bad)
- MT4 Volume Limitation: MT4 reports tick volume, not actual traded volume. While tick volume correlates with real volume on liquid pairs, this is a known limitation for all MT4 volume indicators.
- Not a Standalone System: Volume confirmation is powerful but should always be combined with a trend or price action indicator for entries.
- Lagging on Fast Timeframes: Like any EMA-based system, signals on M1 and M5 tend to lag. Best results come from M30 and above.
The Strategy: The “Volume Breakout Confirmation” System
Raw crossover signals produce too many trades in ranging markets. To maximize accuracy, we combine the Percentage Volume Oscillator with the 200 EMA as a trend filter and only enter when both the crossover and the histogram agree.
Setup & Settings
- Percentage Volume Oscillator: Default settings (12, 26, 9)
- 200 EMA: Applied to Close (Main Chart)
- Timeframe: M30 or H1 (Best signal quality)
1. The “Volume Surge” Buy Setup
We are looking to buy when volume confirms bullish momentum in an uptrend.
- The Trend Filter: Price must be ABOVE the 200 EMA. This confirms the dominant trend is Bullish.
- The Crossover: The BLUE moving average crosses ABOVE the MAGENTA moving average on the PVO indicator.
- The Confirmation: The histogram bars must be GREEN and positioned ABOVE the zero line.
- Entry: Buy at the close of the candle where all three conditions align.
- Stop Loss: Below the most recent swing low (typically 20-50 pips depending on the pair and timeframe).
- Take Profit: Target the nearest resistance level, or exit when the histogram bars start flipping RED or the moving averages cross in the opposite direction.
2. The “Volume Exhaustion” Sell Setup
We are looking to sell when volume confirms bearish momentum in a downtrend.
- The Trend Filter: Price must be BELOW the 200 EMA. This confirms the dominant trend is Bearish.
- The Crossover: The BLUE moving average crosses BELOW the MAGENTA moving average on the PVO indicator.
- The Confirmation: The histogram bars must be RED and positioned BELOW the zero line.
- Entry: Sell at the close of the candle where all three conditions align.
- Stop Loss: Above the most recent swing high.
- Take Profit: Target the nearest support level, or exit at the opposite crossover signal.
Pro Tip: The Percentage Volume Oscillator works exceptionally well near key support and resistance zones, channels, and triangle patterns. When price reaches a major level AND the PVO shows a volume surge, the probability of a genuine breakout or reversal increases dramatically.


Download a Collection of Indicators, Courses, and EA for FREE
Indicator Settings
The default settings (12, 26, 9) work well for most pairs and timeframes. However, you can customize:
| Parameter | Default | Scalping (M15-M30) | Swing (H4-Daily) |
|---|---|---|---|
| Short EMA Period | 12 | 8 (more responsive) | 16 (smoother) |
| Long EMA Period | 26 | 18 (faster signals) | 34 (less noise) |
| Signal Period | 9 | 5 (quicker trigger) | 12 (fewer false signals) |
How to Install (MT4 & MT5)
Below is a quick installation guide. For a detailed step-by-step walkthrough with screenshots, check our complete How to Install EA & Indicators in MT4/MT5 guide.
MT4 Installation
- Download the
.ex4or.mq4file from the link below. - Open MT4 → Go to File > Open Data Folder > MQL4 > Indicators.
- Paste the downloaded file into the Indicators folder.
- Restart MT4 or right-click Navigator panel and hit Refresh.
- Drag the Percentage Volume Oscillator indicator onto any chart — it will appear in the sub-window with the histogram and moving averages.
MT5 Installation
- Download the
.ex5or.mq5file from the link below. - Open MT5 → Go to File > Open Data Folder > MQL5 > Indicators. (Full MT5 install guide here)
- Paste the downloaded file into the Indicators folder.
- Restart MT5 or right-click Navigator panel and hit Refresh.
- Drag the Percentage Volume Oscillator indicator onto any chart — it will appear in the sub-window.
Final Verdict: Is the Percentage Volume Oscillator Indicator Worth Using?
Score: 4/5 Stars ⭐⭐⭐⭐
The Percentage Volume Oscillator indicator for MT4 and MT5 fills a genuine gap in most traders’ toolkits — volume confirmation. While 90% of indicators analyze price alone, the PVO tells you whether the money is actually following the move. The dual-layer signal system (moving average crossover + histogram polarity) significantly reduces false breakout entries compared to price-only indicators.
The MT4 tick volume limitation is worth noting, but in practice, tick volume on liquid pairs like EUR/USD and GBP/USD correlates strongly with real market volume. MT5 users have the added advantage of accessing real traded volume on supported brokers. The indicator is lightweight, non-repainting, and visually clean on both platforms.
Our recommendation: pair it with a trend filter like the 200 EMA and trade only when both the crossover and histogram confirm. This approach filtered out most losing trades in our testing.
If you want volume-backed trading signals without the complexity of reading raw volume data, download the Percentage Volume Oscillator indicator and test it on your demo account today.
This indicator pairs well with indicators from our Top 10 Best Free MT4 Indicators — read the full comparison with expert reviews and trading strategies.
Free Download Percentage Volume Oscillator Indicator
Mirror Download Percentage Volume Oscillator Indicator for MT4/MT5
FAQ: Frequently Asked Questions